Top 5 Miami Distressed Condo Sales Closed in October 2008
I found a total of 30 distressed condo sales that closed in the month of October in the MLS located in Brickell, Brickell Key, Downtown Miami and the Arts District. The following are, in my opinion, the five best deals that took place along with one worth mentioning.
- Skyline on Brickell – unit 2505 – 1 bedroom/1 bath (791 square feet) – This unit sold for $200,000, or $253 per square foot, on October 28, 2008. Foreclosure
- Vue at Brickell – unit 1501 – 2 bedroom/2 bath (1,255 square feet) – This unit sold for $170,000, or $135 per square foot, on October 17, 2008. Foreclosure
- Jade at Brickell – unit 504 – 1 bedroom/1 bath (895 square feet) – This unit sold for $220,000, or $246 per square foot, on October 24, 2008. Foreclosure
- Solaris at Brickell Bay – unit 1607 – 1 bedroom/1 bath (730 square feet) – This unit sold for $146,000, or $200 per square foot, on October 24, 2008. Foreclosure
- Courvoisier Courts – unit 704 – 2 bedroom/2.5 bath (1,230 square feet) – This unit sold for $290,000, or $236 per square foot, on October 22, 2008. Foreclosure
Runner-up: Jade – unit 3509 – 2 bedroom/3 bath (1,730 square feet) – This unit sold for $710,000, or $410 per square foot, on October 13, 2008. Foreclosure
Scoring Criteria for the Miami Condo Rankings Page
For detailed information regarding how these scores were created, please refer to the post entitled “Miami Condo Rankings Page Goes Live“.
New Miami Condos – Closings Rates for July 2008
The last closing rate update was published on May 28, 2008. I collected the data for this month’s update this past Sunday, July 6, 2008. This month, I also included the number of closed units below each graph in parentheses.

Below you will find the date that each condo development began closings followed by the number of closed units in each condo development:
Not much has changed with this first group of condo developments since the May update except with 50 Biscayne. It went from having around a 67% closing rate to about a 75% closing rate since the last update. However, I took a close look at the numbers and noticed that 26 of the 43 newly closed condos were deeded to TRG 50 Bisc Suites LLC. All 26 units were suite units. It appears as though The Related Group transferred these 26 units to another one of its own entities. I’m not exactly sure though. Even without these 26 units, 50 Biscayne would have had 17 newly closed units. Onyx on the Bay had 5 newly closed units.

Plaza on Brickell saw the most improvement in the group of condo developments above since the last update with a 13 point increase in closings. It now shows that 52% of the overall 1,000 units have closed. You’ll also find slight to moderate improvements in the other condo developments in this group. According to public records, Apogee South Beach now only needs 6 more condo units to close in order to reach 100%.

Marina Blue continued to show good improvement in this update with around a 14 point increase in closings. Marina Blue now has nearly 60 percent of its condos closed. Wind had an increase of around 11 points, Asia around 10 points and Avenue at Brickell slightly over 7 points.

Above is the newest batch of condo developments that recently began closings. I must say that I’m pretty impressed with 900 Biscayne Bay having 79 closed units within the past 2 months. It probably actually has 100 or more closed units by now since there can be a 2-3 week delay in the time that a condo closes and the time that the deed is recorded. It’s still too early to judge the other three condo developments in this group. The next update should shed a little more light. I did have a chance to tour Axis today for the first time. I’ll try to share some pictures with everyone towards the end of the week. By the way, I wasn’t able to find Met 1 which is why it wasn’t included in this update.
Disclaimer: The above closing rate information was derived from public County records. There can be a 2-3 week delay from the time that a closing occurs and the time that the closing is recorded.
Brickell Key Condo Index – June 2008

The following data was collected on June 27, 2008. It’s been quite some time since my last Brickell Key Condo Index. In fact, the last was published in January 2008, or 5 months ago. What’s interesting is that it has been one year since I started the Brickell Key Condo Index, so in this update we’ll be able to see how prices have fared over the past 12 months.
As many of you might have guessed, the average price per square foot of Brickell Key condos listed in the MLS has continued to go down since the January 2008 update. In fact, average list prices have gone down across the board throughout the 10 Brickell Key condo buildings represented in this index. I’ll show you the percentage decreases in each building towards the bottom of this post. In January 2008, the average price per square foot of condos listed in Brickell Key was $486.07. The average now stands at $450.49. That’s about a 7.3% drop in list prices in 5 months. More interesting is the drop since June 2007. At that time, the average price of condos listed in Brickell Key was at $519.97. That means list prices in Brickell Key have come down a little over a 13% in 12 months.

Average price per square foot of Brickell Key condos currently listed on the MLS:
The average price per square foot of condos that have sold within the past five months has gone down as well. This average dropped to $367.19 per square foot from the $416.92 that we saw in January 2008. This average stood at $445.59 in June 2007. That’s a 11.9% drop within 5 months and a 17.6% drop within 12 months. The average price per square foot for closed units at St. Louis was not included in this month’s index, however, because there haven’t been any closed sales within the past 6 months. That’s why you’ll see the absence of a bar for St. Louis in the graph below. The percentage drop may have been smaller had there been closings at St. Louis but nobody knows for sure since we don’t know where the market clearing value for these condos lies.

The average price per square foot of condos sold within the past six months:
- Brickell Key One – 520 Brickell Key Drive | 33131 | $321.16
- Brickell Key Two – 540 Brickell Key Drive | 33131 | $299.76
- Carbonell – 901 Brickell Key Drive | 33131 | $408.33
- Courts Brickell Key – 801 Brickell Key Drive | 33131 | $360.31
- Courvoisier Courts – 701 Brickell Key Drive | 33131 | $336.01
- Isola – 770 Claughton Island Drive | 33131 | $265.79
- One Tequesta Point – 888 Brickell Key Drive | 33131 | $392.33
- St. Louis – 800 Claughton Island Drive | 33131 | N/A
- Three Tequesta Point – 848 Brickell Key Drive | 33131 | $465.02
- Two Tequesta Point – 808 Brickell Key Drive | 33131 | $455.98
The chart below reveals additional statistics pertaining to the 10 aforementioned condo buildings in Brickell Key:

The first column to the right of each condo development is the difference in the average sales price and list price for this month, expressed as a percentage. As you can see, there is, in some cases, very large discrepancies in the average list price versus the average sales price for condos that have closed within the past six months. Notice the 36.75% difference in these two averages for Isola and about 29% differences for Brickell Key II and Carbonell. Wow! I guess list prices in these buildings still have a ways to go to catch up to price level where there’s actual demand to buy.
The second column is the number of active listings in each development currently in the MLS. The third column shows the percentage that these listings represent over the total number of condo units in each development. If you compare this month’s chart to the one published in January 2008, you’ll notice that the majority of the Brickell Key condo buildings have had a slight increase in the number of available listings. The cells highlighted in green reveal those developments that have active listings that represent less than 10 percent of the the overall units in the building. As I’ve stated before, I find this to be a very healthy number. The ones highlighted in red reveal those developments that have active listings that represent over 20 percent of the overall units in the building. Proceed with caution if you’re buying in a condo building where the available listings represents over 20 percent of the total number of units. Condo developments with active listings representing less than 10 percent of the overall condos are considered very safe, in my opinion, and anything in the 10-15 percent range is considered normal, even in a healthy market.
The fourth column shows the number of pending sales while the fifth column displays the number of closed sales within the past six months in the MLS. All of the buildings have had at least 3 closed sales within the past six months except St. Louis, which laid a fat goose egg. Two Tequesta Point experienced the most closings in that time frame with 9.
The sixth column shows the difference in the average list prices from January 2008 and this month, expressed a percentage. Those highlighted in red reveal those condo developments which have had a drop in their average list price. As you can see, each of the 10 buildings in Brickell Key, represented in this index, have experienced a drop in their average list prices within the past five months.
The seventh column reveals the difference in average sales prices from January 2008 and this month, expressed as a percentage. Only Two Tequesta Point and Three Tequesta Point have had increases in their average price per square foot for units sold within the past six months. With 9 and 6 closed sales, respectively, within the past six months, perhaps these two buildings have established a floor? I guess time will tell.
It’ll be interesting to see where prices for Brickell Key condos will reside in another 12 months. My take is that about 4 or 5 of these condo buildings are close to reaching their bottoms while the other half still needs at least another 4-6 months to reach that point.
Closings at Asia Have Begun
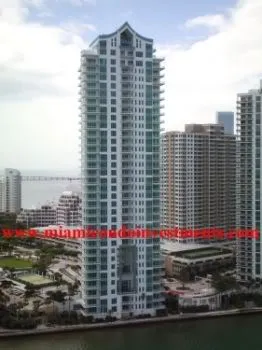

I received word today that closings at Asia began late last week. The outside of the building looks spectacular. I fully expect that the common areas and units will be just as impressive, if not more so. I’m hoping to get inside to view Asia for myself within the next couple of weeks.
For those not familiar with Asia, it is a very high-end condo development located on the northern end of Brickell Key, along the Miami River. With just 123 residences, each with 12-foot ceilings and private elevators, Asia is now regarded as the most exclusive address on Brickell Key.
I think Asia is going to do a good job in closing out its units. I haven’t received one phone call or email from a concerned contract holder of Asia. That’s saying something. In fact, it’s the only major new condo development where this is the case.
Assessing the Neighborhoods and Condo Buildings of Miami
A great comment was made this morning asking me for my take on the various neighborhoods in Miami. Excellent topic and one that I’m sure my non-local readers would appreciate.

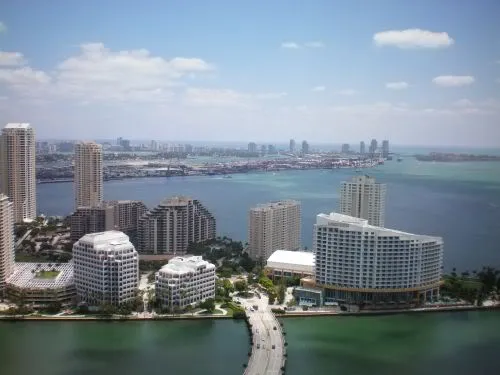
The map above is a portion of a larger map that was created by the Miami Downtown Development Authority. It is a great resource for people to see where various condo buildings throughout Miami are located. I realize that it is very difficult to view the above image. I do, however, have a PDF of the map on my file sharing page. Click on the file called “Miami Developments Map Aug07”. You may also want to view the file called “Miami Developments Report Aug07”. There you will find profile pages for several condo developments in Miami.
The map does not encompass all of Miami, however. It basically covers just those neighborhoods in Miami that had the most condo development during our recent boom. It also doesn’t show every condo development on the map. I’m not sure how far back it goes but my guess is that it only includes developments built since 2004.
The Neighborhoods of Miami
- Brickell – Brickell is also known as the financial district of Miami. A lot of large international banks are located in Brickell. Also, the majority of Miami’s condos are located in Brickell. When you see a picture of the Miami skyline you are most likely looking at the various condo buildings in Brickell.This is considered by most to be an affluent neighborhood. There are some very high-end condo buildings located in this neighborhood such as Four Seasons Residences and Santa Maria.However, there is a large supply of condos that has recently begun to hit the market in Brickell. Buyers will definitely have good opportunities and a lot of options within the next couple of years. You really need to research these buildings considerably if you intend to buy. There are some condo developments in Brickell that I feel are overpriced and will likely come down over the next 2-3 years. There are others that I feel are appealing to end-users. I also wanted to note that there is only one waterfront lot left in Brickell.
- Brickell Key – Many would say that Brickell Key is viewed as an exclusive neighborhood with its gated entry into the neighborhood and its paved brick roads. There isn’t much new inventory in Brickell Key that will hit the market within the next year. In fact, only 123 new condos will hit the market once Asia closes its units. Other than the small piece of land behind the Mandarin Oriental Hotel, there is no room left to build in Brickell Key which means that there probably won’t be any new supply there for many years. Many might argue that the large supply of condos in Brickell will have an effect on prices of condos located in Brickell Key. However, some would tell you that they only want to live in Brickell Key.
- Downtown Miami – In my opinion, Downtown Miami needs more infrastructure before it can become a great neighborhood. It’ll take some time but will eventually become a great place to live. My opinion is that until this becomes a realization current prices will be difficult to justify. Long-term though, I think Downtown Miami will be a very happening place to live.
- Park West – Park West is a small area of Miami that is located directly south of the MacArthur Causeway. It is currently comprised of four buildings. I’ve said it before and I’ll say it again, I believe this neighborhood has the greatest long-term potential for various reasons that I’ve mentioned in other posts. In the short-run, however, I feel that prices won’t go up until grocery stores, pharmacies, coffee shops, etc. become available in Park West. I’ve heard from various people that Gardener’s Market is negotiating a lease to open a store at the base of 900 Biscayne. Park West needs more of this.
- Arts District and Edgewater – The Arts District is a fairly large area. I typically regard it as beginning at the Carnival Center for the Performing Arts and ending on NE 36 Street, although everyone has their own definition. In my opinion, this will be the last neighborhood to turn around. There is still a lot of room to build on waterfront lots because there are a lot of run-down buildings that could easily be knocked down. It does have Margaret Pace Park though which is a fantastic park. I think opportunities for investors to buy in bulk will become available in some of the new buildings in the Arts District. I currently know of one.
I’d love to hear everyone’s thoughts and input.
Miami Condo Index – Brickell Key – January 2008

The Brickell Key Condo Index is back. I didn’t have time to provide a monthly update for December 2007. For those who have newly discovered this site, the Brickell Key Condo Index is a monthly post that provides important housing statistics pertaining to the 10 existing condo buildings located on Brickell Key. I also publish a monthly update pertaining to 17 well known buildings located in Brickell. Condos located in Downtown Miami and the Arts District of Miami will likely have their own index within the next six months. I’m just waiting for more buildings in those areas to be completed.
The average price per square foot of condos listed in Brickell Key has gone down since the November 2007 update. List prices have continued to drop each month since I began this index in June 2007. At that time, the average price per square foot of condos listed in Brickell was $519.97. It now stands at $486.07. That’s about a 6.5% drop in list prices in 7 months. These numbers are in line with the housing numbers that were released this past week. The weight-adjusted average also fell to $481.98 from November’s weight-adjusted average of $490.87.
Average price per square foot of Brickell Key condos currently listed on the MLS:

The average price per square foot of condos that have sold within the past six months has gone down as well. This average dropped to $416.92 per square foot from the $435.21 that we saw in November 2007. In June, this average stood at $445.59. The January average represents a 6.4% drop within the past 7 months. The weight-adjusted average also fell to $414.54 from November’s weight-adjusted average of $433.31.
The average price per square foot of condos sold within the past six months:
- Brickell Key One – 520 Brickell Key Drive | 33131 | $326.88
- Brickell Key Two – 540 Brickell Key Drive | 33131 | $398.70
- Carbonell – 901 Brickell Key Drive | 33131 | $481.29
- Courts Brickell Key – 801 Brickell Key Drive | 33131 | $466.49
- Courvoisier Courts – 701 Brickell Key Drive | 33131 | $444.20
- Isola – 770 Claughton Island Drive | 33131 | $342.72
- One Tequesta Point – 888 Brickell Key Drive | 33131 | $405.28
- St. Louis – 800 Claughton Island Drive | 33131 | $421.25
- Three Tequesta Point – 848 Brickell Key Drive | 33131 | $435.42
- Two Tequesta Point – 808 Brickell Key Drive | 33131 | $446.98
The chart below reveals additional statistics pertaining to the 10 existing condo buildings in Brickell Key:

The first column to the right of each condo development is the difference in the average sales price and list price for this month, expressed as a percentage. Courts Brickell Key was the only development that had a higher average sales price than list price.
The second column is the number of active listings in each development currently in the MLS. The third column shows the percentage that these listings represent over the total number of condo units in each development. The cells highlighted in green reveal those developments that have active listings that represent less than 10 percent of the the overall units in the building. As I’ve stated before, I find this to be a very healthy number. The ones highlighted in red reveal those developments that have active listings that represent over 20 percent of the overall units in the building. Proceed with caution! Condo developments with active listings representing less than 10 percent of the overall condos are considered very safe, in my opinion, and anything in the 10-15 percent range is considered normal, even in a healthy market.
The fourth column shows the number of pending sales while the fifth column displays the number of closed sales within the past two months. Since I didn’t have a December update, I decided to show the number of closed sales since November 28, 2007. As you can see, there have been 9 closed sales in Brickell Key within the past two months. There are currently 28 pending sales, however, 9 of these pending sales have been pending since August 2007 or longer. A few of them have been pending for over a year. I did notice that a good portion of the other 19 pending sales went pending within the first two weeks of the new year.
The sixth column shows the difference in the average list prices from November and this month, expressed a percentage. Those highlighted in red reveal those condo developments which have had a drop in their average list price while those highlighted in green reveal those that have had an increase. As you can see, Carbonell was the only condo building in Brickell Key that has had an increase in its average list price since November 2007. This is attributed to a penthouse condo that was listed the first week of December for around $1,500 per square foot!
The seventh column reveals the difference in average sales prices from November and this month, expressed as a percentage. Brickell Key I, Courts Brickell Key and Courvoisier Courts had average sales prices that were up from those found in November. The average at Isola dropped dramatically since November but not a lot can be made of it because only one closed sale in Isola has occurred within the past six months. It’s not a true average. However, three of the condos that have gone pending at Isola within the past three months have an average list price of $358 per square foot. This is close to the $342.72 price per square foot associated with the one condo that has sold within the past six months.
Some Great Deals at Today’s Real Estate Auction!!!
I wasn’t able to attend this morning’s real estate auction, held at the Miami Beach Convention Center, but did learn the results of several condos that were auctioned. From what I’ve heard, there were more people in attendance at this auction than the Hudson & Marshall auction held on October 21, 2007, which I did attend. However, properties auctioned today sold for much less.
Below are the results of some of the condos that were auctioned this morning:
- Courvoisier Courts – Unit 2312 – 3/2.5 – 1,655 SF (Brickell Key) – $540,000
- Isola – Unit 1509 – 1/1 – 735 SF – (Brickell Key) – $185,000
- Jade at Brickell Bay – Unit 502 – 2/2 – 1,460 SF – (Brickell) – $625,000
- Jade at Brickell Bay – BL45 – 2/3 – 1,730 SF (Brickell) – $735,000
- Murano Grande – Unit 805 – 2/2 – 1,400 SF (South Beach) – Withdrawn
- Neo Lofts – Unit 1006 – 2/2 – 1,109 SF (Miami River) – $185,000
- Ocean View – Unit 210 – 1/1.5 – 1,005 SF (Sunny Isles Beach) – $140,000
- Ocean View – Unit 909 – 1/1.5 – 1,005 SF (Sunny Isles Beach) – $160,000
- The Club at Brickell Bay – Unit 2114 – 1/1 – 818 SF (Brickell) – $180,000
- The Club at Brickell Bay – Unit 2603 – 1/1 – 825 SF (Brickell) – $175,000
- The Club at Brickell Bay – Unit 3102 – 3/2 – 1,232 SF (Brickell) – $225,000
- The Club at Brickell Bay – Unit 3202 – 3/2 – 1,232 SF (Brickell) – $270,000
- The Cosmopolitan – Unit 2603 – 2/2 – 1,010 SF (South Beach) – $405,000
- Vue at Brickell – Unit 811 – 1/1.5 – 796 SF (Brickell) – $180,000
- Vue at Brickell – Unit 3606 – 3/2 – 1,551 SF (Brickell) – $290,000
It’s interesting to note that the units at The Club at Brickell Bay and Vue at Brickell sold in the range of $187-$226 per square foot. I think we’ll be seeing much more of this in the months to come. The high bidders of the units in these two buildings at the Hudson & Marshall auction simply overpaid.
The two units at Jade sold for around $425 per square foot. I think the BL45 unit is a terrific buy!
In June of this year, I submitted an offer of $440,000 for a client on unit 2603 at The Cosmopolitan when it was a short-sale. The bank rejected our offer. We were prepared to close within 30 days. It sold today for $405,000. This happens all the time! It really frustrates me which I why I rarely will deal with a short-sale. Banks just don’t get it yet! It’s a better use of my time to wait until the bank takes it back and have my client buy it for much less.
Miami Condo Index – Brickell Key – November 2007

The average price per square foot of condos listed in Brickell Key has gone down once again, as it has every month since I began this index. The average price per square foot of the ten condos, which represent the Brickell Key Condo Index, fell to $494.61 this month from last month’s figure of $501.55. The weight-adjusted average also fell to $490.87 per square foot versus last month’s weight-adjusted average of $497.82.
Average price per square foot of Brickell Key condos currently listed on the MLS:

This is the first month since I began the Brickell Key Condo Index that the average price per square foot of condos sold over the previous six months has gone up. The average price per square foot of condos sold within the last six months increased to $435.21 from last month’s average of $430.08. The weight-adjusted average also increased to $433.31 from last month’s weight-adjusted average of $424.57. Most of this is attributed to the lack of closed sales at Brickell Key Two. A closed sale of $375 per square foot at Brickell Key Two fell off the average and was replaced by a new closed sale within the past month at $446 per square foot. One closed sale within the past six months encompassed the average in October and November. As I said, the lack of closed sales is to blame.
- Brickell Key One – 520 Brickell Key Drive | 33131 | $308.28
- Brickell Key Two – 540 Brickell Key Drive | 33131 | $445.83
- Carbonell – 901 Brickell Key Drive | 33131 | $535.63
- Courts Brickell Key – 801 Brickell Key Drive | 33131 | $435.03
- Courvoisier Courts – 701 Brickell Key Drive | 33131 | $424.63
- Isola – 770 Claughton Island Drive | 33131 | $440.14
- One Tequesta Point – 888 Brickell Key Drive | 33131 | $407.77
- St. Louis – 800 Claughton Island Drive | 33131 | $442.40
- Three Tequesta Point – 848 Brickell Key Drive | 33131 | $461.58
- Two Tequesta Point – 808 Brickell Key Drive | 33131 | $450.84

Additional statistics can be found in the chart below:

There have been a total of 6 closed sales within the past month which is much better than the pathetic 2 closings revealed in last month’s update. These 6 closings, however, were highly concentrated with 4 of the 6 closings residing at Carbonell. Pending sales have inched up to 18 from last month’s 16 pending sales.


