Brickell & Brickell Key Closed Condo Sales – November 2009
Click on the links below to view the condo sales in Brickell and Brickell Key closed in November 2009:

Brickell Closed Condo Sales – November 2009 – There were 30 closed condo sales in Brickell last month. The average sales price of these condos was $243 per square foot. I was surprised to see that a one bedroom condo at Skyline on Brickell sold for $334 per square foot.

Brickell Key Closed Condo Sales – November 2009 – 10 condos in Brickell Key closed last month. These sold at an average sales price per square foot of $258. Here I was shocked to see that someone would be willing to pay $294 per square foot for a unit at Isola, especially one with carpeting.
Top 5 Miami Distressed Condo Sales Closed in October 2008
I found a total of 30 distressed condo sales that closed in the month of October in the MLS located in Brickell, Brickell Key, Downtown Miami and the Arts District. The following are, in my opinion, the five best deals that took place along with one worth mentioning.
- Skyline on Brickell – unit 2505 – 1 bedroom/1 bath (791 square feet) – This unit sold for $200,000, or $253 per square foot, on October 28, 2008. Foreclosure
- Vue at Brickell – unit 1501 – 2 bedroom/2 bath (1,255 square feet) – This unit sold for $170,000, or $135 per square foot, on October 17, 2008. Foreclosure
- Jade at Brickell – unit 504 – 1 bedroom/1 bath (895 square feet) – This unit sold for $220,000, or $246 per square foot, on October 24, 2008. Foreclosure
- Solaris at Brickell Bay – unit 1607 – 1 bedroom/1 bath (730 square feet) – This unit sold for $146,000, or $200 per square foot, on October 24, 2008. Foreclosure
- Courvoisier Courts – unit 704 – 2 bedroom/2.5 bath (1,230 square feet) – This unit sold for $290,000, or $236 per square foot, on October 22, 2008. Foreclosure
Runner-up: Jade – unit 3509 – 2 bedroom/3 bath (1,730 square feet) – This unit sold for $710,000, or $410 per square foot, on October 13, 2008. Foreclosure
Brickell Key Condo Index – June 2008
The following data was collected on June 27, 2008. It’s been quite some time since my last Brickell Key Condo Index. In fact, the last was published in January 2008, or 5 months ago. What’s interesting is that it has been one year since I started the Brickell Key Condo Index, so in this update we’ll be able to see how prices have fared over the past 12 months.
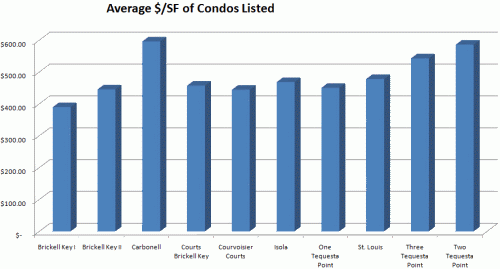
As many of you might have guessed, the average price per square foot of Brickell Key condos listed in the MLS has continued to go down since the January 2008 update. In fact, average list prices have gone down across the board throughout the 10 Brickell Key condo buildings represented in this index. I’ll show you the percentage decreases in each building towards the bottom of this post. In January 2008, the average price per square foot of condos listed in Brickell Key was $486.07. The average now stands at $450.49. That’s about a 7.3% drop in list prices in 5 months. More interesting is the drop since June 2007. At that time, the average price of condos listed in Brickell Key was at $519.97. That means list prices in Brickell Key have come down a little over a 13% in 12 months.

Average price per square foot of Brickell Key condos currently listed on the MLS:
The average price per square foot of condos that have sold within the past five months has gone down as well. This average dropped to $367.19 per square foot from the $416.92 that we saw in January 2008. This average stood at $445.59 in June 2007. That’s a 11.9% drop within 5 months and a 17.6% drop within 12 months. The average price per square foot for closed units at St. Louis was not included in this month’s index, however, because there haven’t been any closed sales within the past 6 months. That’s why you’ll see the absence of a bar for St. Louis in the graph below. The percentage drop may have been smaller had there been closings at St. Louis but nobody knows for sure since we don’t know where the market clearing value for these condos lies.

The average price per square foot of condos sold within the past six months:
- Brickell Key One – 520 Brickell Key Drive | 33131 | $321.16
- Brickell Key Two – 540 Brickell Key Drive | 33131 | $299.76
- Carbonell – 901 Brickell Key Drive | 33131 | $408.33
- Courts Brickell Key – 801 Brickell Key Drive | 33131 | $360.31
- Courvoisier Courts – 701 Brickell Key Drive | 33131 | $336.01
- Isola – 770 Claughton Island Drive | 33131 | $265.79
- One Tequesta Point – 888 Brickell Key Drive | 33131 | $392.33
- St. Louis – 800 Claughton Island Drive | 33131 | N/A
- Three Tequesta Point – 848 Brickell Key Drive | 33131 | $465.02
- Two Tequesta Point – 808 Brickell Key Drive | 33131 | $455.98
The chart below reveals additional statistics pertaining to the 10 aforementioned condo buildings in Brickell Key:

The first column to the right of each condo development is the difference in the average sales price and list price for this month, expressed as a percentage. As you can see, there is, in some cases, very large discrepancies in the average list price versus the average sales price for condos that have closed within the past six months. Notice the 36.75% difference in these two averages for Isola and about 29% differences for Brickell Key II and Carbonell. Wow! I guess list prices in these buildings still have a ways to go to catch up to price level where there’s actual demand to buy.
The second column is the number of active listings in each development currently in the MLS. The third column shows the percentage that these listings represent over the total number of condo units in each development. If you compare this month’s chart to the one published in January 2008, you’ll notice that the majority of the Brickell Key condo buildings have had a slight increase in the number of available listings. The cells highlighted in green reveal those developments that have active listings that represent less than 10 percent of the the overall units in the building. As I’ve stated before, I find this to be a very healthy number. The ones highlighted in red reveal those developments that have active listings that represent over 20 percent of the overall units in the building. Proceed with caution if you’re buying in a condo building where the available listings represents over 20 percent of the total number of units. Condo developments with active listings representing less than 10 percent of the overall condos are considered very safe, in my opinion, and anything in the 10-15 percent range is considered normal, even in a healthy market.
The fourth column shows the number of pending sales while the fifth column displays the number of closed sales within the past six months in the MLS. All of the buildings have had at least 3 closed sales within the past six months except St. Louis, which laid a fat goose egg. Two Tequesta Point experienced the most closings in that time frame with 9.
The sixth column shows the difference in the average list prices from January 2008 and this month, expressed a percentage. Those highlighted in red reveal those condo developments which have had a drop in their average list price. As you can see, each of the 10 buildings in Brickell Key, represented in this index, have experienced a drop in their average list prices within the past five months.
The seventh column reveals the difference in average sales prices from January 2008 and this month, expressed as a percentage. Only Two Tequesta Point and Three Tequesta Point have had increases in their average price per square foot for units sold within the past six months. With 9 and 6 closed sales, respectively, within the past six months, perhaps these two buildings have established a floor? I guess time will tell.
It’ll be interesting to see where prices for Brickell Key condos will reside in another 12 months. My take is that about 4 or 5 of these condo buildings are close to reaching their bottoms while the other half still needs at least another 4-6 months to reach that point.
Miami Condo Index – Brickell Key – January 2008

The Brickell Key Condo Index is back. I didn’t have time to provide a monthly update for December 2007. For those who have newly discovered this site, the Brickell Key Condo Index is a monthly post that provides important housing statistics pertaining to the 10 existing condo buildings located on Brickell Key. I also publish a monthly update pertaining to 17 well known buildings located in Brickell. Condos located in Downtown Miami and the Arts District of Miami will likely have their own index within the next six months. I’m just waiting for more buildings in those areas to be completed.
The average price per square foot of condos listed in Brickell Key has gone down since the November 2007 update. List prices have continued to drop each month since I began this index in June 2007. At that time, the average price per square foot of condos listed in Brickell was $519.97. It now stands at $486.07. That’s about a 6.5% drop in list prices in 7 months. These numbers are in line with the housing numbers that were released this past week. The weight-adjusted average also fell to $481.98 from November’s weight-adjusted average of $490.87.
Average price per square foot of Brickell Key condos currently listed on the MLS:

The average price per square foot of condos that have sold within the past six months has gone down as well. This average dropped to $416.92 per square foot from the $435.21 that we saw in November 2007. In June, this average stood at $445.59. The January average represents a 6.4% drop within the past 7 months. The weight-adjusted average also fell to $414.54 from November’s weight-adjusted average of $433.31.
The average price per square foot of condos sold within the past six months:
- Brickell Key One – 520 Brickell Key Drive | 33131 | $326.88
- Brickell Key Two – 540 Brickell Key Drive | 33131 | $398.70
- Carbonell – 901 Brickell Key Drive | 33131 | $481.29
- Courts Brickell Key – 801 Brickell Key Drive | 33131 | $466.49
- Courvoisier Courts – 701 Brickell Key Drive | 33131 | $444.20
- Isola – 770 Claughton Island Drive | 33131 | $342.72
- One Tequesta Point – 888 Brickell Key Drive | 33131 | $405.28
- St. Louis – 800 Claughton Island Drive | 33131 | $421.25
- Three Tequesta Point – 848 Brickell Key Drive | 33131 | $435.42
- Two Tequesta Point – 808 Brickell Key Drive | 33131 | $446.98
The chart below reveals additional statistics pertaining to the 10 existing condo buildings in Brickell Key:

The first column to the right of each condo development is the difference in the average sales price and list price for this month, expressed as a percentage. Courts Brickell Key was the only development that had a higher average sales price than list price.
The second column is the number of active listings in each development currently in the MLS. The third column shows the percentage that these listings represent over the total number of condo units in each development. The cells highlighted in green reveal those developments that have active listings that represent less than 10 percent of the the overall units in the building. As I’ve stated before, I find this to be a very healthy number. The ones highlighted in red reveal those developments that have active listings that represent over 20 percent of the overall units in the building. Proceed with caution! Condo developments with active listings representing less than 10 percent of the overall condos are considered very safe, in my opinion, and anything in the 10-15 percent range is considered normal, even in a healthy market.
The fourth column shows the number of pending sales while the fifth column displays the number of closed sales within the past two months. Since I didn’t have a December update, I decided to show the number of closed sales since November 28, 2007. As you can see, there have been 9 closed sales in Brickell Key within the past two months. There are currently 28 pending sales, however, 9 of these pending sales have been pending since August 2007 or longer. A few of them have been pending for over a year. I did notice that a good portion of the other 19 pending sales went pending within the first two weeks of the new year.
The sixth column shows the difference in the average list prices from November and this month, expressed a percentage. Those highlighted in red reveal those condo developments which have had a drop in their average list price while those highlighted in green reveal those that have had an increase. As you can see, Carbonell was the only condo building in Brickell Key that has had an increase in its average list price since November 2007. This is attributed to a penthouse condo that was listed the first week of December for around $1,500 per square foot!
The seventh column reveals the difference in average sales prices from November and this month, expressed as a percentage. Brickell Key I, Courts Brickell Key and Courvoisier Courts had average sales prices that were up from those found in November. The average at Isola dropped dramatically since November but not a lot can be made of it because only one closed sale in Isola has occurred within the past six months. It’s not a true average. However, three of the condos that have gone pending at Isola within the past three months have an average list price of $358 per square foot. This is close to the $342.72 price per square foot associated with the one condo that has sold within the past six months.
The $400K Price Point for 2 Bedroom Condos Has Been Breached
Only 12 months ago, finding a 2 bedroom in a desirable condo development throughout Brickell and Brickell Key for less than $500,000 seemed like quite a bargain. How times have changed! Nowadays, the new figure seems to be $400,000.
Neo Vertika currently has 11 two bedroom condos that are priced for under $400,000, Isola has 2, Courvoisier Courts has 3, One Miami has 7, Solaris at Brickell has 1, The Club at Brickell Bay (surprisingly only) has 2, The Mark on Brickell has 3 and Vue at Brickell has 11 (with 2 of the 11 two bedroom condos priced for under $300,000).
With the additional inventory, from the soon-to-be completed condo developments, I think the $400,000 price point for 2 bedroom condos in desirable condo buildings throughout Brickell and Brickell Key will become more commonplace in 2008.
Of course, the size and square footage of the condos needs to be taken into consideration. Most of these new condo developments are delivering 2 bedrooms that have 1,145-1,300 square feet. Anything larger will, of course, fetch higher prices. It should go without saying that 2 bedroom units at ultra-luxury condo buildings such as Jade, Four Seasons and Santa Maria are exempt from this discussion.
I’m actually looking forward to the opening of Plaza on Brickell in January. In my opinion, it offers the best value in Brickell. I think within 3-4 months after it opens we’ll see aggressively priced 2 bedroom condos throughout Brickell approach the $350,000 mark.
I was at the Plaza on Brickell sales office last week with out-of-the-country clients and we were both shocked by the prices that were offered. The prices had come down considerably since September, when they last visited the sales center with me. One bedroom units now start at around $210,000 and two bedroom condos start at around $340,000. Investors have become more motivated to sell as their closing date approaches.
A few days after I visited the sales center with my clients they told me that “at these prices we would regret not making an offer”. They are looking to hold for about 10 years. Where else in Brickell can you get such prices, much less in a brand new development? I think Plaza on Brickell will act as the buoy for the Brickell condo market.
This is why many investment groups have their eyes set on Plaza on Brickell. They all want to buy units in bulk at a deep discount to get positive cash flow. However, I don’t think that this will happen at this development. I think prices offered, at the present time, are appealing enough to end-users. They, too, have their eyes on the Miami condo market because it is in their own backyard.
I know from reading your comments lately that you all are very opinionated. So I ask you, where do you think 2 bedroom units will ultimately be priced? More specifically, where do you think the top 10% best priced two bedroom condos in the well known Brickell developments will be priced by the end of 2008?
Miami Condo Index – Brickell Key – November 2007

The average price per square foot of condos listed in Brickell Key has gone down once again, as it has every month since I began this index. The average price per square foot of the ten condos, which represent the Brickell Key Condo Index, fell to $494.61 this month from last month’s figure of $501.55. The weight-adjusted average also fell to $490.87 per square foot versus last month’s weight-adjusted average of $497.82.
Average price per square foot of Brickell Key condos currently listed on the MLS:

This is the first month since I began the Brickell Key Condo Index that the average price per square foot of condos sold over the previous six months has gone up. The average price per square foot of condos sold within the last six months increased to $435.21 from last month’s average of $430.08. The weight-adjusted average also increased to $433.31 from last month’s weight-adjusted average of $424.57. Most of this is attributed to the lack of closed sales at Brickell Key Two. A closed sale of $375 per square foot at Brickell Key Two fell off the average and was replaced by a new closed sale within the past month at $446 per square foot. One closed sale within the past six months encompassed the average in October and November. As I said, the lack of closed sales is to blame.
- Brickell Key One – 520 Brickell Key Drive | 33131 | $308.28
- Brickell Key Two – 540 Brickell Key Drive | 33131 | $445.83
- Carbonell – 901 Brickell Key Drive | 33131 | $535.63
- Courts Brickell Key – 801 Brickell Key Drive | 33131 | $435.03
- Courvoisier Courts – 701 Brickell Key Drive | 33131 | $424.63
- Isola – 770 Claughton Island Drive | 33131 | $440.14
- One Tequesta Point – 888 Brickell Key Drive | 33131 | $407.77
- St. Louis – 800 Claughton Island Drive | 33131 | $442.40
- Three Tequesta Point – 848 Brickell Key Drive | 33131 | $461.58
- Two Tequesta Point – 808 Brickell Key Drive | 33131 | $450.84

Additional statistics can be found in the chart below:

There have been a total of 6 closed sales within the past month which is much better than the pathetic 2 closings revealed in last month’s update. These 6 closings, however, were highly concentrated with 4 of the 6 closings residing at Carbonell. Pending sales have inched up to 18 from last month’s 16 pending sales.
Yet Another Auction
I wanted to make everyone aware of another auction that will be held December 15, 2007 at the Miami Beach Convention Center in South Beach. I’ve perused the list of condos to be auctioned and it looks like there are some quality condos on the list. Below you will find some of the condos that will be auctioned:
- Courvoisier Courts – Unit 2312 – 3/2.5 – 1,655 SF (Brickell Key)
- Isola Brickell Key – Unit ??? – ??? – ??? SF (Brickell Key)
- Jade at Brickell – Unit 502 – 2/2 – 1,460 SF (Brickell)
- Jade – Unit ???? – ??? – ???? SF (Brickell)
- Murano Grande – Unit 805 – 2/2 – 1,400 SF (South Beach)
- Neo Lofts – Unit 1006 – 2/2 – 1,109 SF (Miami River)
- Ocean View – Unit 210 – 1/1 – ??? SF (Sunny Isles Beach)
- Ocean View – Unit ??? – ??? – 1,225 SF (Sunny Isles Beach)
- Royal Atlantic – Unit 209 – 1/1 – 654 SF (South Beach)
- The Club at Brickell Bay – Unit 2114 – 1/1 – 818 SF (Brickell)
- The Club at Brickell Bay – Unit 2603 – 1/1 – 825 SF (Brickell)
- The Club at Brickell Bay – Unit 3102 – 3/2 – 1,232 SF (Brickell)
- The Club at Brickell Bay – Unit 3202 – 3/2 – 1,232 SF (Brickell)
- The Cosmopolitan – Unit 2603 – 2/2 – 1,010 SF (South Beach)
- Vue at Brickell – Unit ??? – ??? – ??? SF (Brickell)
- Vue at Brickell – Unit 3606 – 3/2 – 1,551 SF (Brickell)
Contact me if you’d like more information about this auction so I can register you. There’s a 5 percent buyer’s premium and a $5,000 cashier’s check is required the day of the auction. The balance of 5 percent of the total price will be due the day of the auction if you are the highest bidder. Inspections must be conducted prior to bidding.
Miami Condo Index – Brickell Key – October 2007

The following statistics were collected on October 27, 2007 but I wasn’t able to compile and publish the numbers until today.
Each month since I began this index, the average price per square foot of condos listed in Brickell Key have gone down slightly when compared to the prior month. This month is no different. The average price per square foot of the ten condos, which represent the Brickell Key Condo Index, fell to $501.55 this month from last month’s figure of $505.30. The weight-adjusted average also fell to $497.82 per square foot versus last month’s weight-adjusted average of $501.64.

The average price per square foot of condos sold over the previous six months has also continually gone down each month since I began this index. The average price per square foot of condos sold within the last six months dropped to $430.08 from last month’s average of $432.94. The weight-adjusted average also fell to $424.57 from last month’s weight-adjusted average of $428.59.
- Brickell Key One – 520 Brickell Key Drive | 33131 | $310.76
- Brickell Key Two – 540 Brickell Key Drive | 33131 | $375.00
- Carbonell – 901 Brickell Key Drive | 33131 | $517.32
- Courts Brickell Key – 801 Brickell Key Drive | 33131 | $435.03
- Courvoisier Courts – 701 Brickell Key Drive | 33131 | $424.63
- Isola – 770 Claughton Island Drive | 33131 | $437.40
- One Tequesta Point – 888 Brickell Key Drive | 33131 | $413.07
- St. Louis – 800 Claughton Island Drive | 33131 | $451.18
- Three Tequesta Point – 848 Brickell Key Drive | 33131 | $479.76
- Two Tequesta Point – 808 Brickell Key Drive | 33131 | $456.63
As with October’s Brickell Condo Index, I’ve provided the following snapshot to make it easier for everyone to make sense of the statistics above.

The first column, to the right of each condo development’s name, is the difference in the average sales and list prices for the statistics at the top, expressed as a percentage. As you can see, each development has an average six month sales price that is well below the list price that is prevalent in the market at each condo building in Brickell Key.
The second column is the number of active listings in each development currently in the MLS. The third column shows the percentage that these listings represent over the total number of condo units in each development. The cells highlighted in green reveal those developments that have active listings that represent less than 10 percent of the the overall units in the building. I find this to be a very healthy number. The 10-15 percent range is considered average while the 15-20 percent range is beginning to approach dangerous levels. The ones highlighted in red reveal those developments that have active listings that represent over 20 percent of the overall units in the building. This indicates that the danger zone has been breached and caution should be heeded. Of the ten developments in the Brickell Key Condo Index, only Courvoisier Courts falls into this territory with 24.26 percent of the building currently on the market.

The fourth column shows the number of pending sales while the fifth column displays the number of closed sales since September’s Brickell Key Condo Index. As you can see, there are 16 pending sales in Brickell Key. The 7 pending sales at Carbonell and 3 at Isola may help to prevent each from penetrating the dangerous 20 percent mark next month. There’s been a total of 2 closed sales since last month’s statistics were presented. September revealed 3 closed sales while 4 transactions closed over the previous month in August. Hopefully, next month won’t reveal the lonely number of 1 or even 0. The One and Three Tequesta Point sisters brought their A-game this past month to prevent a goose egg from appearing in this month’s closed sales figure.
The sixth column shows you the difference in the average list prices from this and last month’s, expressed a percentage. Those highlighted in red reveal those condo buildings which had a drop in their average list price while those highlighted in green show those that had an increase. One Tequesta Point was the only development that was able to muster an up-tick in prices for condos listed.
The seventh column reveals the difference in average sales prices from this and last month’s, expressed as a percentage. The cells displayed in green show those which had an increase, the one in yellow reveals an unchanged condition while those in red reveal a decrease. You may notice that I colored St. Louis in green although it shows 0.00 percent. The average price per square foot of condos sold at St. Louis over the past six months actually inched up 2 cents per square foot. Carbonell and Two Tequesta Point were the only other two to increase. The rest of the bunch fell.

For months, I’ve been saying that Brickell Key is the best indicator that we have of the Miami condo market. Each month, list and sales prices in Brickell Key have come down steadily, as they should be. It’s almost as if we can count on it to provide a true picture.
I have a prediction, however. Take it for what you will because this is just my prediction. The Brickell Key Condo Index will continue on its steady decline. Most of the developments located on Brickell Key were completed prior to 2004, so speculative money in Miami, for the most part, doesn’t reside there. Brickell Key also enjoys a very small percentage of foreclosures and short-sales.
Brickell, however, with its high number of foreclosures and short-sales, prevalent mortgage fraud and large number of new condos coming onto the market will be much faster to correct itself. It won’t have a steady decline. It will crash beyond Brickell Key statistics but then rise at a much higher rate than condo developments in Brickell Key. I think Plaza on Brickell will act as a buoy. I’m not saying that prices at Plaza on Brickell won’t dip lower after closings. I’m just saying that as prices at Plaza on Brickell fall, so will other prices in Brickell but prices at Plaza will act as a floor.
The following graph displays what I have in mind. The line at the top, towards the beginning of the graph, represents Brickell, while the one below it represents Brickell Key. Sorry for the amateurish work but I still need to go trick-or-treating tonight.

It’s not exactly what I have in mind but it gives you an idea. I don’t think the average price per square foot of Brickell condo developments will rise at such a rapid pace as which is indicated by the final portion of the drawing above but I do think that it will fall below, then rise back above that of Brickell Key. The developments in Brickell will, for the most part, be much newer and will draw heavier demand. New speculative money already has their eye on Brickell. Brickell Key will bounce once buyers for Brickell condos flood the market and those who are left behind will look towards Brickell Key. Brickell Key should, in my opinion, sell above Brickell, but I think the world-renowned attention to Brickell, and its oversupply problem, will draw a level of demand that inverts the situation.
What do you all think? Does this make sense or am I out of my mind?
Miami Condo Index – Brickell Key – September 2007

The Brickell Key Condo Index continues to represent the true condition of the condo market in Miami. Its counterpart, the Brickell Condo Index, has become the red-headed stepchild and has failed to provide any true insight into the state of the market.
Until the fraud in Brickell has been squashed, I would keep a closer eye on the Brickell Key Condo Index to better ascertain how progression towards the equilibrium of supply and demand is being achieved.
List prices have continued to fall in Brickell Key. This month, the average price per square foot of condos listed in Brickell Key fell to $505.30 from last month’s figure of $507.22. The weight-adjusted average dropped to $501.64 versus last month’s weight-adjusted average of $502.76.
The continued decline in list prices in Brickell Key is a good indication that sellers are finally “getting it”. If a condo owner is truly motivated to sell their condo then they should aggressively price their unit accordingly. Sellers that are priced in the middle or high end of the pack, and are waiting for the “right” buyer to come along, will save themselves, and their Realtor, time and effort by taking their condo off the market. Matters will only worsen once the new condo inventory hits the market and buyers are given more options. If you NEED to sell, then your one and only shot at it is now.

I was surprised to see that condos listed at Two Tequesta Point were priced over $50 per square foot higher than those listed at Three Tequesta Point. It didn’t make sense to me so I was compelled to investigate. A 2/2.5 listing at Two Tequesta Point immediately jumped out at me that was priced at $1.85M, or $1,042 per square foot. The condo was highly remodeled and looked fabulous, but not $1,000+ per square foot fabulous. In fact, a 2/2.5 seven floors higher in the same line is listed at $998,000. I’m pretty sure that the upgrades in the condo priced at $1.85M aren’t worth $852,000. This is a perfect example of a seller who is waiting for the “right” buyer to come along. Good luck!
The average price per square foot for condos listed at Isola also surprised me. I think we’ll see this number penetrate the $500 per square foot mark on the downside once more sellers of condos listed at Isola finally “get it”. I’m more impressed with St. Louis than I am Isola, but both will eventually have list prices well below $500 per square foot.
The average price per square foot of condos sold within the past six months has also dropped from last month’s average of $437.34 per square foot to this month’s average of $432.94 per square foot. The weight-adjusted average has fallen to $428.59 from last month’s figure of $433.97.
- Brickell Key One – 520 Brickell Key Drive | 33131 | $310.76
- Brickell Key Two – 540 Brickell Key Drive | 33131 | $401.79
- Carbonell – 901 Brickell Key Drive | 33131 | $502.63
- Courts Brickell Key – 801 Brickell Key Drive | 33131 | $439.35
- Courvoisier Courts – 701 Brickell Key Drive | 33131 | $429.45
- Isola – 770 Claughton Island Drive | 33131 | $444.28
- One Tequesta Point – 888 Brickell Key Drive | 33131 | $416.33
- St. Louis – 800 Claughton Island Drive | 33131 | $451.16
- Three Tequesta Point – 848 Brickell Key Drive | 33131 | $480.92
- Two Tequesta Point – 808 Brickell Key Drive | 33131 | $452.72

The following is for those of you have just discovered this blog. The first figure below, beside each building name, represents the total numbers of active listings in that building. The number to the right of that, in parentheses, is the number of currently listed condos in each building expressed as a percentage of the total number of condos. The third number represents the number of pending sales in the building while the fourth is the number of closed sales within the past month
- Brickell Key One – 20 (6.33%) | 4 | 0
- Brickell Key Two – 47 (11.90%) | 0 | 0
- Carbonell – 57 (20.07%) | 4 | 1
- Courts Brickell Key – 42 (13.17%) | 0 | 0
- Courvoisier Courts – 63 (23.16%) | 1 | 0
- Isola – 59 (19.67%) | 2 | 0
- One Tequesta Point – 22 (7.61%) | 2 | 0
- St. Louis – 9 (6.72%) | 0 | 0
- Three Tequesta Point – 28 (11.76%) | 0 | 0
- Two Tequesta Point – 26 (9.67%) | 2 | 2
There have been a total of three closed sales within the past month, which is a decline from last month’s total of four closed sales. The number of pending sales has also moved downward from 17 to 15. It appears that two of last month’s pending sales have reached the closing table within the past month, which indicates to me that there has only been one new condo under contract in Brickell Key within one month’s time. Only one condo in all of Brickell Key has been executed within the past month? That can’t be good. This is assuming that none of the pending sales ran into problems within the past month. Best-case scenario is that one contract within the past month has been executed in Brickell Key. The worst-case scenario is that none have been. One word comes to mind…”Holy-tamale-mother-of-god-this-is-one-bad-situation”.
Overall, the condos listed in Brickell Key represent 13.25% of the condos that reside in Brickell Key. That’s actually a relatively healthy figure. However, the figure that is not healthy is the “months of inventory”. Let’s assume an average of four closings per month, as we’ve seen. That means that if closings continued at the same pace and all inventory were to stop right now, it would take 7.77 years to absorb the present inventory. That’s not so good. Do you sellers get it yet? I’m pretty sure that the buyers get it.


