Fun Fact Friday: Every Building Swire Builds Is Blessed By Monks… Twice
We find ourselves praising Swire Properties regularly. They move trees from their development sites to local parks rather than cutting them down, they donate money to The Underline (Miami’s answer to New York’s High Line), they spend $31 million on a climate ribbon that cools their shopping center, protects shoppers from the elements and looks really nice from every angle. Now, we also learn that each and every building that Swire Properties builds is blessed by monks at least twice.
The Hong Kong based developer has a tradition of flying monks to their build site at groundbreaking for a blessing ceremony. The ceremony is repeated once the project is complete. In 2005, Carbonell was even able to be blessed by the Dalai Lama himself! Brickell City Centre was blessed multiple times. First, there was a blessing ceremony at groundbreaking, then the East Hotel was blessed upon completion. Reach and Rise received their own completion ceremonies with the East Hotel receiving an additional blessing at this time. When the mall opened, the entire project was blessed again. Talk about counting our blessings! Here are the other buildings in the area that were built by Swire Properties:
Brickell Key One (1982)
Brickell Key Two (1991)
One Tequesta Point (1995)
Courvoisier Courts (1997)
Two Tequesta Point (1998)
Three Tequesta Point (2001)
Courts at Brickell Key (2003)
Jade Residences at Brickell Bay (2004)
Carbonell (2005)
Now that’s what we call #Blessed!!
Brickell Key Buildings With Tennis Courts

Yesterday we honored the 2017 Miami Open by taking an in-depth look at all of the new construction buildings coming to the area that will offer tennis courts, but what is out there for those who need to move more quickly? Here are our suggestions for buildings that are already constructed and also have onsite tennis facilities.
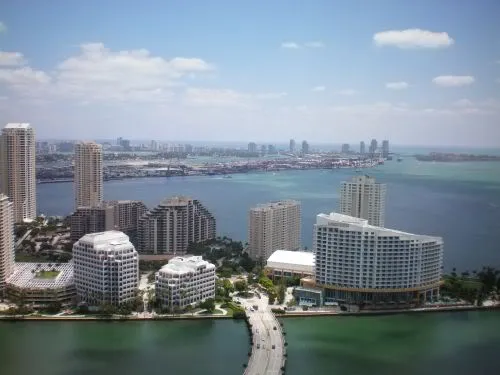
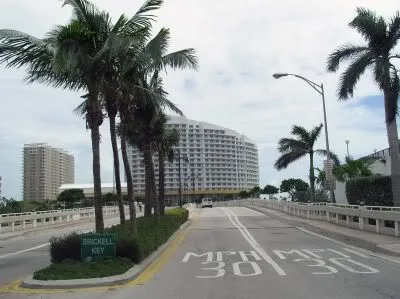
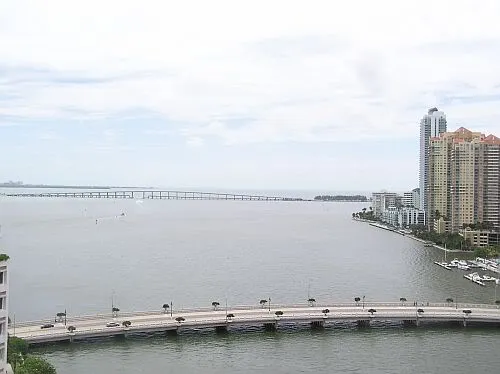
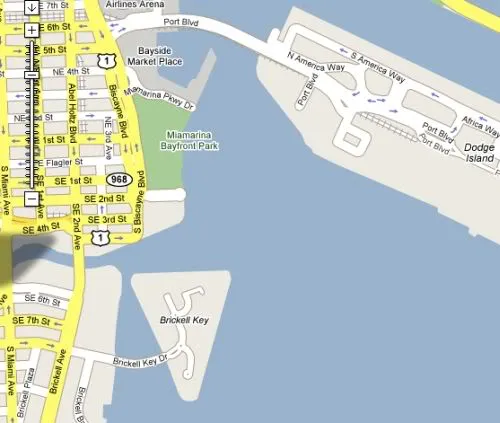
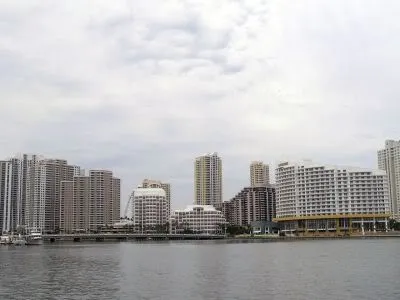
Brickell Key has the largest concentration of buildings with tennis courts in the area. For those who don’t know, it is a private island with 11 residential buildings, most of which were built in the 1980’s through the early 2000’s. Given the fact that it is situated behind a guard gate and the large array of family-friendly amenities, the island is very popular for families with young children.
The newest and most luxurious building on the island is Asia. It was built in 2008 and has 123 residences. Some of the amenities include private elevators and fingerprint access. Prices range from around $1 million to the $12.8 million penthouse. Rental prices range from $4,500/month to $12,000/ month.
The most affordable buildings with tennis courts are Brickell Key 1 & Brickell Key 2. Brickell Key 1 was the first building to be constructed on the island in 1982, followed by Brickell Key 2 in 1991. Together, they offer a resort-like feel and share a tennis court. Prices currently start at $220,000 for a studio and average $425/square foot. Rental prices start at $1,750 for 1 bedrooms and $2,500 for 2 bedrooms. Every now and again you can catch a studio for $1,550 or a 3 bedroom for $3,000.
On the south side of the island, next to the Mandarin Oriental Hotel, is Isola Condo. It was built in 1990 with 1 and 2 bedroom plans and has availability ranging from $260,000 – $600,000. Rental prices range from $1,750-$2,800.
Carbonell is located on the northern tip of the island and offers larger floor plans that range in price from $469,000 to $2.35 million. It was built in 2005 and has amazing unobstructed water views from most all of the apartments. Even the apartments facing south have nice water views over the island. Rental prices range from $2,700 for a 1 bedroom that is over 1,000 square feet up to $9,700 for a 2,860 square foot 4 bedroom and amazing wraparound terrace.
If you are interested in courts of all kinds, I would suggest Courts at Brickell Key. They have tennis, racquetball AND squash courts (hence the name). Apartments at Courts range from 863 one bedrooms up to 1,878 three bedrooms. Their prices range from $359,000 to $1.4 million for sales and $2,050/month to $4,900/month for rentals.
On the top of the hill are the Tequesta buildings. The newest is Three Tequesta Point, which also has a tennis court. This building was built in 2001 and also offers larger floor plans. The one bedrooms start at 1,087 square feet and $490,000. The largest unit is a 3,739 square foot 46th floor penthouse that is $3.825 million. Tenants can find opportunities between $2,950/month up to $14,700 for that same 46th floor penthouse.
Something that many people are unaware of is that Two Tequesta Point shares amenities with Three Tequesta Point, so residents of both towers share a tennis court. The apartments in Two Tequesta Point are slightly smaller, but just as beautiful. They range from $400,000 for a 907 square foot 1 bedroom up to $1.95 million for a 2,510 square foot 3 bedroom on the 34th floor. Rentals range from $2,500/month for a 1 bedroom up to $7,250/month for a 3 bedroom. Two Tequesta Point is also in the process of having its lobby renovated, which can be previewed here.
It is important to note that the prices we have discussed are valid for today, March 29, 2017. Since these are resales and rentals, they could change at any moment depending upon the market. If you would like to discuss specific availability, we are always here to help. Tomorrow, we will head back over to the mainland for a tour of Brickell condo buildings that have tennis courts!
Top 5 Miami Distressed Condo Sales in December 2008
Sorry for the long hiatus. I’m back from my long vacation and ready to get back to work. Below, you will find what I believe to be the five best condo deals of the 36 distressed sales that closed in the month of December in the MLS located in Brickell, Brickell Key, Downtown Miami and the Arts District.
- Four Seasons Residences – unit 3305 – 1 bedroom/1 bath (611 square feet) – This unit sold for $285,000, or $466 per square foot, on December 3, 2008. Foreclosure
- Carbonell – unit 701 – 1 bedroom/1.5 bath (1,031 square feet) – This unit sold for $215,000, or $209 per square foot, on December 19, 2008. Foreclosure
- Three Tequesta Point – unit 1605 – 2 bedroom/2 bath (1,694 square feet) – This unit sold for $465,000, or $275 per square foot, on December 3, 2008. Foreclosure
- Blue Condominium – unit 2310 – 2 bedroom/2 bath (1,174 square feet) – This unit sold for $330,000, or $281 per square foot, on December 1, 2008. Foreclosure
- Cite on the Bay – unit 3502 – 3 bedroom/2 bath (1,398 square feet) – This unit sold for $230,000, or $165 per square foot, on December 10, 2008. Short-sale
Brickell Key Condo Index – June 2008

The following data was collected on June 27, 2008. It’s been quite some time since my last Brickell Key Condo Index. In fact, the last was published in January 2008, or 5 months ago. What’s interesting is that it has been one year since I started the Brickell Key Condo Index, so in this update we’ll be able to see how prices have fared over the past 12 months.
As many of you might have guessed, the average price per square foot of Brickell Key condos listed in the MLS has continued to go down since the January 2008 update. In fact, average list prices have gone down across the board throughout the 10 Brickell Key condo buildings represented in this index. I’ll show you the percentage decreases in each building towards the bottom of this post. In January 2008, the average price per square foot of condos listed in Brickell Key was $486.07. The average now stands at $450.49. That’s about a 7.3% drop in list prices in 5 months. More interesting is the drop since June 2007. At that time, the average price of condos listed in Brickell Key was at $519.97. That means list prices in Brickell Key have come down a little over a 13% in 12 months.

Average price per square foot of Brickell Key condos currently listed on the MLS:
The average price per square foot of condos that have sold within the past five months has gone down as well. This average dropped to $367.19 per square foot from the $416.92 that we saw in January 2008. This average stood at $445.59 in June 2007. That’s a 11.9% drop within 5 months and a 17.6% drop within 12 months. The average price per square foot for closed units at St. Louis was not included in this month’s index, however, because there haven’t been any closed sales within the past 6 months. That’s why you’ll see the absence of a bar for St. Louis in the graph below. The percentage drop may have been smaller had there been closings at St. Louis but nobody knows for sure since we don’t know where the market clearing value for these condos lies.

The average price per square foot of condos sold within the past six months:
- Brickell Key One – 520 Brickell Key Drive | 33131 | $321.16
- Brickell Key Two – 540 Brickell Key Drive | 33131 | $299.76
- Carbonell – 901 Brickell Key Drive | 33131 | $408.33
- Courts Brickell Key – 801 Brickell Key Drive | 33131 | $360.31
- Courvoisier Courts – 701 Brickell Key Drive | 33131 | $336.01
- Isola – 770 Claughton Island Drive | 33131 | $265.79
- One Tequesta Point – 888 Brickell Key Drive | 33131 | $392.33
- St. Louis – 800 Claughton Island Drive | 33131 | N/A
- Three Tequesta Point – 848 Brickell Key Drive | 33131 | $465.02
- Two Tequesta Point – 808 Brickell Key Drive | 33131 | $455.98
The chart below reveals additional statistics pertaining to the 10 aforementioned condo buildings in Brickell Key:

The first column to the right of each condo development is the difference in the average sales price and list price for this month, expressed as a percentage. As you can see, there is, in some cases, very large discrepancies in the average list price versus the average sales price for condos that have closed within the past six months. Notice the 36.75% difference in these two averages for Isola and about 29% differences for Brickell Key II and Carbonell. Wow! I guess list prices in these buildings still have a ways to go to catch up to price level where there’s actual demand to buy.
The second column is the number of active listings in each development currently in the MLS. The third column shows the percentage that these listings represent over the total number of condo units in each development. If you compare this month’s chart to the one published in January 2008, you’ll notice that the majority of the Brickell Key condo buildings have had a slight increase in the number of available listings. The cells highlighted in green reveal those developments that have active listings that represent less than 10 percent of the the overall units in the building. As I’ve stated before, I find this to be a very healthy number. The ones highlighted in red reveal those developments that have active listings that represent over 20 percent of the overall units in the building. Proceed with caution if you’re buying in a condo building where the available listings represents over 20 percent of the total number of units. Condo developments with active listings representing less than 10 percent of the overall condos are considered very safe, in my opinion, and anything in the 10-15 percent range is considered normal, even in a healthy market.
The fourth column shows the number of pending sales while the fifth column displays the number of closed sales within the past six months in the MLS. All of the buildings have had at least 3 closed sales within the past six months except St. Louis, which laid a fat goose egg. Two Tequesta Point experienced the most closings in that time frame with 9.
The sixth column shows the difference in the average list prices from January 2008 and this month, expressed a percentage. Those highlighted in red reveal those condo developments which have had a drop in their average list price. As you can see, each of the 10 buildings in Brickell Key, represented in this index, have experienced a drop in their average list prices within the past five months.
The seventh column reveals the difference in average sales prices from January 2008 and this month, expressed as a percentage. Only Two Tequesta Point and Three Tequesta Point have had increases in their average price per square foot for units sold within the past six months. With 9 and 6 closed sales, respectively, within the past six months, perhaps these two buildings have established a floor? I guess time will tell.
It’ll be interesting to see where prices for Brickell Key condos will reside in another 12 months. My take is that about 4 or 5 of these condo buildings are close to reaching their bottoms while the other half still needs at least another 4-6 months to reach that point.
Miami Condo Index – Brickell Key – January 2008

The Brickell Key Condo Index is back. I didn’t have time to provide a monthly update for December 2007. For those who have newly discovered this site, the Brickell Key Condo Index is a monthly post that provides important housing statistics pertaining to the 10 existing condo buildings located on Brickell Key. I also publish a monthly update pertaining to 17 well known buildings located in Brickell. Condos located in Downtown Miami and the Arts District of Miami will likely have their own index within the next six months. I’m just waiting for more buildings in those areas to be completed.
The average price per square foot of condos listed in Brickell Key has gone down since the November 2007 update. List prices have continued to drop each month since I began this index in June 2007. At that time, the average price per square foot of condos listed in Brickell was $519.97. It now stands at $486.07. That’s about a 6.5% drop in list prices in 7 months. These numbers are in line with the housing numbers that were released this past week. The weight-adjusted average also fell to $481.98 from November’s weight-adjusted average of $490.87.
Average price per square foot of Brickell Key condos currently listed on the MLS:

The average price per square foot of condos that have sold within the past six months has gone down as well. This average dropped to $416.92 per square foot from the $435.21 that we saw in November 2007. In June, this average stood at $445.59. The January average represents a 6.4% drop within the past 7 months. The weight-adjusted average also fell to $414.54 from November’s weight-adjusted average of $433.31.
The average price per square foot of condos sold within the past six months:
- Brickell Key One – 520 Brickell Key Drive | 33131 | $326.88
- Brickell Key Two – 540 Brickell Key Drive | 33131 | $398.70
- Carbonell – 901 Brickell Key Drive | 33131 | $481.29
- Courts Brickell Key – 801 Brickell Key Drive | 33131 | $466.49
- Courvoisier Courts – 701 Brickell Key Drive | 33131 | $444.20
- Isola – 770 Claughton Island Drive | 33131 | $342.72
- One Tequesta Point – 888 Brickell Key Drive | 33131 | $405.28
- St. Louis – 800 Claughton Island Drive | 33131 | $421.25
- Three Tequesta Point – 848 Brickell Key Drive | 33131 | $435.42
- Two Tequesta Point – 808 Brickell Key Drive | 33131 | $446.98
The chart below reveals additional statistics pertaining to the 10 existing condo buildings in Brickell Key:

The first column to the right of each condo development is the difference in the average sales price and list price for this month, expressed as a percentage. Courts Brickell Key was the only development that had a higher average sales price than list price.
The second column is the number of active listings in each development currently in the MLS. The third column shows the percentage that these listings represent over the total number of condo units in each development. The cells highlighted in green reveal those developments that have active listings that represent less than 10 percent of the the overall units in the building. As I’ve stated before, I find this to be a very healthy number. The ones highlighted in red reveal those developments that have active listings that represent over 20 percent of the overall units in the building. Proceed with caution! Condo developments with active listings representing less than 10 percent of the overall condos are considered very safe, in my opinion, and anything in the 10-15 percent range is considered normal, even in a healthy market.
The fourth column shows the number of pending sales while the fifth column displays the number of closed sales within the past two months. Since I didn’t have a December update, I decided to show the number of closed sales since November 28, 2007. As you can see, there have been 9 closed sales in Brickell Key within the past two months. There are currently 28 pending sales, however, 9 of these pending sales have been pending since August 2007 or longer. A few of them have been pending for over a year. I did notice that a good portion of the other 19 pending sales went pending within the first two weeks of the new year.
The sixth column shows the difference in the average list prices from November and this month, expressed a percentage. Those highlighted in red reveal those condo developments which have had a drop in their average list price while those highlighted in green reveal those that have had an increase. As you can see, Carbonell was the only condo building in Brickell Key that has had an increase in its average list price since November 2007. This is attributed to a penthouse condo that was listed the first week of December for around $1,500 per square foot!
The seventh column reveals the difference in average sales prices from November and this month, expressed as a percentage. Brickell Key I, Courts Brickell Key and Courvoisier Courts had average sales prices that were up from those found in November. The average at Isola dropped dramatically since November but not a lot can be made of it because only one closed sale in Isola has occurred within the past six months. It’s not a true average. However, three of the condos that have gone pending at Isola within the past three months have an average list price of $358 per square foot. This is close to the $342.72 price per square foot associated with the one condo that has sold within the past six months.
Miami Condo Index – Brickell Key – November 2007

The average price per square foot of condos listed in Brickell Key has gone down once again, as it has every month since I began this index. The average price per square foot of the ten condos, which represent the Brickell Key Condo Index, fell to $494.61 this month from last month’s figure of $501.55. The weight-adjusted average also fell to $490.87 per square foot versus last month’s weight-adjusted average of $497.82.
Average price per square foot of Brickell Key condos currently listed on the MLS:

This is the first month since I began the Brickell Key Condo Index that the average price per square foot of condos sold over the previous six months has gone up. The average price per square foot of condos sold within the last six months increased to $435.21 from last month’s average of $430.08. The weight-adjusted average also increased to $433.31 from last month’s weight-adjusted average of $424.57. Most of this is attributed to the lack of closed sales at Brickell Key Two. A closed sale of $375 per square foot at Brickell Key Two fell off the average and was replaced by a new closed sale within the past month at $446 per square foot. One closed sale within the past six months encompassed the average in October and November. As I said, the lack of closed sales is to blame.
- Brickell Key One – 520 Brickell Key Drive | 33131 | $308.28
- Brickell Key Two – 540 Brickell Key Drive | 33131 | $445.83
- Carbonell – 901 Brickell Key Drive | 33131 | $535.63
- Courts Brickell Key – 801 Brickell Key Drive | 33131 | $435.03
- Courvoisier Courts – 701 Brickell Key Drive | 33131 | $424.63
- Isola – 770 Claughton Island Drive | 33131 | $440.14
- One Tequesta Point – 888 Brickell Key Drive | 33131 | $407.77
- St. Louis – 800 Claughton Island Drive | 33131 | $442.40
- Three Tequesta Point – 848 Brickell Key Drive | 33131 | $461.58
- Two Tequesta Point – 808 Brickell Key Drive | 33131 | $450.84

Additional statistics can be found in the chart below:

There have been a total of 6 closed sales within the past month which is much better than the pathetic 2 closings revealed in last month’s update. These 6 closings, however, were highly concentrated with 4 of the 6 closings residing at Carbonell. Pending sales have inched up to 18 from last month’s 16 pending sales.
Miami Condo Index – Brickell Key – October 2007

The following statistics were collected on October 27, 2007 but I wasn’t able to compile and publish the numbers until today.
Each month since I began this index, the average price per square foot of condos listed in Brickell Key have gone down slightly when compared to the prior month. This month is no different. The average price per square foot of the ten condos, which represent the Brickell Key Condo Index, fell to $501.55 this month from last month’s figure of $505.30. The weight-adjusted average also fell to $497.82 per square foot versus last month’s weight-adjusted average of $501.64.

The average price per square foot of condos sold over the previous six months has also continually gone down each month since I began this index. The average price per square foot of condos sold within the last six months dropped to $430.08 from last month’s average of $432.94. The weight-adjusted average also fell to $424.57 from last month’s weight-adjusted average of $428.59.
- Brickell Key One – 520 Brickell Key Drive | 33131 | $310.76
- Brickell Key Two – 540 Brickell Key Drive | 33131 | $375.00
- Carbonell – 901 Brickell Key Drive | 33131 | $517.32
- Courts Brickell Key – 801 Brickell Key Drive | 33131 | $435.03
- Courvoisier Courts – 701 Brickell Key Drive | 33131 | $424.63
- Isola – 770 Claughton Island Drive | 33131 | $437.40
- One Tequesta Point – 888 Brickell Key Drive | 33131 | $413.07
- St. Louis – 800 Claughton Island Drive | 33131 | $451.18
- Three Tequesta Point – 848 Brickell Key Drive | 33131 | $479.76
- Two Tequesta Point – 808 Brickell Key Drive | 33131 | $456.63
As with October’s Brickell Condo Index, I’ve provided the following snapshot to make it easier for everyone to make sense of the statistics above.

The first column, to the right of each condo development’s name, is the difference in the average sales and list prices for the statistics at the top, expressed as a percentage. As you can see, each development has an average six month sales price that is well below the list price that is prevalent in the market at each condo building in Brickell Key.
The second column is the number of active listings in each development currently in the MLS. The third column shows the percentage that these listings represent over the total number of condo units in each development. The cells highlighted in green reveal those developments that have active listings that represent less than 10 percent of the the overall units in the building. I find this to be a very healthy number. The 10-15 percent range is considered average while the 15-20 percent range is beginning to approach dangerous levels. The ones highlighted in red reveal those developments that have active listings that represent over 20 percent of the overall units in the building. This indicates that the danger zone has been breached and caution should be heeded. Of the ten developments in the Brickell Key Condo Index, only Courvoisier Courts falls into this territory with 24.26 percent of the building currently on the market.

The fourth column shows the number of pending sales while the fifth column displays the number of closed sales since September’s Brickell Key Condo Index. As you can see, there are 16 pending sales in Brickell Key. The 7 pending sales at Carbonell and 3 at Isola may help to prevent each from penetrating the dangerous 20 percent mark next month. There’s been a total of 2 closed sales since last month’s statistics were presented. September revealed 3 closed sales while 4 transactions closed over the previous month in August. Hopefully, next month won’t reveal the lonely number of 1 or even 0. The One and Three Tequesta Point sisters brought their A-game this past month to prevent a goose egg from appearing in this month’s closed sales figure.
The sixth column shows you the difference in the average list prices from this and last month’s, expressed a percentage. Those highlighted in red reveal those condo buildings which had a drop in their average list price while those highlighted in green show those that had an increase. One Tequesta Point was the only development that was able to muster an up-tick in prices for condos listed.
The seventh column reveals the difference in average sales prices from this and last month’s, expressed as a percentage. The cells displayed in green show those which had an increase, the one in yellow reveals an unchanged condition while those in red reveal a decrease. You may notice that I colored St. Louis in green although it shows 0.00 percent. The average price per square foot of condos sold at St. Louis over the past six months actually inched up 2 cents per square foot. Carbonell and Two Tequesta Point were the only other two to increase. The rest of the bunch fell.

For months, I’ve been saying that Brickell Key is the best indicator that we have of the Miami condo market. Each month, list and sales prices in Brickell Key have come down steadily, as they should be. It’s almost as if we can count on it to provide a true picture.
I have a prediction, however. Take it for what you will because this is just my prediction. The Brickell Key Condo Index will continue on its steady decline. Most of the developments located on Brickell Key were completed prior to 2004, so speculative money in Miami, for the most part, doesn’t reside there. Brickell Key also enjoys a very small percentage of foreclosures and short-sales.
Brickell, however, with its high number of foreclosures and short-sales, prevalent mortgage fraud and large number of new condos coming onto the market will be much faster to correct itself. It won’t have a steady decline. It will crash beyond Brickell Key statistics but then rise at a much higher rate than condo developments in Brickell Key. I think Plaza on Brickell will act as a buoy. I’m not saying that prices at Plaza on Brickell won’t dip lower after closings. I’m just saying that as prices at Plaza on Brickell fall, so will other prices in Brickell but prices at Plaza will act as a floor.
The following graph displays what I have in mind. The line at the top, towards the beginning of the graph, represents Brickell, while the one below it represents Brickell Key. Sorry for the amateurish work but I still need to go trick-or-treating tonight.

It’s not exactly what I have in mind but it gives you an idea. I don’t think the average price per square foot of Brickell condo developments will rise at such a rapid pace as which is indicated by the final portion of the drawing above but I do think that it will fall below, then rise back above that of Brickell Key. The developments in Brickell will, for the most part, be much newer and will draw heavier demand. New speculative money already has their eye on Brickell. Brickell Key will bounce once buyers for Brickell condos flood the market and those who are left behind will look towards Brickell Key. Brickell Key should, in my opinion, sell above Brickell, but I think the world-renowned attention to Brickell, and its oversupply problem, will draw a level of demand that inverts the situation.
What do you all think? Does this make sense or am I out of my mind?
Miami Condo Index – Brickell Key – September 2007

The Brickell Key Condo Index continues to represent the true condition of the condo market in Miami. Its counterpart, the Brickell Condo Index, has become the red-headed stepchild and has failed to provide any true insight into the state of the market.
Until the fraud in Brickell has been squashed, I would keep a closer eye on the Brickell Key Condo Index to better ascertain how progression towards the equilibrium of supply and demand is being achieved.
List prices have continued to fall in Brickell Key. This month, the average price per square foot of condos listed in Brickell Key fell to $505.30 from last month’s figure of $507.22. The weight-adjusted average dropped to $501.64 versus last month’s weight-adjusted average of $502.76.
The continued decline in list prices in Brickell Key is a good indication that sellers are finally “getting it”. If a condo owner is truly motivated to sell their condo then they should aggressively price their unit accordingly. Sellers that are priced in the middle or high end of the pack, and are waiting for the “right” buyer to come along, will save themselves, and their Realtor, time and effort by taking their condo off the market. Matters will only worsen once the new condo inventory hits the market and buyers are given more options. If you NEED to sell, then your one and only shot at it is now.

I was surprised to see that condos listed at Two Tequesta Point were priced over $50 per square foot higher than those listed at Three Tequesta Point. It didn’t make sense to me so I was compelled to investigate. A 2/2.5 listing at Two Tequesta Point immediately jumped out at me that was priced at $1.85M, or $1,042 per square foot. The condo was highly remodeled and looked fabulous, but not $1,000+ per square foot fabulous. In fact, a 2/2.5 seven floors higher in the same line is listed at $998,000. I’m pretty sure that the upgrades in the condo priced at $1.85M aren’t worth $852,000. This is a perfect example of a seller who is waiting for the “right” buyer to come along. Good luck!
The average price per square foot for condos listed at Isola also surprised me. I think we’ll see this number penetrate the $500 per square foot mark on the downside once more sellers of condos listed at Isola finally “get it”. I’m more impressed with St. Louis than I am Isola, but both will eventually have list prices well below $500 per square foot.
The average price per square foot of condos sold within the past six months has also dropped from last month’s average of $437.34 per square foot to this month’s average of $432.94 per square foot. The weight-adjusted average has fallen to $428.59 from last month’s figure of $433.97.
- Brickell Key One – 520 Brickell Key Drive | 33131 | $310.76
- Brickell Key Two – 540 Brickell Key Drive | 33131 | $401.79
- Carbonell – 901 Brickell Key Drive | 33131 | $502.63
- Courts Brickell Key – 801 Brickell Key Drive | 33131 | $439.35
- Courvoisier Courts – 701 Brickell Key Drive | 33131 | $429.45
- Isola – 770 Claughton Island Drive | 33131 | $444.28
- One Tequesta Point – 888 Brickell Key Drive | 33131 | $416.33
- St. Louis – 800 Claughton Island Drive | 33131 | $451.16
- Three Tequesta Point – 848 Brickell Key Drive | 33131 | $480.92
- Two Tequesta Point – 808 Brickell Key Drive | 33131 | $452.72

The following is for those of you have just discovered this blog. The first figure below, beside each building name, represents the total numbers of active listings in that building. The number to the right of that, in parentheses, is the number of currently listed condos in each building expressed as a percentage of the total number of condos. The third number represents the number of pending sales in the building while the fourth is the number of closed sales within the past month
- Brickell Key One – 20 (6.33%) | 4 | 0
- Brickell Key Two – 47 (11.90%) | 0 | 0
- Carbonell – 57 (20.07%) | 4 | 1
- Courts Brickell Key – 42 (13.17%) | 0 | 0
- Courvoisier Courts – 63 (23.16%) | 1 | 0
- Isola – 59 (19.67%) | 2 | 0
- One Tequesta Point – 22 (7.61%) | 2 | 0
- St. Louis – 9 (6.72%) | 0 | 0
- Three Tequesta Point – 28 (11.76%) | 0 | 0
- Two Tequesta Point – 26 (9.67%) | 2 | 2
There have been a total of three closed sales within the past month, which is a decline from last month’s total of four closed sales. The number of pending sales has also moved downward from 17 to 15. It appears that two of last month’s pending sales have reached the closing table within the past month, which indicates to me that there has only been one new condo under contract in Brickell Key within one month’s time. Only one condo in all of Brickell Key has been executed within the past month? That can’t be good. This is assuming that none of the pending sales ran into problems within the past month. Best-case scenario is that one contract within the past month has been executed in Brickell Key. The worst-case scenario is that none have been. One word comes to mind…”Holy-tamale-mother-of-god-this-is-one-bad-situation”.
Overall, the condos listed in Brickell Key represent 13.25% of the condos that reside in Brickell Key. That’s actually a relatively healthy figure. However, the figure that is not healthy is the “months of inventory”. Let’s assume an average of four closings per month, as we’ve seen. That means that if closings continued at the same pace and all inventory were to stop right now, it would take 7.77 years to absorb the present inventory. That’s not so good. Do you sellers get it yet? I’m pretty sure that the buyers get it.
Miami Condo Index – Brickell Key – August 2007

Welcome to the third installment of the Brickell Key Condo Index. I have included a few additional statistics to provide a more comprehensive view of the market. This change will be implemented in the Brickell and South Beach Condo Indices in September. I will now report the number of available listings, pending sales and closed sales in each building, as well as express the number of available listings as a percentage of the overall units in each. I have done away with the sold-to-listed ratio since that statistic has not revealed much insight into the market. It can also be easily calculated with the figures that I provide if someone wishes to track that statistic.
The average price per square foot of condos currently listed in the ten buildings below in Brickell Key has dropped this month to $507.22 versus $515.71 in July. The weight-adjusted average has dropped to $502.76 versus $510.83.
The average price per square foot of condos sold in the past six months in Brickell Key has dropped this month to $437.34 versus $442.69 in July. The weight-adjusted average has dropped to $433.97 from $439.02. Brickell Key has proven to be a much more reliable source as to the state of the market in Miami than Brickell. I have yet to find any closed sales that indicate mortgage fraud in Brickell Key as I have in Brickell. This is not to say that mortgage fraud has not occurred in Brickell Key, but I haven’t found any since I began tracking the market in June.
- Brickell Key One – 520 Brickell Key Drive | 33131 | $330.61
- Brickell Key Two – 540 Brickell Key Drive | 33131 | $409.79
- Carbonell – 901 Brickell Key Drive | 33131 | $498.08
- Courts Brickell Key – 801 Brickell Key Drive | 33131 | $441.59
- Courvoisier Courts – 701 Brickell Key Drive | 33131 | $415.01
- Isola – 770 Claughton Island Drive | 33131 | $471.85
- One Tequesta Point – 888 Brickell Key Drive | 33131 | $442.33
- St. Louis – 800 Claughton Island Drive | 33131 | $451.18
- Three Tequesta Point – 848 Brickell Key Drive | 33131 | $480.92
- Two Tequesta Point – 808 Brickell Key Drive | 33131 | $431.99
As mentioned in the introductory paragraph, I will now include additional statistics each month. The first number beside each building name represents the total numbers of active listings in that building. The number to the right of that, in parentheses, is the number of currently listed condos in each building expressed as a percentage of the total number of condos. The third number represents the number of pending sales in the building while the fourth is the number of closed sales within the past month. Pending sales is a leading indicator and should reveal, in future months, when the condo market begins to rebound.
- Brickell Key One – 20 (6.33%) | 4 | 1
- Brickell Key Two – 49 (12.41%) | 0 | 0
- Carbonell – 57 (20.07%) | 3 | 0
- Courts Brickell Key – 41 (12.85%) | 2 | 1
- Courvoisier Courts – 58 (21.32%) | 1 | 0
- Isola – 53 (17.67%) | 2 | 0
- One Tequesta Point – 23 (7.96%) | 2 | 1
- St. Louis – 9 (6.72%) | 0 | 1
- Three Tequesta Point – 20 (8.40%) | 1 | 0
- Two Tequesta Point – 25 (9.29%) | 2 | 0
As you can see from the statistics above, there were only four closed sales in Brickell Key within the past month. This reveals a slow market but the 17 pending sales indicate that the following months should prove to be more active if 70 percent of the pending sales actually close. This is assuming that the pending sales are scheduled to close within the next 60 days.
I’d love to hear some feedback regarding the latest statistics provided. I hope the additions shed new light into the Miami condo market. I’m particularly curious to see the number of pending sales in Brickell when I publish the Brickell Condo Index for September.


