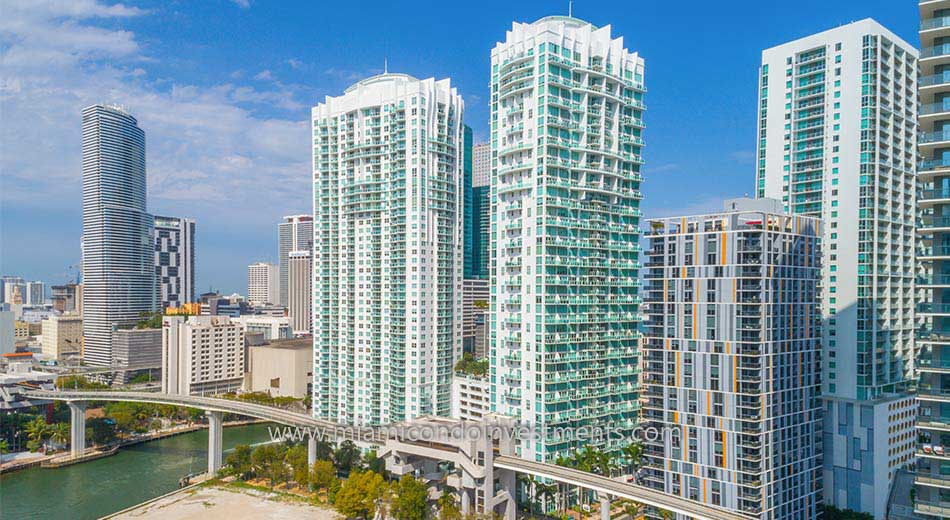
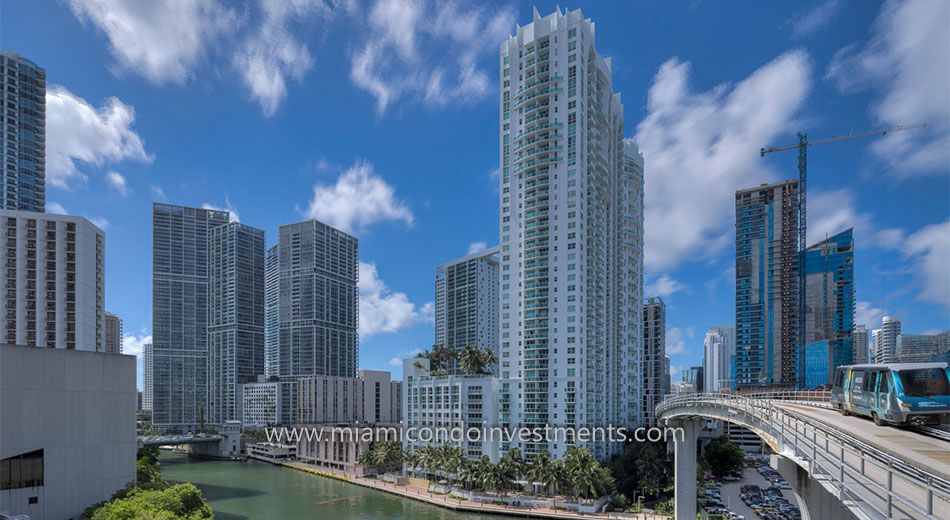
After a few weeks in the Miami Riverfront and Edgewater areas, we’re going to jump back to Brickell for this week’s Market Stat Monday and look into Brickell on the River’s North tower. For the Brickell newbies out there, Brickell on the River was built in 2006 and has 2 towers that share an amenity deck and parking garage, but aside from that are very much different.
The north tower was the first to be built. It has 42 stories and a contemporary feel. The lobby is marble with wooden accents and the condos are all flat, with sizes varying from 1 bedrooms up to 3 bedrooms. The condo association has recently completed a face-lift to the hallways and lobby. I have always viewed this tower as a great option for both end users and investors alike since it has such a great mix of qualities that are attractive to most anyone. Once the north tower was complete, work began on the south tower, that was completed in 2007. The south tower has 46 floors and features a more modern design with duplex lofts rather than the flat apartments with separated bedrooms.
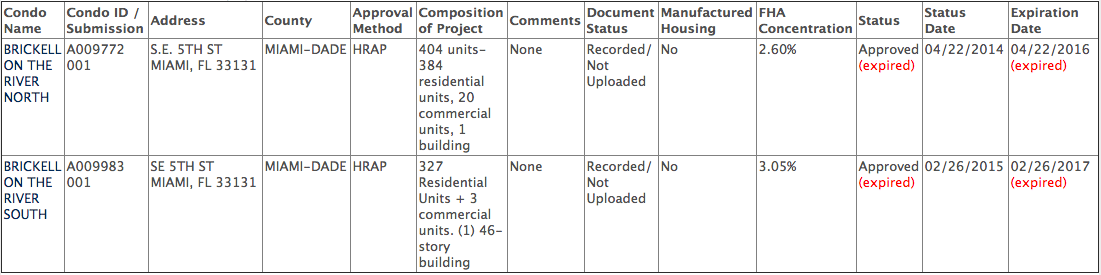
One of the big selling features of Brickell on the River lately has been the fact that it is the only building in Brickell that is approved for FHA financing. Sadly, I have to announce that this approval has expired, but conventional financing is still available.
Even without the FHA approval, the north tower hasn’t been performing to badly lately. There have been 5 closed sales this year with an average price per square foot of $350. One thing that is interesting is the fact that of the 5 recent closings, two have been REO deals (foreclosures). Unit 2503 is a 1 bedroom that closed for a paltry $239,925, which worked out to $309/square foot. Before you go crazy about this ridiculously low-priced sale, you also have to acknowledge that this particular sale seems to have squatters, which are the buyer’s responsibility. The listing noted that the property was occupied and no interior inspections were available… meaning the property cannot be seen in person. That’s pretty hardcore.
In a less dramatic deal, unit 4019 is a two bedroom that closed for $370,000. This one was a Homepath deal, a foreclosure that was taken back by Fannie Mae. I saw this property in person and it was in great shape. It needed only some drapes and was ready to move-in. Someone got a very good deal. That unit would rent for $2,450/month by my estimates.
As for non-distressed sales, we saw a 1 bedroom trade for $330,000 ($365/square foot), and then a two bedroom corner unit that sold for $407,500 ($367/ft). On the 39th floor, a 2 bedroom with 2 parking spaces closed for $415,000.
Overall, the sellers who closed their units accepted 93% of their desired price, staying in line with the rates of negotiation we are seeing in other buildings.
There are currently 3 contracts pending in the building. One is a short sale that was listed for $360,000 for a two bedroom. This one has to be considered an outlier because who knows whether it will get approved and the buyer has to pay the seller’s closing and legal costs. There’s no telling how much that will amount to!
Units 1603 and 2403 are both one bedroom plans and are asking $299,900 and $299,000 respectively. We have also just listed apartment 803 for $283,000, so expect to see an offer come through very quickly!
Aside from apartment 803, there are 33 total active sales in the building. While that does work out to 33 months of inventory at the rate that closings are coming, it is also only 9% of the total units. That is a far better situation than some of the other buildings in the area.
One bedrooms start at $255,000 up to $325,000. Two bedrooms are between $384,000 to $485,000 aside from one two bedroom listing that is a short sale offered for $308,000. I can’t believe we’re talking about short sales again! Even with the short sales and foreclosures that are being marketed, since financing is still possible, I would still consider Brickell on the River North to be a relatively healthy building in this market.
On the rental side, we have seen 24 rented apartments in the last months with an average price of $2.33/square foot. One bedrooms range from $1,850-$2,100, two bedrooms from $2,300-$2,750 and 3 bedrooms around $3,400/month. The average marketing time is 46 days and owners are garnering 96% of their asking price. It is also important to make note that most of the rentals are transacting for the asking price, especially in the lower price points. Furnished rentals tend to be a bit more flexible since they are more challenging to fill, but the unfurnished units are not budging in price.
Current rental availability ranges from $2,150/month-$2,375/month for one bedrooms, $2,500/month-$2,850/month for two bedrooms and $3,200/month-$3,500/month for three bedrooms.
HUD Promises Easier FHA Financing for Condos
For years we have seen hopeful condo buyers, armed with pre-approval letters become frustrated with the financing process and give up or learn that their pre-approval letters are only valid in certain condo developments. The reality is that in order to purchase a condo, two approvals must happen.
First, the buyer must prove financially able to commit to the mortgage payment by submitting their credit and income details to the bank for review. Secondly, the condo development they wish to purchase in must also be approved by the financial institution.
FHA loans are very popular among buyers because of their less stringent qualification guidelines and because of the lower down payment requirements. In order for a building to become FHA approved, they must submit an application to the US Department of Housing and Urban Development (HUD), pay an application fee, and wait for 60-90 days for an answer. The application is long and cumbersome, the fee is high, and few buildings are approved. This has led to a diminishing number of buildings who are even willing to try for the approval.
For example, the current 95 page application has been submitted by 48 buildings in Miami Beach & Downtown Miami. Of those 48, only 2 buildings meet all of the criteria and have been awarded FHA approval.
If you are a buyer today with an FHA pre-approval, you would be able to purchase a condo in Brickell on the River North or Brickell on the River South. This remains to be the case no matter what your credit score is, how secure and high paying your job may be or how responsible you are. Those would be the two buildings you could choose from. You would be able to use the pre-approval letter to purchase a house, but those are the only two condo buildings that allow FHA mortgages currently.
At this year’s NAR conference in San Diego, an announcement was made by the Federal Housing Administration that changes are underway to the approval guidelines, making FHA mortgage more accessible to condo buyers going forward. Among these changes are restrictions on owner occupancy versus investor owners, commercial space percentage, FHA concentration and spot approvals. We commend NAR and HUD for their efforts in making home ownership more accessible and look forward to seeing the specifics of the changes.
In the meantime, if you are a condo buyer who prefers a lower down payment, there are loan programs in some buildings that allow for less than the standard 20% down payment and are happy to answer questions you may have about financing in condos.
The Brickell Rental Market Under a Microscope
The rental market is a very interesting segment of the real estate market, not only for potential tenants on the prowl for a new pad but also current landlords and would-be investors trying to assess the demand for rentals across various neighborhoods and, more specifically, across various condo developments. Only a few years ago, the supply of rentals in Miami far outpaced demand. As a result, rental prices plunged and renters ruled the day. Fast forward to the present and an entirely different rental market is upon us in Miami. Nowadays, rental inventory is being absorbed quickly and overall rental prices are on the rise. For those living in Miami, I’m sure this a message that you have not only read in the local paper but have also heard directly from friends and family who have experienced it firsthand.
Obviously, not all neighborhoods and condo developments are created equal. Factors such as price, location, views, quality and recommendations from peers help determine rental demand. As a result, one would assume that demand can vary greatly from building to building and even neighborhood to neighborhood. Which condo developments are the leaders when it comes to rental demand and which are the laggards? More importantly, which buildings should we expect to see prices climb in the near future?
In this first segment, I decided to analyze the Brickell rental market to answer the above questions. Below, you will find a spreadsheet containing rental data for various condo developments in Brickell. Click the link below the spreadsheet to view it in its entirety.
Brickell Rental Market as of March 01, 2011
Columns C through G show the number of available rentals pertaining to each condo development grouped by number of bedrooms. Column I displays the total number of rentals available in each condo development while column J shows the total number of units within that development. I debated whether or not to include column K, the number of available rentals over the total number of units in the development expressed as a percentage, because the figure can be deceiving in buildings where developer inventory remains which has neither been sold nor rented. This is the case in buildings such as Icon Brickell and Infinity at Brickell. Regardless, I decided to include the figure because it can provide additional insight in buildings where this is not the case.
The main objective in creating this spreadsheet was to calculate months of inventory for each condo development. This can be seen in column M. Months of inventory was calculated by dividing total units available for rent by the monthly average number of units rented over a 3-month period from November 16, 2010 to February 15, 2011. You may be wondering why I did not include closed rental data from the past two weeks in determining the monthly average. I have noticed that it can take real estate agents days, and even weeks, to change the status of a rental in the MLS from pending to rented. As a result, I felt that the average would be skewed to the downside and not be an accurate representation of the Brickell rental market. Furthermore, if I had to venture a guess, I would also say that it is highly likely that around 10 percent of the total number of units available for rent are in fact no longer available. In this case, the listing agent has yet to change the status from available to pending.
Regardless, a lot can be ascertained from the spreadsheet above. In my opinion, any building with 1.5 months of inventory or less has a solid rental market. 1060 Brickell, The Plaza on Brickell and Vue at Brickell are standouts with absorption rates hovering around one month. I expect rentals prices in these developments to continue to rise in the near future. For those in the market to lease a condo in one of these developments, I advise that you act quickly and put your best foot forward when making an offer.
According to the spreadsheet, there is currently 2.29 months of rental inventory available in Brickell. Some may expect this number to increase as more units from Icon Brickell and Infinity at Brickell hit the rental market. Of course, this will all depend on how quickly the units become available and at what pace demand absorbs them. Only time will tell, but I plan to watch Brickell rental market closely and post updates on a monthly basis.
I would love to hear your thoughts and comments.
Two REOs Hit the Market at Brickell on the River North Tower
Since yesterday, two REO condos at Brickell on the River North Tower have come onto the market. The first is a 3 bedroom/2.5 bath condo on the 35th floor with 1,513 square feet of interior. The asking price is $ 314,000, or $208 per square foot. The second condo, also located on the 35th floor, is a 2 bedroom/2 bath condo with 1,157 square feet of interior. The asking price is $222,750, or $193 per square foot. Both condos face west, come with one parking space and have tiled flooring throughout the living areas and marble in the bathrooms. Both condos are well priced and should receive offers from multiple parties. Contact us at 305-428-3860 if you have an interest in either or both condos at Brickell on the River North Tower.
Top 5 Distressed Condo Sales Closed in October 2010
Below, you will find what I believe to be the five best condo deals of the 71 distressed condo sales that closed in October 2010 in the MLS located in Brickell, Brickell Key, Downtown Miami and the Arts District. This should give everyone a good idea of the kind of deals that can be obtained in the Miami condo market at this time. Of the 71 distressed condo sales that closed last month, 39 were REOs and 32 were short sales. I feel it’s important to note that 25 of the 39 REOs sold at or above asking price. Time and time again, we try to emphasize to clients that the majority of well priced REOs in condominium buildings of interest will receive multiple offers and sell at or above asking price. It may be difficult to believe but bidding for condo foreclosures in Miami is very competitive. For example, unit 1601 at Solaris at Brickell was a foreclosure that we discussed on one of our video shows in August. The condo was listed for $168,300. At that price, we felt that the condo was grossly under priced. Last month, the condo closed for $230,000, or about 37% above asking price. It’s important to recognize good value when it becomes available and to have the ability to act quickly. As a side note, in the example above, our recommendation at the time to potential buyers was to bid up to $200,000.
Solaris at Brickell #1204 – 2 bedroom/2 bath (1,145 square feet) – This unit sold for $165,100, or $144 per square foot, on October 21, 2010. REO
Brickell on the River North Tower #3417 – 2 bedroom/2 bath (1,157 square feet) – This unit sold for $215,000, or $186 per square foot, on October 1, 2010. Foreclosure
Blue Condominium #2004 – 2 bedroom/2.5 bath (1,158 square feet) – This unit sold for $180,000, or $155 per square foot, on October 8, 2010. Foreclosure
Neo Vertika #2519 – 2 bedroom/2 bath (1,113 square feet) – This unit sold for $159,000, or $143 per square foot, on October 4, 2010. Short Sale
Cite on the Bay #119 – 2 bedroom/1.5 bath (980 square feet) – This unit sold for $136,000 or $139 per square foot, on October 20, 2010. Short Sale
Brickell Condo Index – August 2010
The Brickell Condo Index is back! It has been a year and a half since I last published the Brickell Condo Index. Fortunately, eighteen months is a good reference point and definitely enough time where one would expect a lot to have changed with the condo market. For those of you who haven’t followed this blog that long, the Brickell Condo Index is an in-depth look at the various condo buildings in Brickell with various statistics included to illustrate the health or weakness of each building.
I hate to be the bearer of bad news but this will be the last Brickell Condo Index to appear on this blog. From here on out, the Brickell Condo Index, as well as other neighborhood indexes, will only be made available via email. Early next week, I will unveil a new version of the Miami Condo Investments website. The new website will be much easier to navigate, have a lot more content, load considerably faster and, most importantly, allow you to register to our Miami Condo Investments weekly newsletter. The weekly newsletter will contain the best condo deals of the week, relevant news stories and exclusive market data such as the neighborhood condo indexes. The neighborhood condo indexes will be emailed the Sunday following the 15th of each month, the day that I have chosen to collect and compile the data. Each neighborhood will be represented every six months as follows: Brickell this month, Brickell Key next month, Downtown Miami in October, the Edgewater in November, South Beach in December and the Miami River area in January. The cycle will then start all over so a neighborhood update is provided twice per year. In the meantime, if you’d like to be included on the newsletter list then simply send us an email at [email protected] and convey your interest to be placed on the list. The blog will not change and will continue to be updated but the market data reports will only be made available via our newsletter.
Before we get into this month’s numbers, let me discuss a few changes that I made to the Brickell Condo Index since the last update in February 2009. First, I excluded One Miami from the index. One Miami will be included in the Downtown Miami Condo Index in October. Second, Latitude on the River and Neo Vertika were also excluded. Both will appear in the Miami River Condo Index in January 2010. Third, I decided to include 1060 Brickell, 500 Brickell, Brickell on the River South and The Plaza on Brickell. Each has had enough closed resales to warrant their inclusion in the Brickell Condo Index. Fourth, I decided to bring back The Sail on Brickell. As of late, I’ve seen much more interest in the building due to its price point and it is much healthier than it was in October 2007 when I dropped it from the index. I guess you can say that it’s officially off the pink sheets. There are now a total of twenty buildings in the Brickell Condo Index whereas before there were eighteen. Last, but not least, I decided to round the price per square foot calculations. I think it makes everything easier to read and I honestly don’t think excluding the two decimal points makes the figures any less insightful.
As per the MLS, the average of the asking prices of the twenty condo buildings that now represent the Brickell Condo Index is $376 per square foot. The average asking price per square foot for each Brickell condo building individually can be found below:
1060 Brickell – 1050 & 1060 Brickell Ave – $375
500 Brickell – 500 Brickell Ave & 55 SE 6 St – $362
Atlantis on Brickell – 2025 Brickell Ave – $255
Brickell on the River North – 31 SE 5 St – $268
Brickell on the River South – 41 SE 5 St – $276
Bristol Tower – 2127 Brickell Ave – $471
Emerald at Brickell – 218 SE 14 St – $348
Four Seasons Residences – 1425 Brickell Ave – $954
Imperial at Brickell – 1627 Brickell Ave – $285
Jade Brickell – 1331 Brickell Bay Dr – $532
Santa Maria – 1643 Brickell Ave – $691
Skyline on Brickell – 2101 Brickell Ave – $352
Solaris at Brickell – 186 SE 12 Ter – $189
The Club at Brickell Bay – 1200 Brickell Bay Dr – $285
The Mark on Brickell – 1155 Brickell Bay Dr – $313
The Palace – 1541 Brickell Ave – $298
The Plaza on Brickell – 951 Brickell Ave & 950 Brickell Bay Dr – $394
The Sail on Brickell – 170 SE 14 St – $299
Villa Regina – 1581 Brickell Ave – $350
Vue at Brickell – 1250 S Miami Ave – $214
At the bottom of this post, I included a chart that shows how each of the above figures compares with those published in February 2009. Solaris at Brickell experienced the largest drop with average asking prices there falling slightly over 40 percent. Three of the buildings saw a slight increase in their average asking price per square foot within the past eighteen months. These were Bristol Tower, Four Seasons Residences and Villa Regina.
Below, you’ll find the average price per square foot for Brickell condos sold in the MLS within the six month period from February 1, 2010 to July 31, 2010. I decided to do it this way because I’ve noted that oftentimes it takes agents a few weeks to change the status of a listing in the MLS from pending to closed. The neighborhood as a whole sold at an average price per square foot of $285 during that time period.
The biggest surprise in the figures above when compared to those in February 2009 is Jade Brickell. The average price per square foot for closed sales during the previous six months increased a little over 14 percent when compared to the figures published eighteen months ago. Other buildings that experienced an increase are Skyline on Brickell, The Mark on Brickell, Villa Regina and Vue at Brickell. With the exception of Villa Regina, these buildings were some of the hardest hit in Brickell when the market collapsed mainly due to the large amount of mortgage fraud that took place in these buildings. The Club at Brickell Bay and Solaris at Brickell are two other buildings in Brickell that were heavily victimized by mortgage fraud. The Club at Brickell Bay saw about a 1 percent decrease in average closed sales prices while prices at Solaris at Brickell fell slightly over 9 percent. This actually makes sense since the fallout at Solaris at Brickell didn’t take place until about a year after the others. Also worth mentioning, prices at Santa Maria fell a little over 4 percent within the past eighteen months but the numbers were a bit skewed due to Penthouse 4901 recently selling for $1,100 per square foot. The average for the past six months would have been much lower had it not been for that sale.
Below you will find some additional statistics. Click on the image to enlarge it.
The first column to the right of each condo development name is the difference in the average sales price and list price for this month, expressed as a percentage. A high percentage indicates that there is a large discrepancy between the average asking price for condos currently on the market and what has actually sold within the past six months. In other words, many of the sellers in these buildings are delusional and are in need of a reality check. For example, 1060 Brickell has a very large discrepancy because there are quite a few units asking over $400 per square foot and even some asking over $560 per square foot while closed sales have averaged around $208 per square foot within the past six months.
The second column shows the number of active listings currently in the MLS for each condo development. The third column shows the percentage that these listings represent over the total number of condo units in each development. The cells highlighted in green reveal those condo developments that have active listings that that represent less than 10 percent of the overall units in the building. This is typically one indication of a sound condo building. When I first started doing the Brickell Condo Index in 2007 many of the cells in this column were highlighted in red, indicating that active listings represented over 20 percent of the building. This was always a good indication that prices would fall further in these buildings. For example, in February 2009, active listings at Solaris at Brickell represented slightly over 20 percent of the building. That was the largest percentage of listings at that time and it is not a coincidence that eighteen months later prices fell the most at Solaris at Brickell of all the buildings represented in the Brickell Condo Index.
The fourth column reveals the number of condos currently pending sale in each building. The Club at Brickell Bay has a whopping 42 pending sales at this time and there are a total of 155 pending sales in all of the buildings combined. In February 2009, there were only 81 pending sales although a total of twenty buildings are now present in the Brickell Condo Index rather than eighteen. The fifth column displays the number of closed sales from February 1, 2010 to July 31, 2010. Once again, The Club at Brickell Bay leads the way with a total of 38 closed sales in that time period. It’s interesting to note that there were 20 more closed sales in the six months prior to February 2009 when compared to the current closing numbers even though the index now has two additional buildings.
The sixth column shows the difference in the average list prices from this month’s and February 2009’s, expressed as a percentage. Those highlighted in red reveal those condo developments which had a drop in their average list price while those highlighted in green show those that experienced an increase.
The seventh column reveals the difference in average sales prices from this month’s and February 2009’s, expressed a percentage. Once again, those highlighted in green represent an increase while those highlighted in red represent a decrease.
Well, that’s all for today. Have fun with the numbers. Time for me to get back to work on the new website.
Shrinking Rental Inventory in Brickell and Downtown
In this episode, we discuss the shrinking rental inventory of condos in Brickell and Downtown Miami. In recent months, it has become increasingly more difficult to find a rental in these neighborhoods than it has since the peak of the market. For example, at this time The Plaza on Brickell, which has 1,000 total units, only has two unfurnished one bedrooms available while 1060 Brickell has zero. We highlight eight other well known condo buildings in these areas and provide an overview of the rental availability within them.
Price Increases Seen in the Sub-$250K Market
This video introduces a 1 bedroom/1 bath foreclosure condo at Brickell on the River North which came onto the market yesterday. It’s located on the 24th floor and faces west with a direct view of the Miami River. The asking price is $128,700, or $170 per square foot.
The video also explains why we’ve been seeing prices rebound in the sub-$250K segment of the market. Demand has increased due to the availability of financing in 2010 which had been pretty much nonexistent throughout 2009. Each month we continue to see more and more buildings become Fannie Mae approved throughout Miami. The common element in most of these newly approved buildings is that condos in the sub-$250K market are well represented. Furthermore, supply has decreased as evidenced by recent market reports showing large percentage increases in year-over-year closed sales as well as pending sales. Arguments which point to remaining and future developer inventory hold very little water in this segment of the market. Buildings such as 900 Biscayne Bay, Paramount Bay, Mint, Infinity at Brickell, Marquis and Icon Brickell have very little, if any, inventory in that price range.
1 Bedroom Foreclosure at Brickell on the River North – $138,000
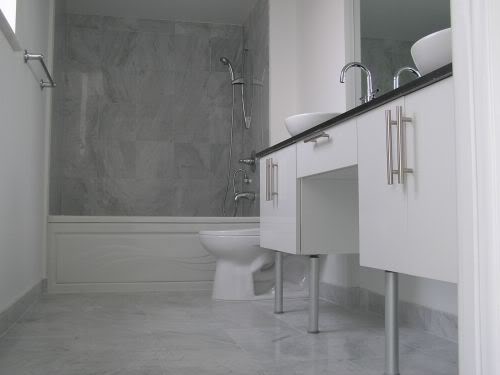
A 1 bedroom/1 bath condo foreclosure at Brickell on the River North became available yesterday for $138,000. The unit has 757 square feet of interior space, a balcony off the living room, a Jacuzzi tub in the bathroom, carpeting in the living room and bedroom, ceramic tile in the kitchen and marble flooring in the bathroom. Earlier this afternoon, I stopped by the condo to take a look at it for myself. The unit appeared to be in great condition with all appliances, including the washer/dryer, still present in the unit. The 24th floor condo faces west with a direct view of the Miami River and the sunset in the evening.
This is definitely one of the best priced 1 bedroom condo foreclosures that I’ve seen come onto the market within the past three months. $182 per square foot is a good deal for a condo in a quality building like Brickell on the River North. Amenities in the building include 24-hour concierge and valet parking, fitness center, yoga room, sauna, steam room, conference room, club room, swimming pool and hot tub. The previous owner paid $305,000 in February 2006 for this 1 bedroom condo. This unit will likely have multiple offers and be under contract by next Friday.
Call me at 305-428-3860 if you would like to view the condo in person.