South of Fifth – Miami Beach’s Ultra-Luxury Neighborhood
The video above is meant for the non-local buyer who may not be familiar with the various neighborhoods throughout South Florida. South of Fifth, also known as SoFi, is a neighborhood that encompasses the five southern most blocks of South Beach (and therefore Miami Beach). Once regarded as one of the most dangerous neighborhoods in South Florida, South of Fifth is now considered to be one of the safest and most luxurious for condo living. The revitalization of the area within the past two decades has been remarkable, attributed mainly to visionary Thomas Kramer.
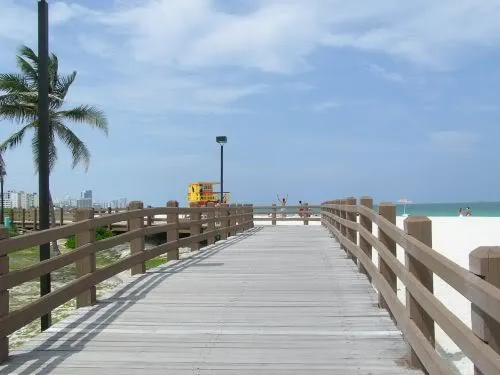
One of the main attractions for South of Fifth condos is South Pointe Park which reopened in March 2009 after undergoing a $22M renovation. The neighborhood also has world-renowned restaurants Joe’s Stone Crab and Prime 112 as well as local favorites Devito South Beach, Smith & Wollensky and China Grill. South of Fifth is reputed for being a clean, quiet, exclusive neighborhood away from the congestion of South Beach but within walking distance to all else that South Beach has to offer. The beach at the southernmost point of Miami Beach, in my opinion, is also one of the most beautiful beaches in South Florida.
Below, you will find a list of the South of Fifth condo buildings that were featured in the video. Click on each link to view the condos currently available for sale.
South Beach & Miami Beach Closed Condo Sales – November 2009
South Beach Closed Condo Sales – November 2009 – There were 78 closed condo sales in South Beach last month. The average sales price of these condos was $342 per square foot.
Miami Beach Closed Condo Sales – November 2009 – 59 condos in Miami Beach closed in November. One of the sales did not include the final sales figure. The average price per square foot of the other 58 closed sales was $251.
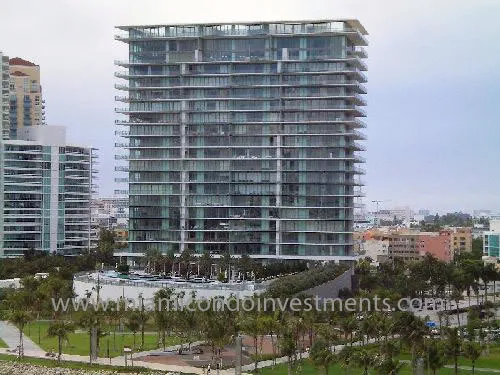
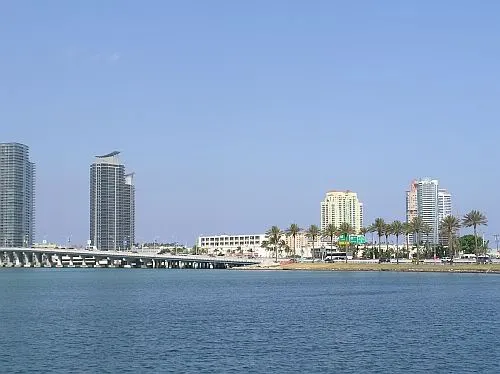
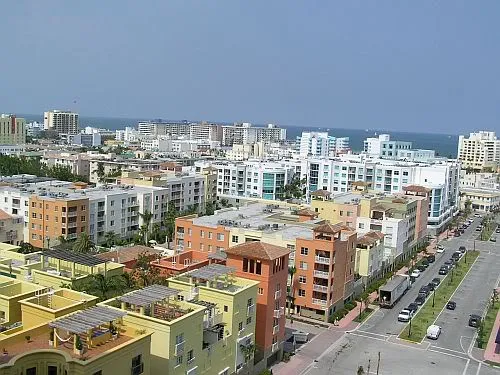
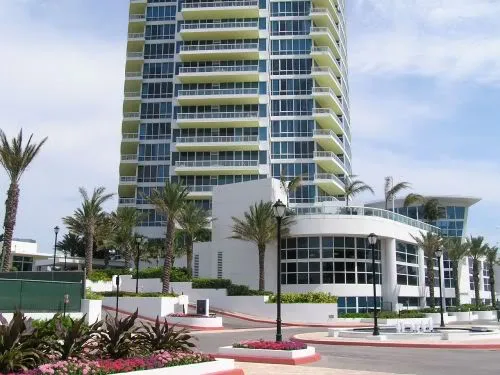
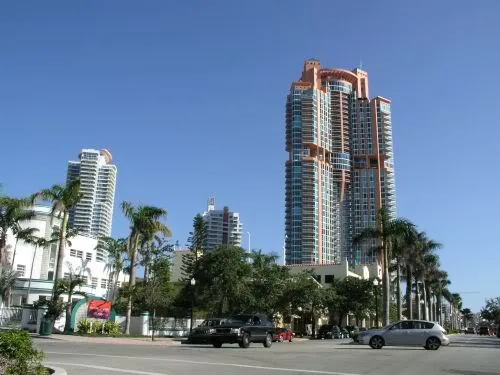
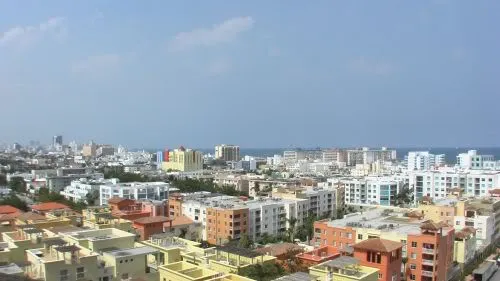
South of Fifth Luxury Condo Building Pictures
Earlier this week, I arrived back in Miami from a 5-day cruise and was able to take some nice pictures of several of the luxury condo buildings in South of Fifth as the cruise ship departed. Just wanted to share them with everyone.
The following data was collected on Sunday, November 11, 2007. The average price per square foot of condos currently listed in the following 19 developments in South Beach dropped from last month’s average. In fact, it even dipped below September’s average. It went from $889.83 per square foot, in October, to $886.71, for this month. The September average price per square foot was $887.60. The weight-adjusted average also slid slightly to $773.67 from last month’s weighted average of $773.73. Below, you will find the average price per square foot of condos listed in the following 19 condo developments in South Beach:
The average price per square foot of condos sold over the previous six months has gone down from $787.01 per square foot to $775.74. Once again, Meridian Lofts didn’t have any closed sales within the last six months which is why you will find the “N/A” below. If Meridian Lofts were included in the average this month, at its previous average price per square foot of $434.78 in September, then the average price of condos sold in this index would have dropped from $768.47, last month, to $757.80, this month. Below, you will find the average price per square foot of condos that have sold within the last six months in the following 19 developments in South Beach:
Murano at Portofino – 1000 S Pointe Dr | 33139 | $1,040.34
Murano Grande – 400 Alton Rd | 33139 | $721.85
Portofino Tower – 300 S Pointe Dr | 33139 | $1,014.26
Setai South Beach – 101 20 St | 33139 | $1,494.92
Waverly at South Beach – 1330 West Ave | 33139 | $475.99
Yacht Club at Portofino – 90 Alton Rd | 33139 | $611.65
As with the Brickell and Brickell Key condo indices, I have provided the graph below to make it easier for everyone to make sense of the statistics above. If you can’t read the numbers below then you need to upgrade your glasses to a set of binoculars. Otherwise, right-click and save the graph below and blow it up to as big as you’d like.
The first column, to the right of each condo development’s name, is the difference in the average sales and list prices for the statistics at the top, expressed as a percentage. With the exception of Portofino Tower and The Floridian, the average sales prices are well below the average list prices in these 19 developments. Portofino Tower had a condo sell for $1,505 per square foot on June 29, 2007. Once that transaction falls off the average in January, we shall see Portofino Tower begin to show its true colors. Average list and sales prices at The Floridian are merging together because the high number of short-sales that are available at The Floridian. Once a few of these actually close, the average sales price will fall well below the average list price.
The second column is the number of active listings in each development currently in the MLS. The third column shows the percentage that these listings represent over the total number of condo units in each development. The cells highlighted in green reveal those developments that have active listings that represent less than 10 percent of the the overall units in the building. I find this to be a very healthy number. 1500 Ocean Drive, Courts at South Beach, The Decoplage, Grand Venetian, Il Villaggio and Murano at Portofino fall into this territory.
The 10-15 percent range is considered average while the 15-20 percent range is beginning to approach dangerous levels. The ones highlighted in red reveal those developments that have active listings that represent over 20 percent of the overall units in the building. This indicates that the danger zone has been breached and caution should be heeded. Of the 19 condo developments in the South Beach Condo Index, Bentley Bay, Murano Grande and Setai South Beach fall into this red zone area.
The fourth column shows the number of pending sales while the fifth column displays the number of closed sales since October’s South Beach Condo Index. As you can see, there are 31 pending sales in South Beach. There’s been a total of 13 closed sales within the last month, which matches last month’s figure. Icon South Beach, with 3 closed sales, is beginning to show some spirit. There was a recent article in the papers that stated that former NFL quarterback Michael Vick, recently acquired a pricey condo at Icon South Beach. I’m pretty sure that the neighbors won’t be pleased by all of the dog barking until he begins to serve his time. Woof, woof!!!
The sixth column shows you the difference in the average list prices from this and last month’s, expressed a percentage. Those highlighted in red reveal those condo buildings which had a drop in their average list price, those highlighted in green show those that had an increase while those highlighted in yellow reveal a stalemate from last month’s figures. As you can see, Meridian Lofts had an 11.44 percent drop. That’s probably because it hasn’t had any closed sales within the last six months. Time to drop prices!
The seventh column reveals the difference in average sales prices from this and last month’s, expressed as a percentage. The color scheme remains the same. Sales prices at Bentley Bay spiked up 7.33 percent because a transaction that took place on May 8, 2007 at $476 per square foot fell off the average. The Setai South Beach took a beating this month, with a 9.71 percent drop from last month’s average. This is mainly attributed to a Penthouse unit that sold for $1,851 per square foot falling off the average this past month.
Pending sales have increased to 31 from last month’s figure of 25. It looks like the off-peak months have begun to knock boots with the on-peak months. Just wait until January. I promise that you’ll begin to see more pending and closed sales during those months.
South Beach Condo Index – October 2007
The data for the October South Beach Condo Index was collected last Thursday. I didn’t have time to actually post the statistics until now because it is quite time consuming and I kept procrastinating.
Actually, I had time, but I instead decided to enjoy my weekend by consuming much of what Miami and South Beach has to offer and sleeping in late each day. It was a much needed vacation time, especially after experiencing the frustration of my site being down for three days. The joy of not having a boss to which to answer!
The average price per square foot of condos currently listed in the following 19 condo developments in South Beach actually went up. It went from $887.60 per square foot, in September, to $889.83, for this month. The weighted-average, however, slid from $774.23 per square foot to $773.73.
The average price per square foot of condos sold over the previous six months has gone up from $783.25 per square foot to $787.01, but for a good reason. Meridian Lofts didn’t have any closed sales within the last six months which is why you will find the “N/A” below. Meridian Lofts is a sub-$500 per square foot condo building, so by excluding it from the average it actually made the overall average rise. Most of the other condo buildings included in the South Beach Condo Index are priced much higher than $500 per square foot. If Meridian Lofts were included in the average this month, at its previous average price per square foot, then the average price of condos sold in this index would have dropped from $783.25, last month, to $768.47, this month. That’s the real number to watch.
Murano at Portofino – 1000 S Pointe Dr | 33139 | $1,040.34
Murano Grande – 400 Alton Rd | 33139 | $752.03
Portofino Tower – 300 S Pointe Dr | 33139 | $998.35
Setai South Beach – 101 20 St | 33139 | $1,655.73
Waverly at South Beach – 1330 West Ave | 33139 | $478.47
Yacht Club at Portofino – 90 Alton Rd | 33139 | $640.19
The first number below directly to the right of each development name represents the total number of active listings. The second number, in parentheses, is the number of currently listed condos expressed as a percentage of the total number of condos in the development. The third number represents the number of pending sales while the fourth is the number of closed sales within the past month.
1500 Ocean Drive – 9 (8.04%) |0 | 0
Bentley Bay – 49 (28.82%) | 1 | 0
Bentley Beach – 14 (12.28%) | 0 | 1
Continuum South Tower – 44 (13.84%) | 1 | 3
Cosmopolitan – 30 (13.45%) | 0 | 0
Courts at South Beach – 5 (5.00%) | 0 | 0
The Decoplage – 62 (9.92%) | 2 | 1
The Floridian – 57 (17.07%) | 0 | 1
Grand Venetian – 17 (12.69%) | 0 | 0
Icon South Beach – 45 (15.57%) | 4 | 1
Il Villaggio – 6 (4.72%) | 0 | 1
Meridian Lofts – 17 (15.32%) | 1 | 0
Mirador 1000 & 1200 – 100 (10.80%) | 9 | 5
Murano at Portofino – 17 (8.99%) | 1 | 0
Murano Grande – 53 (19.63%) | 0 | 0
Portofino Tower – 38 (18.45%) | 1 | 1
Setai South Beach – 33 (20.25%) | 1 | 0
Waverly at South Beach – 47 (11.78%) | 3 | 1
Yacht Club at Portofino – 43 (11.91%) | 1 | 1
There were a total of 13 closed sales in the 19 condo developments represented in the South Beach Condo
Index this month. Five occurred in Mirador while 3 others occurred in Continuum. The 13 closings this month are two less than last month’s.
Overall pending sales have dropped from 35, last month, to 25, this month. That’s a 28% drop which is pretty considerable, in my opinion. Hopefully, the tides will turn after Thanksgiving, which is around the time that business picks up.
South Beach Condo Index – September 2007
As with the Brickell Key Condo Index in August, I have included some key statistics about each of the 19 developments that comprise the South Beach Condo Index. The third set of statistics below will reveal the number of available listings in each development, the percentage that those listings represent of the total number of condos in the development, the number of pending sales as well as the number of closed sales within the past month.
The average price per square foot of condos currently listed in the following 19 developments in the South Beach Condo Index has once again dropped. The August South Beach Condo Index revealed that the average price per square foot of available condos was $892.32. This month, the figure dropped to an average price per square foot of $887.60. The weight-adjusted average has also dropped from $777.86 in August to a weight-adjusted average for the month of September.
The average price per square foot of condos sold over the previous six months has gone up slightly despite very little activity. The figure has increased from $776.55 in August to $783.25 for the month of September. The weight-adjusted average is now $693.71 which is also higher than last month’s weight-adjusted average of $689.30. A significant jump in the average price per square foot of units sold at Murano at Portofino over the past six months has much to do with the increase. A closed sale seven months ago that held its average down has fallen off, thus bringing its average higher.
Murano at Portofino – 1000 S Pointe Dr | 33139 | $1,040.34
Murano Grande – 400 Alton Rd | 33139 | $761.17
Portofino Tower – 300 S Pointe Dr | 33139 | $938.87
Setai South Beach – 101 20 St | 33139 | $1,721.27
Waverly at South Beach – 1330 West Ave | 33139 | $473.83
Yacht Club at Portofino – 90 Alton Rd | 33139 | $650.36
Below you will find the new statistics that I have included in this month’s South Beach Condo Index. The first number directly to the right of each development name represents the total number of active listings. The second number, in parentheses, is the number of currently listed condos expressed as a percentage of the total number of condos in the development. The third number represents the number of pending sales while the fourth is the number of closed sales within the past month.
1500 Ocean Drive – 5 (4.46%) |0 | 1
Bentley Bay – 47 (27.65%) | 2 | 1
Bentley Beach – 15 (13.16%) | 1 | 0
Continuum South Tower – 40 (12.58%) | 4 | 0
Cosmopolitan – 28 (12.56%) | 0 | 0
Courts at South Beach – 4 (4.00%) | 0 | 0
The Decoplage – 57 (9.12%) | 2 | 0
The Floridian – 54 (16.17%) | 1 | 3
Grand Venetian – 16 (11.94%) | 0 | 0
Icon – 44 (15.22%) | 4 | 1
Il Villagio – 6 (4.72%) | 1 | 0
Meridian Lofts – 16 (14.41%) | 1 | 0
Mirador 1000 & 1200 – 105 (11.34%) | 9 | 3
Murano at Portofino – 11 (5.82%) | 1 | 0
Murano Grande – 51 (18.89%) | 1 | 3
Portofino Tower – 35 (16.99%) | 1 | 0
Setai South Beach – 30 (18.40%) | 2 | 1
Waverly at South Beach – 41 (10.28%) | 3 | 2
Yacht Club at Portofino – 39 (10.80%) | 2 | 0
There were a total of 15 closed sales from August 12, 2007 to September 11, 2007. 11 of these transactions took place in four developments: The Floridian (3), Mirador 1000 & 1200 (3), Murano Grande (3) and Waverly at South Beach (3). Four others had one closed sale each while the rest had zero. Last month there were a total of 18 closed sales over the previous 30 days. I’ve calculated that there have been a total of 161 closed sales over the past six months in the above 19 developments. That tells me that the previous four months prior to last month had an average of 32 closings each. The recent closed sales figures reveal that there has been a huge drop-off in activity. It is difficult to say, however, how much of this is due to the market slowdown and how much is due to seasonality since the summer months are the slowest for the South Florida real estate market.
The good news is that there’s now a total of 35 pending sales in the above 19 developments. I’ve definitely seen an increase in activity within the past two of months. However, I, as well as many other Realtors that I’ve spoken with, have encountered problems with condos appraising for the full purchase price. A pending sale doesn’t hold as much relevance as it once did. I wonder what percentage of the 35 pending sales will actually close.
South Beach Condo Index – August 2007
I finished crunching the numbers for the second installment of the South Beach Condo Index. I discovered some very good news! List prices have come down and the average price per square foot of condo units sold in the last six months in the 19 condo buildings included in the index has gone up.
In July, we discovered that the average price per square foot for units listed in the 19 condo buildings was $913.19. This figure has dropped to $892.32 per square foot for the month of August. The weighted-adjusted average was $793.99 in July versus a weight-adjusted average of $777.86 this month.
The average price per square foot of condo units sold over the previous six months went from $772.36 in July to $776.55 in August. The weight-adjusted averages went from $686.73 in July to $689.30 in August. 8 of the 19 building had in an increase in their average price per square foot over the past month, 4 remained unchanged and 7 went down.
There were a total of 18 transactions that occurred in the following 19 buildings from July 12, 2007 to August 11, 2007. Even though the 18 transactions represent twice the number of transactions that occurred in a one-month period in Brickell, I think the overall number is pretty small. This was highly expected, however, given the current condition of the market and the fact that we’re in our off-season months. It’ll be nice to see the change in the number of transactions as we enter the winter months.
There were a total 5 closings at Waverly at South Beach; 2 closings at Icon and Mirador 1000 & 1200; and 1 closing at 1500 Ocean Drive, Continuum South Tower, The Cosmopolitan, The Decoplage, The Floridian, Il’ Villagio, Murano at Portofino, Murano Grande and Yacht Club at Portofino. The rest had zero transactions during the one-month period.
The average price per square foot of condos listed at the following 19 buildings in South Beach:
Murano at Portofino – 1000 S Pointe Dr | 33139 | $953.15
Murano Grande – 400 Alton Rd | 33139 | $777.42
Portofino Tower – 300 S Pointe Dr | 33139 | $919.28
Setai South Beach – 101 20 St | 33139 | $1,688.57
Waverly at South Beach – 1330 West Ave | 33139 | $470.84
Yacht Club at Portofino – 90 Alton Rd | 33139 | $663.66
The sold-to-listed ratio has become more favorable in South Beach as a result of list prices coming down and the average price per square foot of sales going up. The sold-to-listed ratio, expressed as a percentage, went from 18.20% in July to 15.29% in August. The weight-adjusted averages went from 14.47% to 12.12% respectively. It is good to see that list prices are falling more in line with where condos are actually selling.
The sold-to-listed ratio expressed as a percentage in the following 19 buildings in South Beach:
1500 Ocean Drive – 1500 Ocean Dr | 33139 | 22.20%
Bentley Bay – 520 & 540 West Ave | 33139 | 25.49%
Bentley Beach – 101 Ocean Dr | 33139 | (2.79%)
Continuum South Tower – 100 S Pointe Dr | 33139 | 11.46%
Cosmopolitan – 110 Washington Ave | 33139 | 10.88%
Courts at South Beach – 140 Jefferson Ave | 33139 | 17.96%
Decoplage – 100 Lincoln Rd | 33139 | 17.75%
Floridian – 650 West Ave | 33139 | 6.18%
Grand Venetian – 10 Venetian Wy | 33139 | 26.23%
Icon South Beach – 450 Alton Rd | 33139 | 20.74%
Il Villagio – 1455 Ocean Dr | 33139 | 28.91%
Meridian Lofts – 2001 Meridian Ave | 33139 | 32.07%
Murano at Portofino – 1000 S Pointe Dr | 33139 | 26.44%
Murano Grande – 400 Alton Rd | 33139 | 12.52%
Portofino Tower – 300 S Pointe Dr | 33139 | (3.22%)
Setai South Beach – 101 20 St | 33139 | 15.83%
Waverly at South Beach – 1330 West Ave | 33139 | 14.25%
Yacht Club at Portofino – 90 Alton Rd | 33139 | 8.11%
That wraps things up for the August 2007 South Beach Condo Index. Next week we’ll take our third look at condos in Brickell.
Miami Condo Index – South Beach – July 2007
I realize that South Beach is not located within the Miami city boundaries. South Beach resides in the city of Miami Beach, which in itself is a separate city from Miami. I felt compelled, however, to include a South Beach condo index due to much interest in condominiums located in South Beach, and because I conduct a significant portion of my business in South Beach. Besides…if I didn’t provide this information then who would?
It was much more difficult to create a South Beach condo index than it was for Brickell or Brickell Key. There are so many more buildings to consider in South Beach. I didn’t want to only include the luxury buildings residing in South Beach but also didn’t want to include each and every small development located in the 33139 zip code either. I wanted to create a South Beach condo index that encompassed all of South Beach. To a nonlocal person, I wanted to provide a transparent look into the South Beach real estate market. Like I said though, I didn’t want to include each and every small development throughout all of South Beach either. The overall average price per square foot in South Beach would be significantly less than the figures below if one were to include every condo building in South Beach.
I instead chose to include those developments that are the most well known to South Beach locals. I realize that I’ve omitted a few but after much consideration, I decided on the following 19 buildings found below. The condo units at Flamingo South Beach will be considered at a future date once the entire development has been converted into condominiums and more resales are available. Other new developments may also be considered once additional resale information can be obtained. That being said, the following have made the South Beach graduating class of July 2007. Alongside each development, you will find the average price per square foot of units currently available for sale on the MLS.
Overall, the numbers did not surprise me too much. The only one that shocked me was Meridian Lofts but there’s a unit listed there for $4,000,000, or $1,140.25 per square foot. That increased the overall average. To someone unfamiliar with the South Beach real estate market the numbers above might seem ridiculous, but to those familiar with the local market, these numbers shouldn’t come as a surprise. The average price per square foot for condos currently listed in South Beach using the 19 buildings above came out to $913.19. The weight-adjust average came out to $793.99. The weight-adjusted average is significantly less due to the fact that Mirador 1000 and Mirador 1200 represent almost 18 percent of the overall units used in the index. It also has the lowest average price per square foot of all the buildings included in the index which helped to provide a better representation of the overall South Beach condo market. Although the average price per square foot in South Beach was almost one and a half times that of Brickell, the numbers in the June 2007 Brickell index were much more shocking to me.
The numbers below will show the average price per square foot in these buildings based on closed sales of condos in each building over the last six months.
Murano at Portofino – 1000 S Pointe Dr | 33139 | $962.09
Murano Grande – 400 Alton Rd | 33139 | $771.10
Portofino Tower – 300 S Pointe Dr | 33139 | $919.28
Setai – 101 20 St | 33139 | $1,733.20
Waverly at South Beach – 1330 West Ave | 33139 | $474.57
Yacht Club at Portofino – 90 Alton Rd | 33139 | $665.19
Overall, the price per square foot of units sold in these buildings over the last six months was $772.36, or $686.73 when weight-adjusted. I was surprised to see that the average price per square foot for condos sold over the last six months at Grand Venetian was under $500. I would have expected this to be significantly higher. I also thought that 1500 Ocean Drive and Icon would have been higher as well. It is amazing to see The Setai at $1,733.20 per square foot but it wasn’t particularly surprising. The Setai is known to be the ultra-luxury building of South Beach. I think we’ll see the average price per square foot at The Floridian and The Cosmopolitan come down some as both buildings have a number of preforeclosures and foreclosures in them.
The figures below will show the sold-to-listed ratio as a percentage. For example, as you will see below, 1500 Ocean Drive had an average price per square foot of condo units sold that was 50.34% of the average price per square foot of condo units listed. You’ll notice that the figures for Bentley Beach and Portofino Tower are in parentheses. Both of these had a higher average price per square foot of units sold in the past six months than those that are currently listed.
1500 Ocean Drive – 1500 Ocean Dr | 33139 | 50.34%
Bentley Bay – 520 & 540 West Ave | 33139 | 25.57%
Bentley Beach – 101 Ocean Dr | 33139 | (9.56%)
Continuum South Tower – 100 S Pointe Dr | 33139 | 22.16%
Cosmopolitan – 110 Washington Ave | 33139 | 9.79%
Courts at South Beach – 140 Jefferson Ave | 33139 | 16.18%
Decoplage – 100 Lincoln Rd | 33139 | 20.82%
Floridian – 650 West Ave | 33139 | 9.13%
Grand Venetian – 10 Venetian Wy | 33139 | 26.36%
Icon – 450 Alton Rd | 33139 | 20.70%
Il Villagio – 1455 Ocean Dr | 33139 | 48.58%
Meridian Lofts – 2001 Meridian Ave | 33139 | 30.25%
Murano at Portofino – 1000 S Pointe Dr | 33139 | 26.92%
Murano Grande – 400 Alton Rd | 33139 | 12.55%
Portofino Tower – 300 S Pointe Dr | 33139 | (1.85%)
Setai – 101 20 St | 33139 | 13.08%
Waverly at South Beach – 1330 West Ave | 33139 | 12.23%
Yacht Club at Portofino – 90 Alton Rd | 33139 | 12.04%
A few of the figures are a bit misleading. 1500 Ocean Drive, Il Villagio and Continuum have active listings that are priced at over $15M. These listings skewed the overall average price per square foot for units listed in those buildings which in turn through off the sold-to-listed percentages.
That concludes the South Beach condo index for July 2007. Next week I’ll return with another look at the condos in Brickell. It’ll be interesting to see how things have changed in a month’s time.