New Report Shows Miami as the Most Competitive Rental Market in the United States
Renting is at its greatest level in fifty years, with almost 44 million American households renting. However, some renters found it difficult to find a new place to call home in 2022, particularly in the highly sought-after South Florida region, which has long been a popular relocation destination for individuals from all over the country.
Additionally, in the past two years, more people have relocated to the Sunshine State as a result of laxer rules and the growing use of remote work. As a result, migrants found themselves in a competitive market with local residents looking for units, making Miami-Dade the most popular rental market in the country.
RentCafe.com examined the 135 biggest U.S. markets examing five crucial metrics that include the number of days apartments were vacant, the percentage of occupied rentals, the number of prospective renters, the percentage of rental renewals, and the share of apartments completed for the year.
The largest metro areas in Florida opened new apartments this year more quickly than any other city in the nation. However, this was still insufficient to meet the rising demand in such a well-liked location.
Due to record-high occupancy and high lease renewal rates, Miami had the hottest rental market in the United States. Numerous Millennials and even members of Generation Z who wanted to work and live in the Sunshine State were drawn due to a number of factors, including the absence of a state income tax, the business-friendly environment, and the thriving tech scene.
Renters in Miami are in a very difficult situation because practically all units are occupied, especially since 75% of apartment residents choose to stay put this year. As a result, Miami’s rental apartments were full in 25 days on average, with a record-breaking 32 renters competing for each available property. Additionally, despite the metro area’s stunning 2.8% rise in apartment supply in the first half of the year (the highest growth rate among the top 20 cities in the ranking), the high demand for rentals is still far from being satisfied.
Notably, the city’s favorable business environment, which draws corporate relocations and expansions, maybe the cause of this demand. Orlando is also a member of the Florida High Tech Corridor, which attracts business people, students, and young professionals.
Florida welcomed the newest residents between 2020 and 2021, according to the US Census Bureau (220,890 people looking to escape high taxes and frigid winters in the North). Arizona (170,307) and Texas (170,307) were much behind it (93,026). And even while developers are hard at work constructing apartments all around Florida, the supply of recently created rentals is just insufficient to meet the soaring demand for housing.
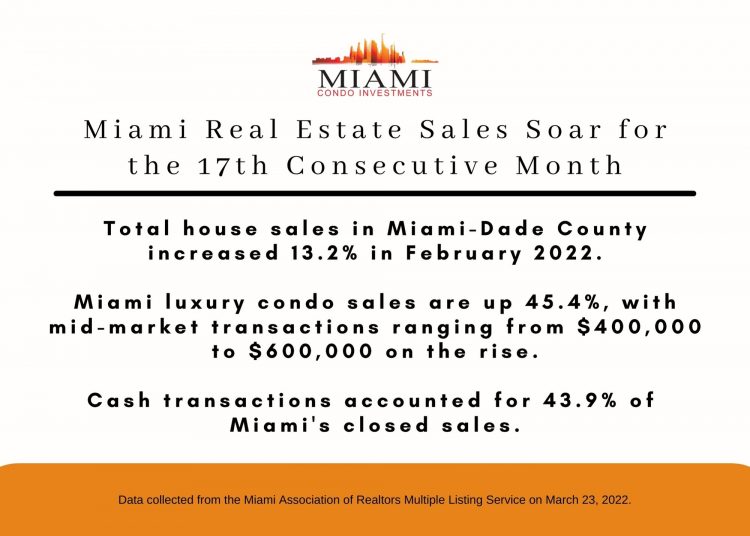
Miami Real Estate Sales Soar for the 17th Consecutive Month
According to the Multiple Listing Service (MLS), Miami-Dade County real estate achieved its best-ever February sales month as existing condo transactions climbed by double digits for the 17th consecutive month, following the historic January 2022 and 2021 year sales.
Total house sales in Miami-Dade County increased 13.2% in February 2022, from 2,485 to 2,814. Due to low availability, Miami single-family home transactions fell 7.9%, from 1,093 to 1,007 units. Existing condo sales surged jumping up 29.8%, from 1,392 to 1,807, marking the 17th consecutive month of double-digit year-over-year condo gains.
Home sales were much higher in February 2022 compared to February 2020 with total house sales up 51.1% compared to February 2020, from 1,862 to 2,814. Miami single-family house sales are up 13.9% while condo purchases are up 84.8% from January 2020.
Miami luxury condo sales are up 45.4%, with mid-market transactions ranging from $400,000 to $600,000 on the rise. In addition, Miami’s existing condo luxury ($1 million and more) sales increased 45.4% year on year to 237 deals.
Miami single-family houses valued between $400K and $600K climbed 24.7 percent year over year in February 2022, with 389 sales. Miami’s existing condo sales in the $400K-$600K price range surged 101.8 percent year over year to 345 deals in February 2022.
Single-family home inventory fell 29.3 percent year on year in February 2022, from 3,128 active listings the previous year to 2,212 this month. Condominium inventory fell 55.1 percent year on year to 5,272 from 11,735 during the same time in 2021.
Months’ supply of inventory for single-family homes has been decreasing since July 2019, suggesting high demand. Months of inventory for single-family homes fell 39.3 percent to 1.7 months, indicating a seller’s market. Existing condominium inventory fell 74.5 percent to 2.6 months, indicating a seller’s market. A balanced market between buyers and sellers provides six to nine months of supply.
The total number of active listings at the end of February 2022 fell 49.6 percent year on year, from 14,863 to 7,484.
In February 2022, Miami-Dade County single-family median prices grew 19.1 percent year over year, rising from $450,000 to $536,000. The median price of a single-family home in Miami has climbed for 123 straight months (10.25 years), the longest unbroken stretch on record.
Year over year, the median price of existing condos grew by 26.7 percent, from $300,000 to $380,000. The median price of a condo has risen in 125 of the previous 129 months.
Mortgage rates have typically been low, making house purchases more accessible. The average commitment rate for a 30-year, conventional, fixed-rate mortgage was 3.76 percent in February, up from 3.45 percent in January, according to Freddie Mac. The overall commitment rate for 2021 was 2.96 percent.
Miami real estate is attracting several bids, with buyers willing to pay above the asking price. In February 2022, the median percent of the initial list price obtained for single-family houses was 98.7 percent, up 1.5 percent from 97.2 percent the previous year. For existing condominiums, the median percent of the original list price obtained was 97.8 percent, up 3.7 percent from 94.3 percent last year.
Miami cash sales accounted for 75.6 percent of all sales in February 2022, which is much higher than the national average. In February 2022, cash transactions accounted for 43.9 percent of Miami closed sales, up from 35.8 percent in February 2021. According to the most recent NAR figures, cash accounts for around 25% of all house sales in the United States.
Cash sales made up 53% of all existing condo sales in Miami and 27.5 percent of single-family purchases.
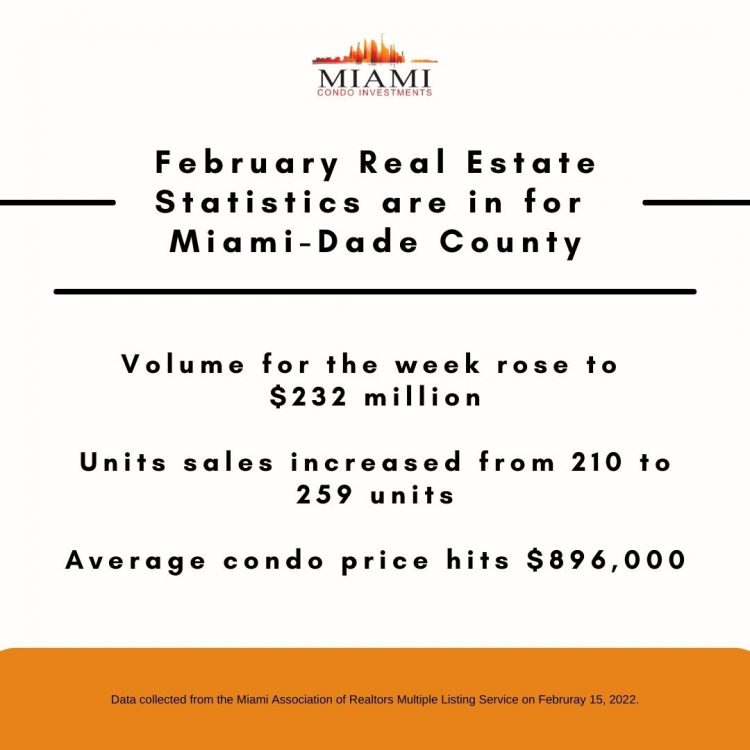
February Real Estate Stats Are in for Miami Dade County
In Miami-Dade County, condo sales and dollar volume increased in the first week of February. Volume for the week rose to $232 million which is up from $159.5 million from January 2022. Units sales increased from 210 to 259 units. The average condo price also rose from $759,000 to $896,000 in just one week.
The top sale for the first week of February was none other than a Palazzo Del Mare unit on Fisher Island. Sold at $21 million, which equals $2,874 per square foot. This property is considered the highest closing on Fisher Island this year.
The unit located at the Palazzo Del Mare unit 7153, features 5 bedrooms, 5.5 bathrooms, a terrace, a playroom, and a conference room spanning over 7,025 square feet. It also has a private 2-car garage on the parking level of the building and a private cabana near the pool.
Seller for the unit, Igor Olegovich Nesterenko, is a businessman in the meatpacking industry from Moscow. The buyer for this property is listed as Fana Fisher Palazzo 7153 LLC, which is managed by a trust in Bellevue, Washington.
For the second week in February, condo sales and volume fell slightly for Miami-Dade. Volume reached $148 million with sales totaling 206. The average condo price also fell to $719,000 from the $896,000 that was in the first week.
The top sale for this week included that of Oceana Bal Harbour. The unit located at 10201 Collins Avenue unit 2401 sold for $10.5 million equaling $2,630 per square foot. The sellers for this property include Tatiana Zorina and Kirill Stadnikov and the buyers are listed as Andrew and Jacqueline Africk.
This corner unit on the 24th floor of Oceana features gorgeous views of the ocean and the Miami skyline. The open-concept living areas flow effortlessly throughout with floor-to-ceiling glass windows. The 3 bedrooms showcase marble bathrooms and European cabinetry. This unit also features a private elevator foyer, powder room, 3 parking spaces, and storage space.
Miami-Dade County real estate has been steadily increasing month over month. In December 2021, we saw an 18.6% increase in condo sales with a 100% increase for luxury condo properties. We are excited to see what’s in store for Miami real estate.
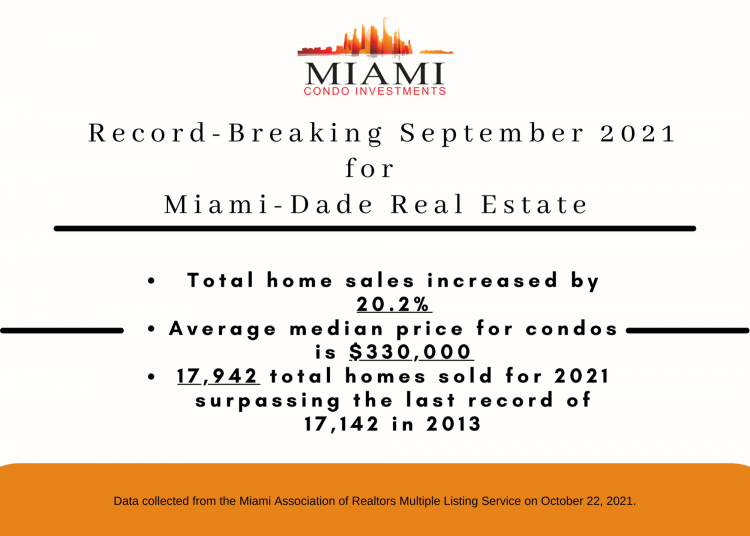
Miami Dade County Breaks More Records for Home Sales in September 2021
Home sale records continue to be crushed month over month for Miami-Dade, marking its best September sales in history and setting the bar for the most condos sold in a year’s time. The previous annual record was 17,142 in 2013, while the current condo sales have equaled 17,942 with only 3 months to go!
According to the Multiple Listing Service (MLS), homes sales for Miami Dade have risen 20.2% at 3,031 transactions. This is up from the 2,521 transactions that occurred in 2020. Simultaneously, we saw a dip in single-family home sales at 3.6% at 1,241. This may be due to the lack of single-family home inventory. Condo sales have exponentially increased at 45.2% at 1,790 for September.
According to the Miami Chairman of the Board Jennifer Wollmann, with international travel resuming in the United States in November, the expectation is that foreign home buying will grow in the coming months.
Miami is also on track to have its best year ever for single-family home sales. For September, single-family home sales have increased by 35.3% at 3,031 total transactions.
Miami condos sales have increased by 45.2% in September with major increases in pricing for properties over $250,000.
Luxury sales have also been in the records spotlight with a 31.4% increase with 209 sales for September. For properties $1 million and up, sales have increased 96.5% at 167 transactions. Currently, there is a 3.9 month of supply for luxury single-family homes and a 9.4 month supply for luxury condos.
Single-family home pricing falls between $400,000 to $600,000 increasing by 27.4% higher than September 2020. Condo sales also saw a heavy rise at 161.1% with sale prices between $400,000 to $600,000.
Inventory has decreased for both single-family homes as well as condominiums. Inventory single-family homes decreased by 42.1% since 2019. Condominiums have decreased from 68.8% since 2019 as well.
Single-family home median prices have increased by 11.5% from $435,000 to $485,000. Condo median prices have increased by 24.5% from $265,000 to $330,000
Miami-Dade cash sales are up by 62.2% and represent 37.3% of Miami’s closed sales in September. According to statistics from the National Association of Realtors, almost 23% of all United States home sales are cash. Cash sales count for 45.9% of Miami condo sales with 24.9% for single-family sales.
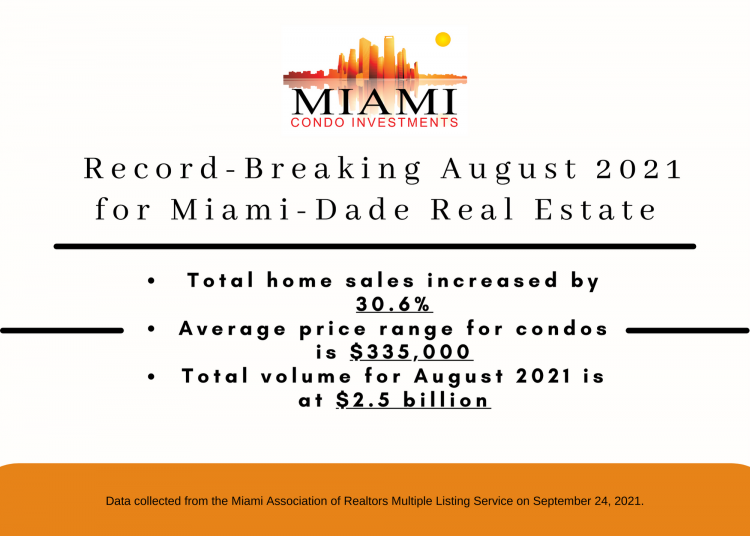
Miami Real Estate Breaks Another Record for August 2021
The Miami-Dade real estate market keeps smashing records over and over! For August 2021, a new record was set for the most homes sold in a quarter for Q2 in 2021. In April alone, we saw the best sales month in the history of Miami Dade county. Now, another record was set with the best August sales month in history!
There are multiple reasons for these records breaking, which include companies and executives moving their businesses to Florida in the masses, lower taxes than other states, record-low mortgage rates, and reduced covid restrictions.
Total homes sales surged 30.6% for August 2021 with an increase to 3,299 from 2,527 properties in 2020. There was a slight decrease in sales for single-family homes at 3.5% sliding from 1,357 to 1,309 from August of last year. However, we did see a 70.1% increase in condo sales from 1,170 to 1,990 compared to last year.
All price ranges have also increased for August 2021, especially in the $300,000 and higher range. The median sales price for single-family homes is up 20.3%, placing the average price at $500,500. Condo median prices are also up from the previous year from $265,000 to $335,000.
Insufficient inventory has also impacted sales. We have seen less inventory specifically for single-family homes which has decreased by 27.4% for August 2021 and 41.9% for condominiums.
Single-family luxury homes have also increased by 68.8% with 258 sales than 2020. Luxury condo sales increased by 217.1% with 222 sales.
Total volume for Miami-Dade real estate reached $2.5 billion in August 2021, with single-family homes increasing from 37.4% at $1.4 billion. Condo volume also increased from $490.8 million to $1.1 billion, at 129.2%.
Cash sales have also played a huge role in transactions. Buyers are paying cash at asking or over asking prices for listings. Cash sales represented 38.9% of all closed transactions for August. Cash sales accounted for 47.6% of condo sales and 25.8% of single-family sales.
Miami is on track to have its best year in sales for condos and single-family transactions ever. Within 8 months, total sales have already surpassed 2020’s numbers at 26,931 from 26,345 (2020). The highest year for sales in Miami was in 2013 at 30,041 total transactions.
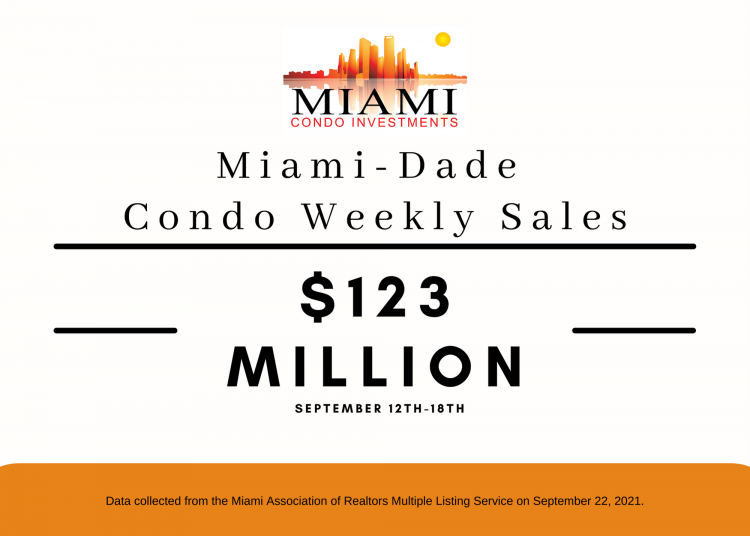
Total Number of Transactions Increased for this Week’s Miami Dade Condo Sales
Over the past few weeks, we have seen a steady incline in overall condo sales including volume and number of sales. This is of no surprise with the increase of companies, execs, and people taking up residency in Miami-Dade County.
Coming in at $123 million, this week’s condo sales volume increased from $85.3 million in the week prior. The total number of sales has risen to 198 for this week, up from 128.
The average price for condo sales reached $622,000 which has actually decreased from $666,000 then the week prior.
Leading this week’s condo sales in a luxury unit at Continuum South Beach that sold for $8 million or $2,708 per square foot. This luxury property located at 100 S Pointe Dr. Unit #3507 was sold to tech entrepreneur Hari Ravichandran, who is the CEO of Jump Ventures and Aura.
Last week’s highest condo sale was lead by Lucas Lechuga (Luxe Living Realty-Miami Condo Investments) with the sale of a Setai Miami Beach condo that sold for $12.3 million.
The sale coming in second includes a luxury unit at Palazzo Della Luna on Fisher Island. The property sold for $7.5 million or $2,045 per square foot and was on the market for 324 days. Luxe Living Realty’s Dora Puig represented the seller.
Market Stat Monday: Biscayne Beach
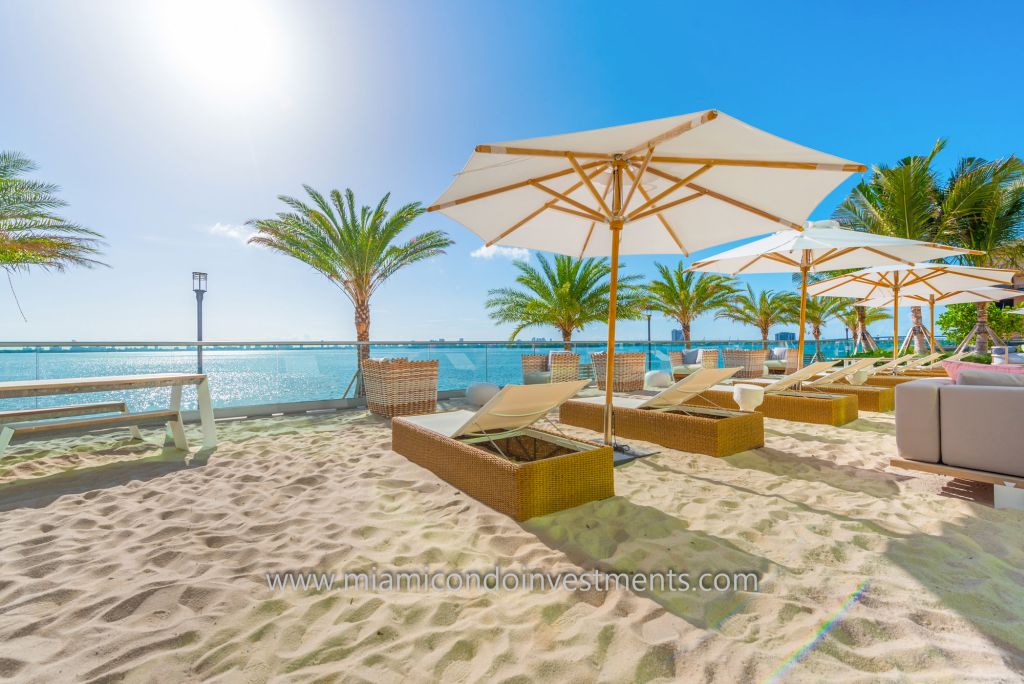
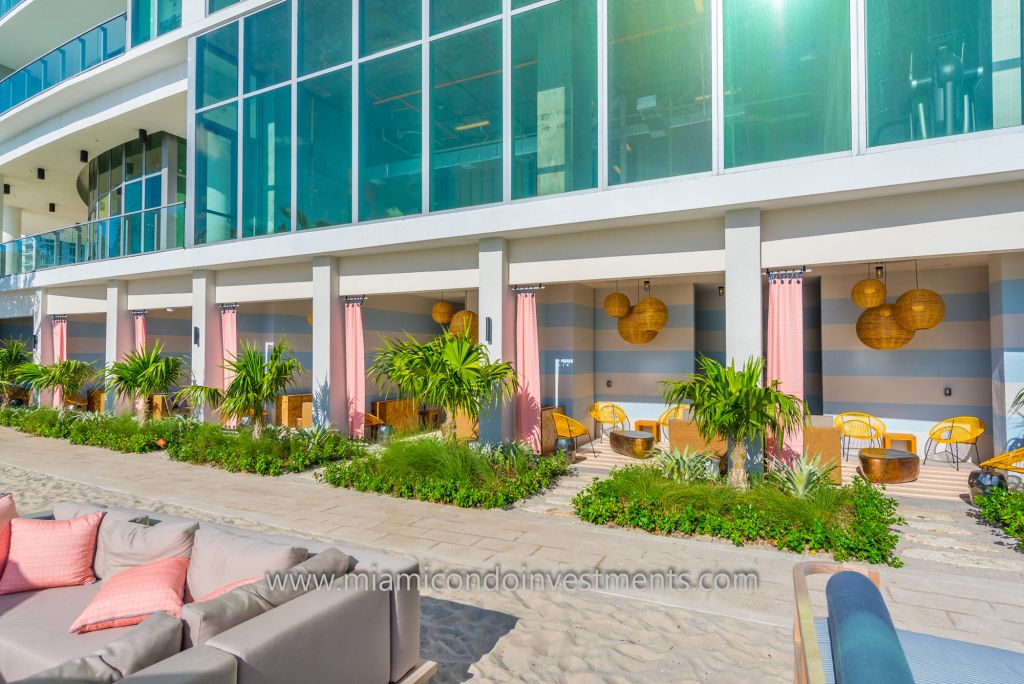
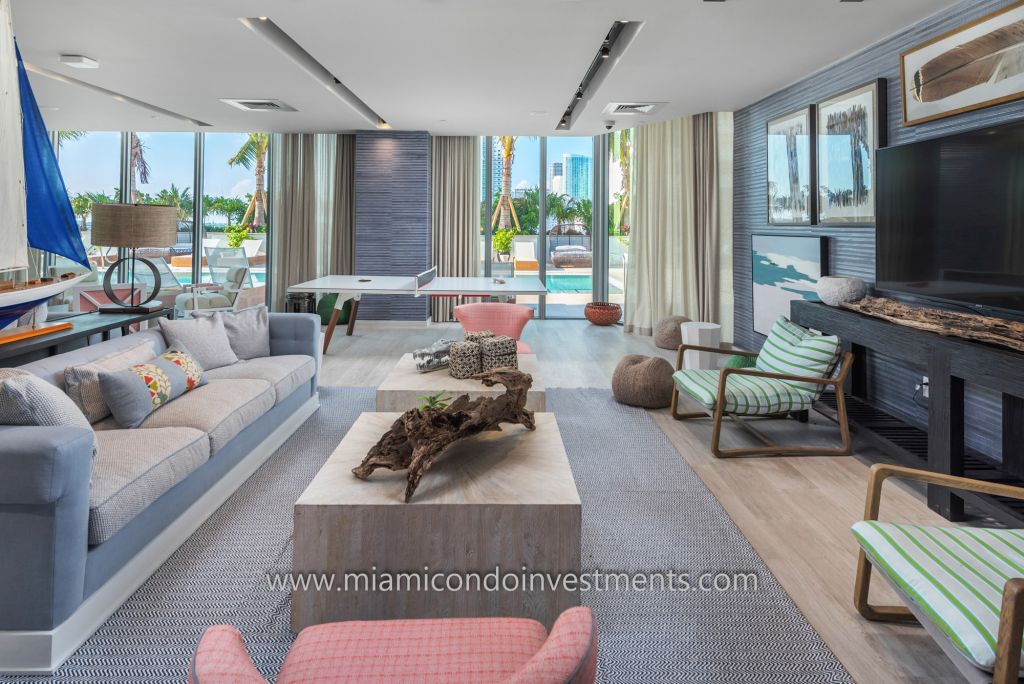
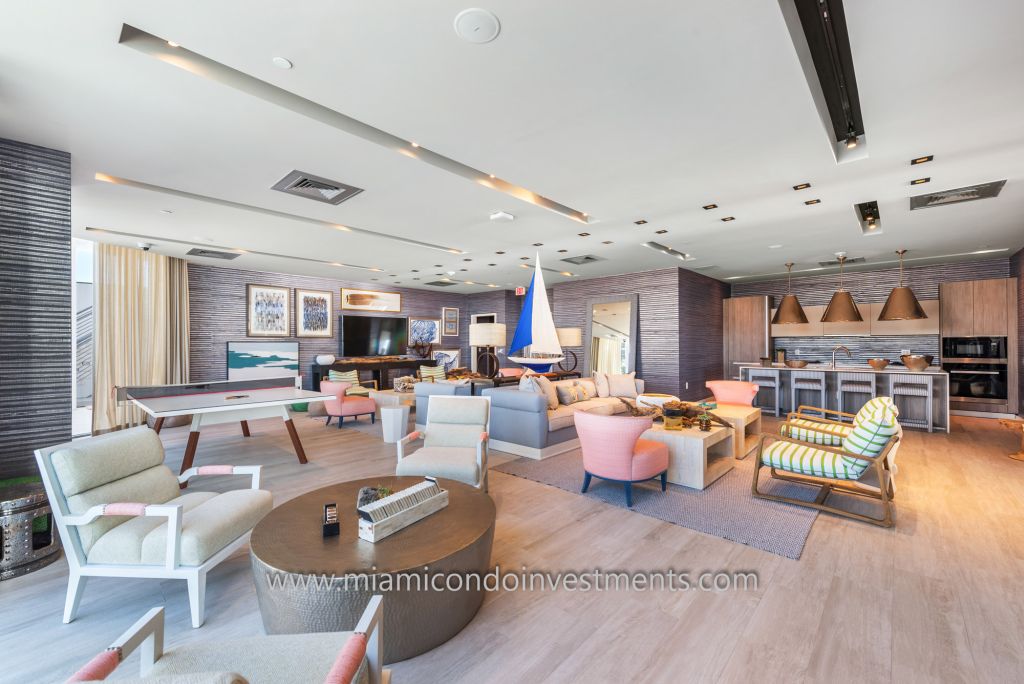
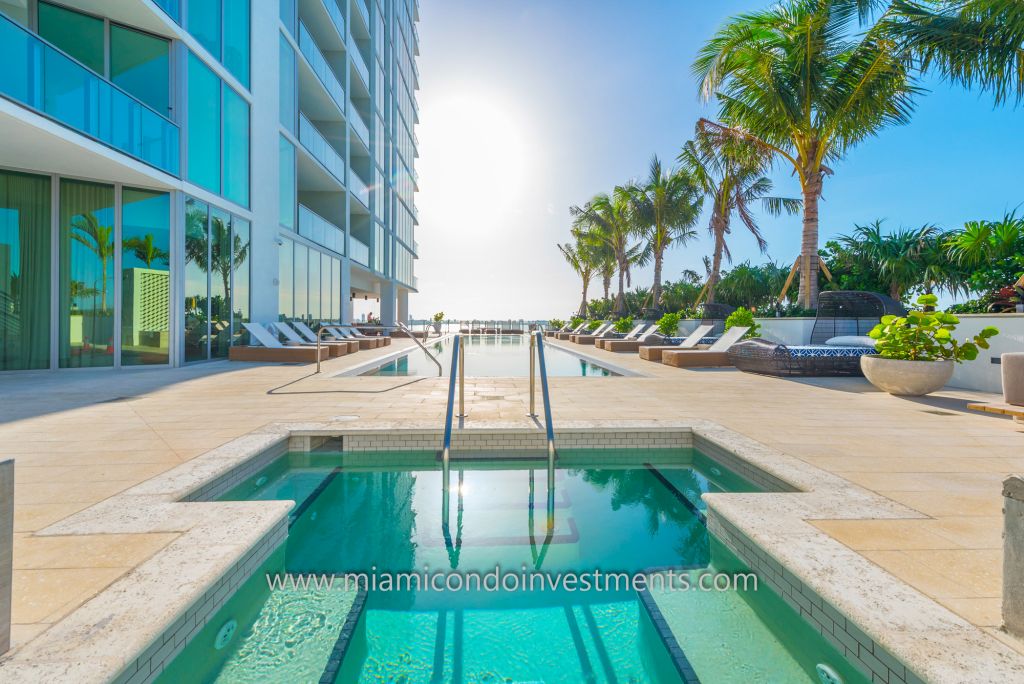
As the busy season for Miami real estate progresses, we’ve noticed quite the increase of inquiries from both renters and buyers for one of Edgewater Miami’s most upscale developments: the beautiful, Biscayne Beach. Its most notable feature is found on the ground floor of the building – mainland Miami’s first-ever beach club, complete with sand, lounge chairs, beach volleyball, and cabanas. Also, a highlight of the building is the gorgeous interiors by internationally-acclaimed celebrity interior designer, Thom Filicia (of Bravo’s hit TV show, Queer Eye for the Straight Guy). Completed in July of 2017, Biscayne Beach saw its first condo resale in September and has since seen 6 other resales closed to date.
Let’s check out the stats for our prospective renters and buyers…
Current Inventory
According to the MLS, there are 68 units currently available for rent of the building’s 391 total residences, 9 listed as pending rentals, and 48 marked as rented. Of those 68 units available for rent, 20 are 1-bedroom floor plans, 34 are two-bedrooms, 12 are three-bedrooms, and the final two are a penthouse and a beach house residence.
82 units at Biscayne Beach are currently listed for resale, with 3 marked as pending, and 7 closed.
Closed Rentals
Here are the price ranges for the closed rentals to date:
-1 bedroom units: $2300 – $2900 per month
-2 bedroom units: $2,500 – $4,200 per month
-3 bedroom units: $5,200 – $6,600 per month
Closed Resales
Here are the sales prices for the 7 resales that have closed to date:
-1 bedroom units:
-#1009 – $573,000 ($488 per sq ft)
-#2009 – $504,000 ($477 per sq ft)
-#3509 – $530,000 ($501 per sq ft)
-3 bedroom units:
-#1907 – $1,050,000 ($499 per sq ft)
-#2307 – $1,255,000 ($597 per sq ft)
-#3307 – $1,250,000 ($594 per sq ft)
-#4007 – $1,400,000 ($666 per sq ft)
The fact that all the closed resales so far are either of the 07 or 09 lines tells us that these two floor plans are the building favorites. Considering that they are located at the southeast (07 line) and southwest (09 line) corners of the building, there’s no wonder why. The view really opens up to the south with the added bonus of being able to enjoy views of the Downtown Miami skyline and sunset.
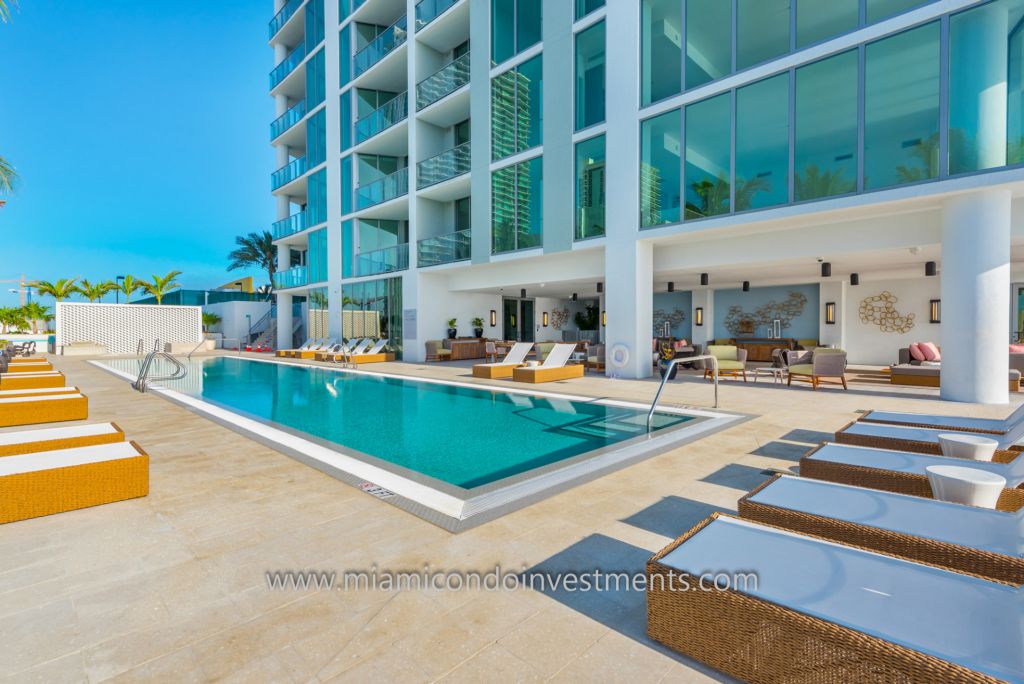
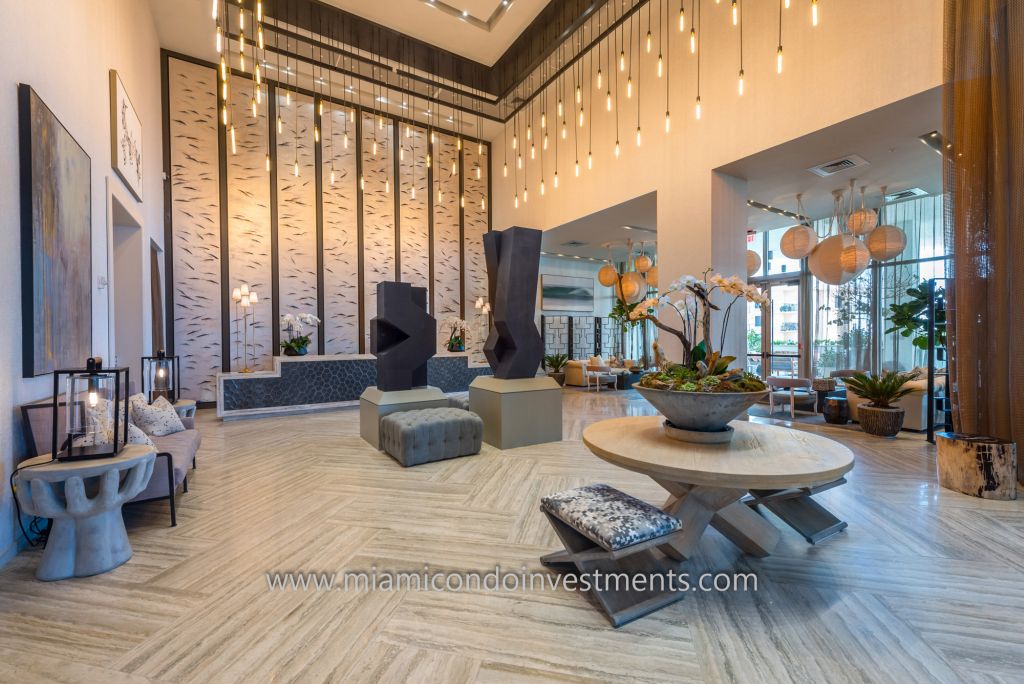
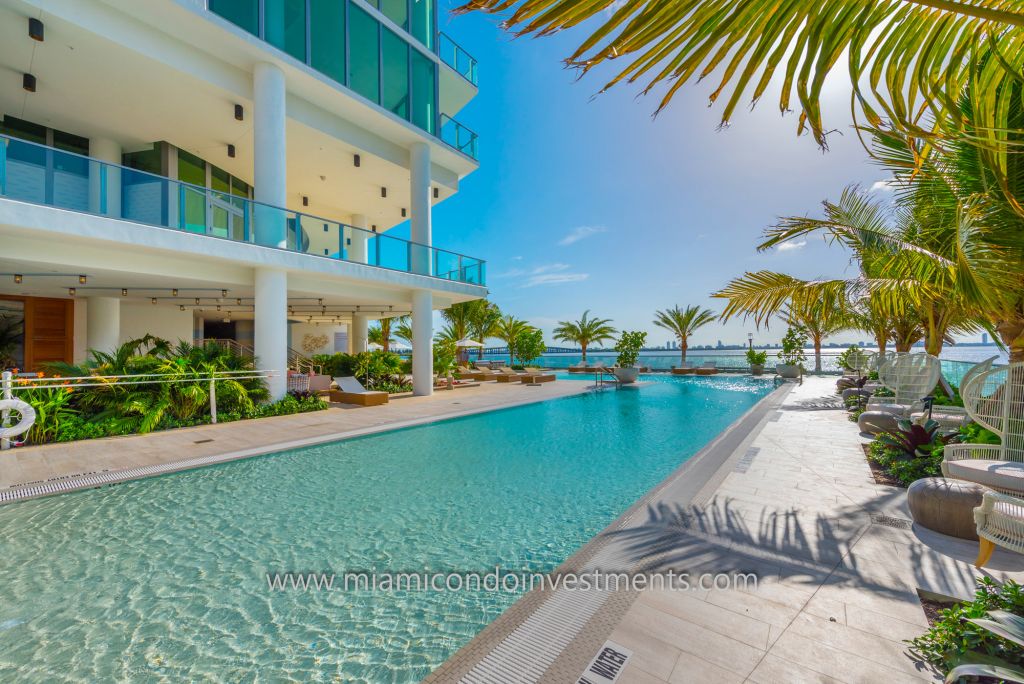
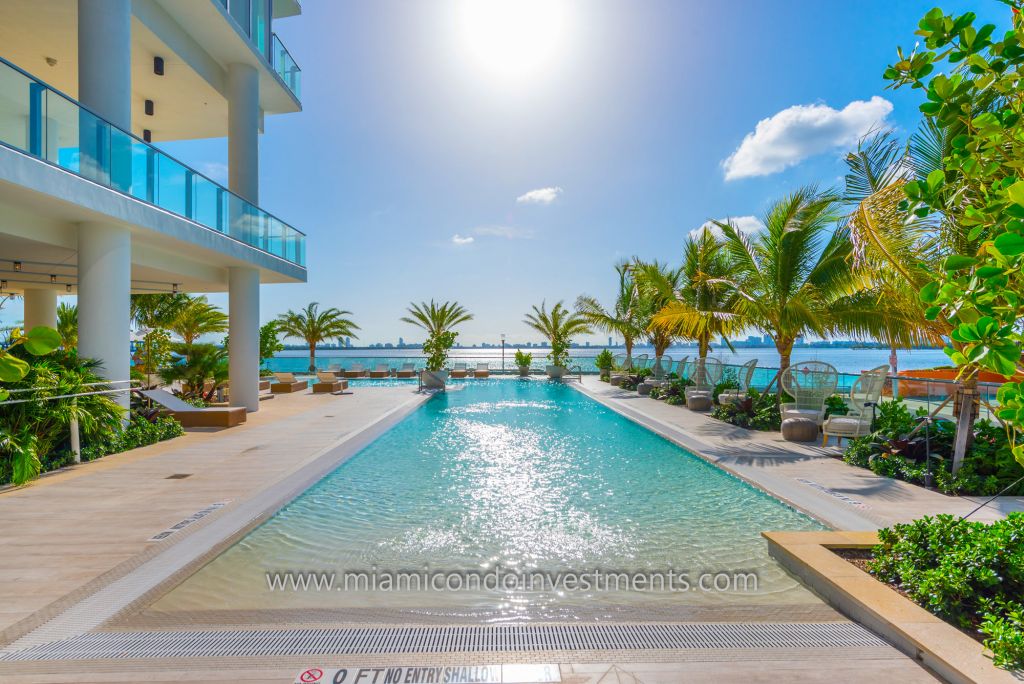
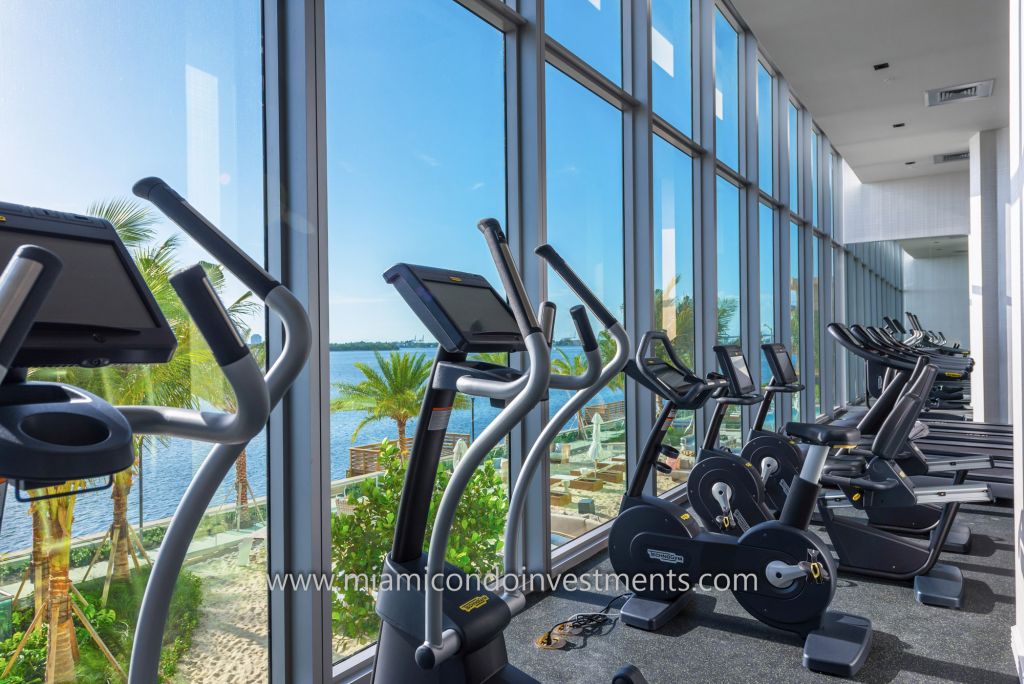
While stunning bay views, gorgeously designed interiors, and high-end finishes are bountiful at Biscayne Beach, there’s no question that its amenities are what makes this building so unique. From a family-friendly club room and children’s water feature at the impressive beach club to a residents-only amenities floor with a BBQ, tennis courts, dog walking area, and a pool; all it’s missing now is a tenant for the large, commercial restaurant space on the waterfront side of the lobby level. Check out the photos below.
If you or anyone you know has an interest in leasing or purchasing a condo at Biscayne Beach, email us at [email protected] to speak with one of our expert agents.
The Ultimate Market Stat Monday: Downtown Development Authority’s Mid-Year Report
Despite the fact that many media outlets and whispers in the marketplace would leave you to believe that the cards are stacked against us in the Miami condo market, things really aren’t so bad according to the Downtown Development Authority (DDA) Mid-Year 2017 Report. As they state in the report, “2017 has not been the best of times, but it hasn’t been the worst of times either.”
I have included the full 28 page report below, but also a synopsis…
RENTALS
The report separates the rental market into two sub-categories. Conventional rentals are the rental-only buildings that are all managed by one company. 2017 has brought 969 new rental units to the market, leaving just under 3,600 under construction. The condo rentals are considered shadow inventory since there is no way to tell whether a unit would be a rental, resale, or final sale until after delivery.
Amazingly, despite increased inventory, rental prices have increased slightly in conventional rental communities. I had previously been skeptical about the rental community market with so much inventory going up, but our neighborhood is very attractive and people are flocking in.
The segments of the rental market showing the biggest price gains are 1 bedrooms and 3 bedrooms, showing 3.4% and 3.6% growth since last year respectively. Studios are showing a slight decrease in price, but I suspect that this is due to the fact that tenants who would typically take a studio are now taking one bedrooms. Three bedrooms are less plentiful in the neighborhood, so are almost always a good investment opportunity.
PRE-CONSTRUCTION
The market in new developments is also hanging on. The researchers report that 2016 and 2017 YTD have garnered about 50% of the sales experienced in 2015, which experienced 25%-50% less than 2014. It’s undeniable that things have changed, but we will survive and the projects will be sold.
While the market has slowed markedly, projects that are currently under construction and 55%-60% sold do not seem to be in distress, according to the researchers.
One submarket that could flourish in the upcoming 18 months is the smaller-scale boutique project market. According to the report and our experience, these developments tend to capitalize on infill lots between the larger developments and do very well when the larger buildings slow down.
RESALES
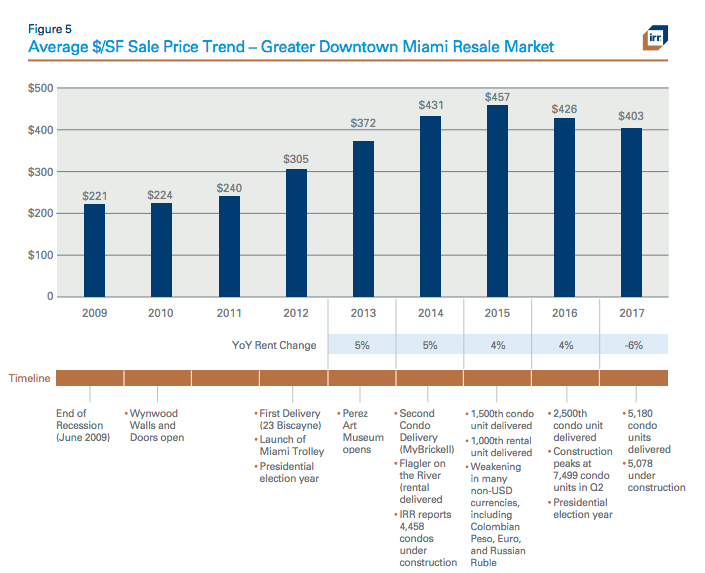
Our resales are facing a tremendous amount of inventory with a 6% decline in overall pricing since last year. From July 2016 to June 2017 there were an average of 99 resales sold. That rate needs to be raised by an additional 500-700 listings sold per month to reach pricing equilibrium.
The conclusion of the report is that because so many new construction projects continue to be delivered and fewer projects are announced, we could see some stability in 2018 if nothing crazy happens.
Unless you’ve been living under a rock over the last two years(or outside of Miami), you have to know that Icon Brickell is undergoing an epic pool repair. How’s that coming along?
According to their management office, very well. Everything is still on schedule to see the pool fully repaired and reopened by the December 15 date they had initially anticipated. Of course, the last year has left a lot of frustration and questions for unit owners and residents, but there is finally a light at the end of the tunnel. Because of the frustration of not having a pool, coupled with the inconvenience of living in a construction zone and our over-saturated market, have people been able been able to land some amazing bargains? Not so fast…
While there are currently 167 active listings on the market for sale and 113 available for rent, the development is still seeing solid traffic. The third quarter of 2017 brought 30 new closed sales and 104 new tenants, all paying more than 90% of the asking price.
Sales
The most expensive listing to trade over the last quarter was Bay Loft 806. It was a 2 bedroom with a den and direct bay views from each room, and traded for $745,000 after having been listed for $780,000.
The least expensive transaction was a studio in the Viceroy (W Hotel) tower. It had been listed for $270,000, but traded for $250,000. One of the unique features of Tower 3 at IconBrickell is that daily rentals are allowed.
On average, buyers have given 92% of the asking price of the condos they purchased, or $442/ square foot. It also takes 233 days to sell a listing on average, but as many as 644 days. Given that there were 30 new closed sales during the quarter, that leaves us with 16 months of inventory. This really isn’t a bad number compared with the market as a whole.
Rentals
On the rental side, things move much more quickly. With 104 closed rentals and 113 available options, there is just over 3 months’ of inventory.
The least expensive rental was a studio on he 8th floor with a river view that rented for $1,675/month. The most expensive was a 3 bedroom unit with 2 baths and a big bay view that leased for $6,000/month.
On average though, the listings are trading for $2.90/square foot and take 68 days to find a new tenant. The tenants are also paying 95% of the asking price, so there are no special bargains to be had despite the pool situation.