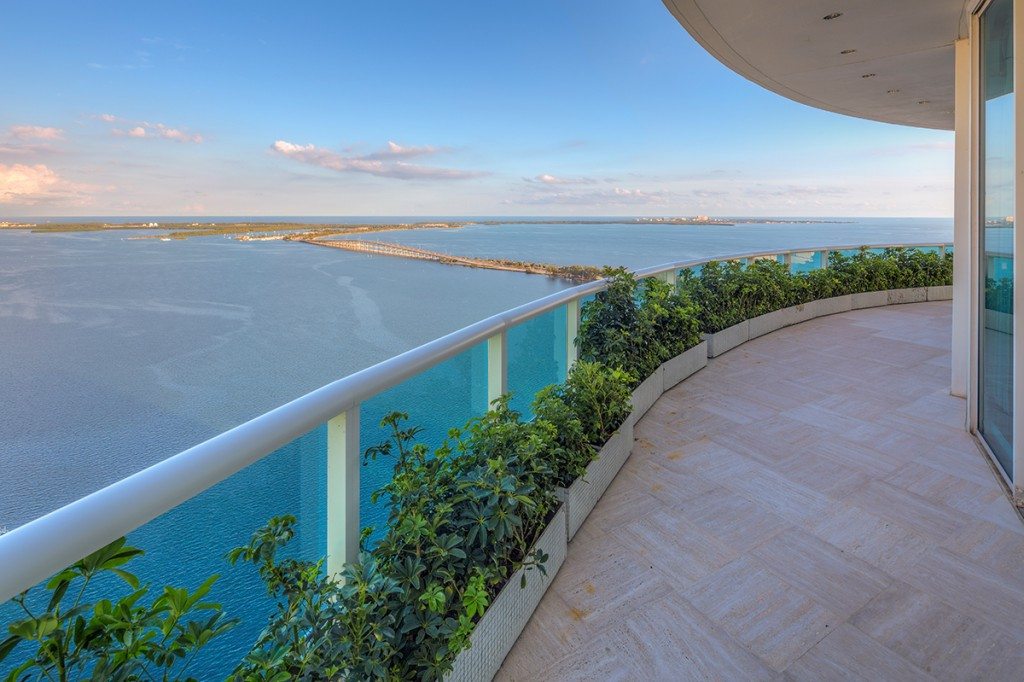
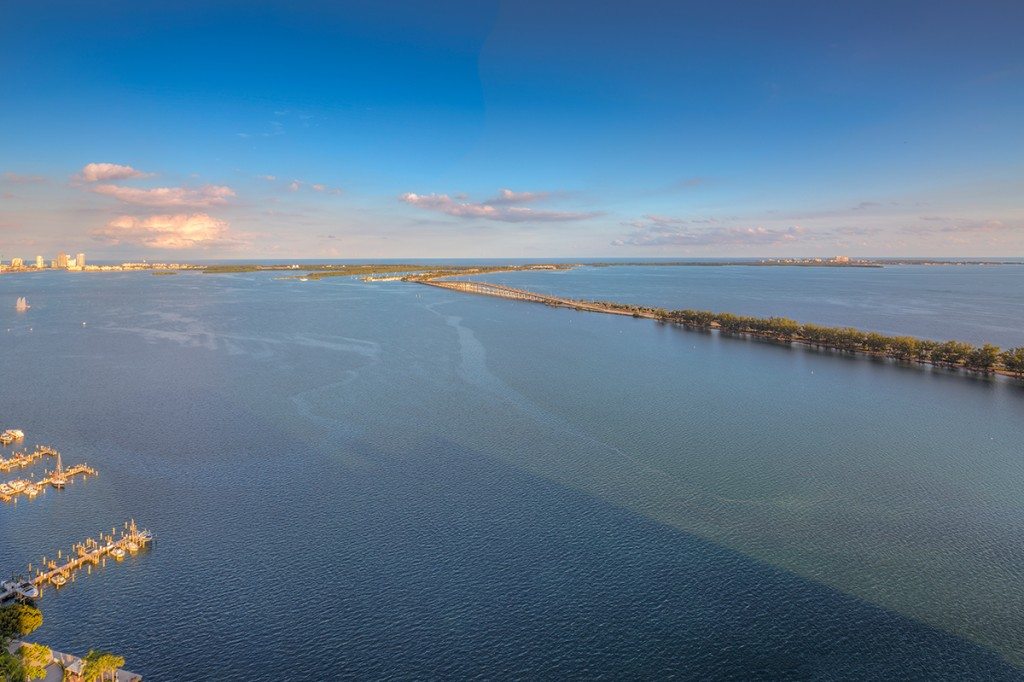
Today we start the semifinals of the 2017 Miami Open on Key Biscayne, so let’s wrap up this condo list by looking at the buildings in the Downtown Miami area that have tennis courts. We qualify the Greater Downtown area as being Brickell, Downtown, and Midtown. Since there aren’t yet any buildings with tennis courts in Downtown Miami or Midtown, we’ll look at Brickell today.
Let’s start with the building closest to the Rickenbacker Causeway that takes you to the tennis center and work our way north. That puts us at Brickell Townhouse, which was built in 1963 but remodeled in the early 2010’s. It has been reported that there is an offer from Vladislav Doronin to purchase the entire building and use it as an 8 acre waterfront development site, but that is a very complicated deal to put together. In order for it to happen, 90% of the condo owners must agree to the terms. So, in the meantime, 1 bedroom units start at $274,000 up to $675,000 for a 1,703 square foot 3 bedroom. The 1 bedroom is newly renovated with a park and city view, the 3 bedroom is renovated with a modern look and has a park and partial bay view. Rentals range from 1,800/month to $4,300/month.
Next door to Brickell Townhouse is the Brickell Bay Club (not to be confused with the Club at Brickell Bay, which is at 1200 Brickell Bay Drive). Brickell Bay Club was built in 1974 and has a whopping six tennis courts. The building is also situated so that most every unit has at least a partial bay view, but most have a direct view. There are also some great opportunities to find renovation deals. The 1 bedroom sales start at $279,000 (not bad for a waterfront deal!) up to $1.575 million for the 3,100 square foot penthouse. Tenants should prepare to pay between $1,850/month to $3,600/month depending upon the size of the unit.
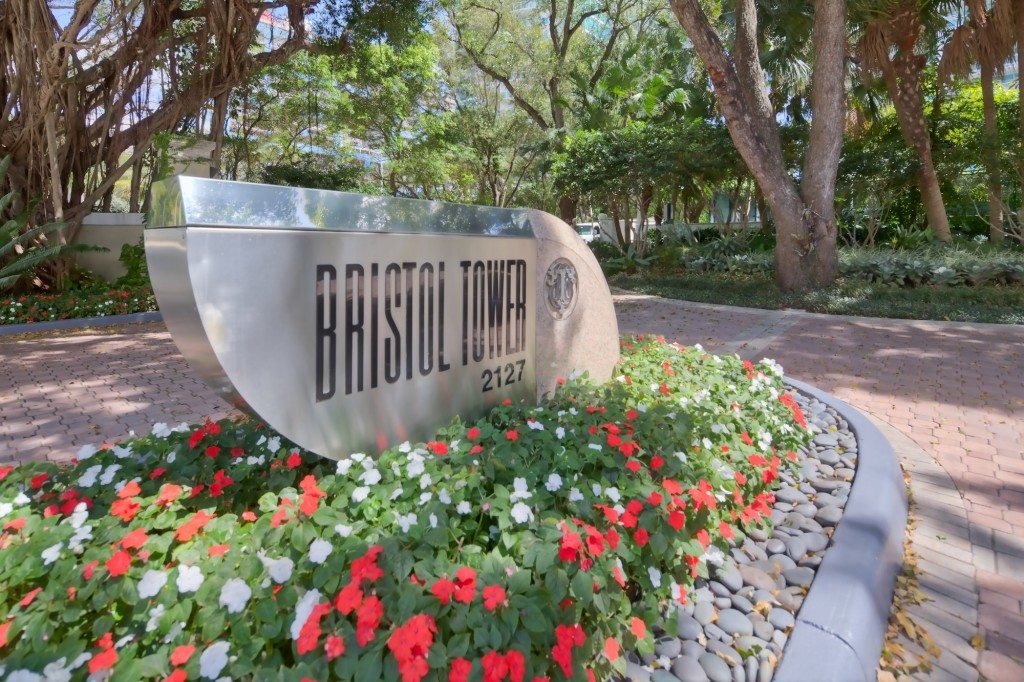
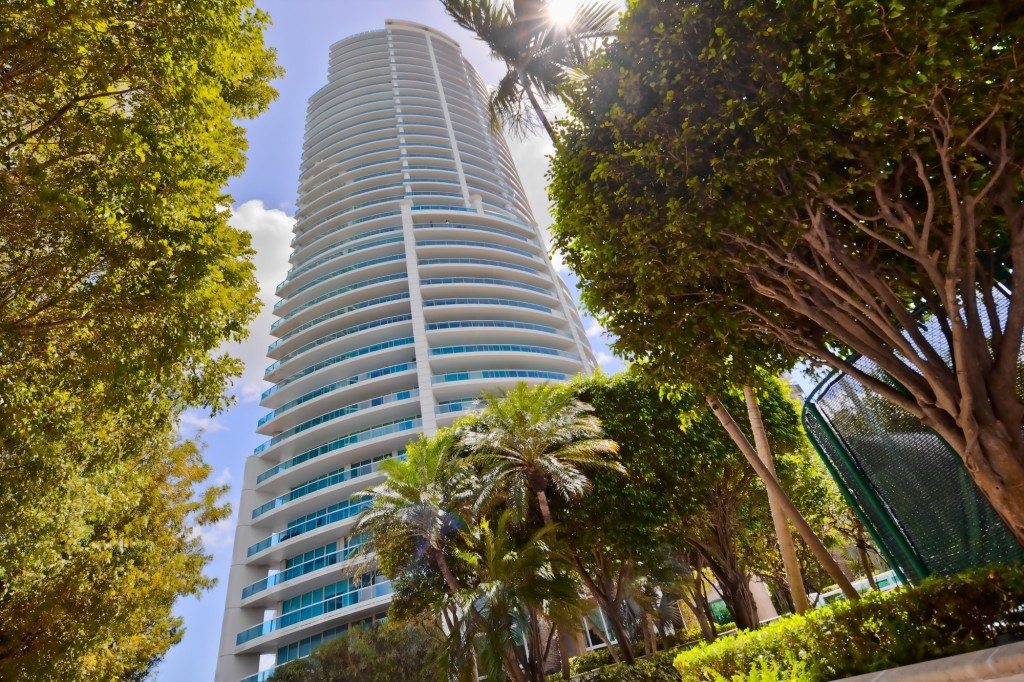
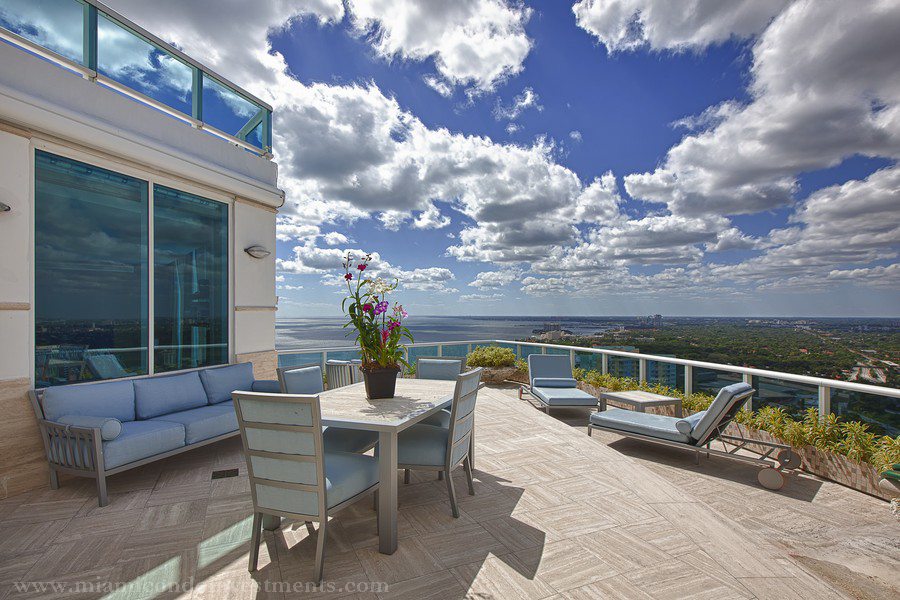
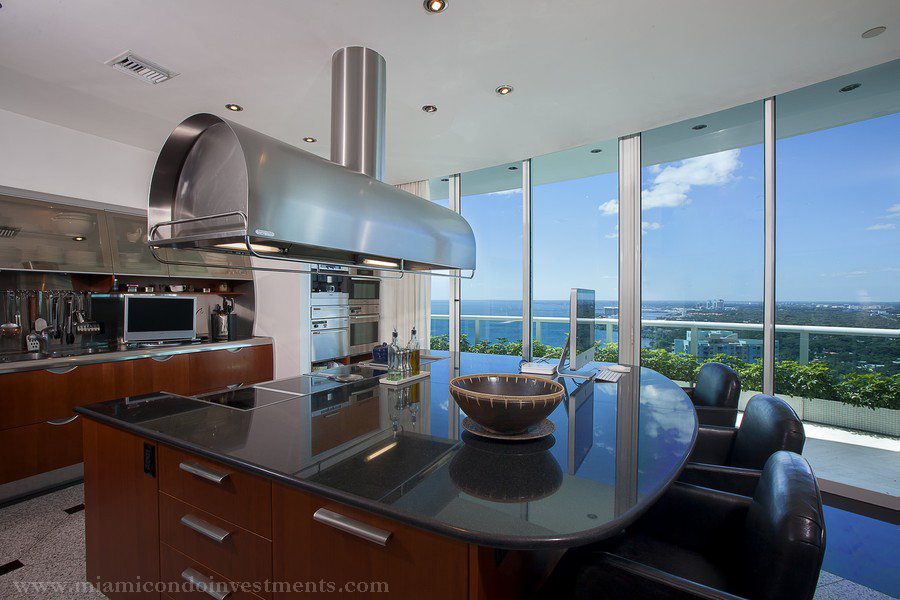
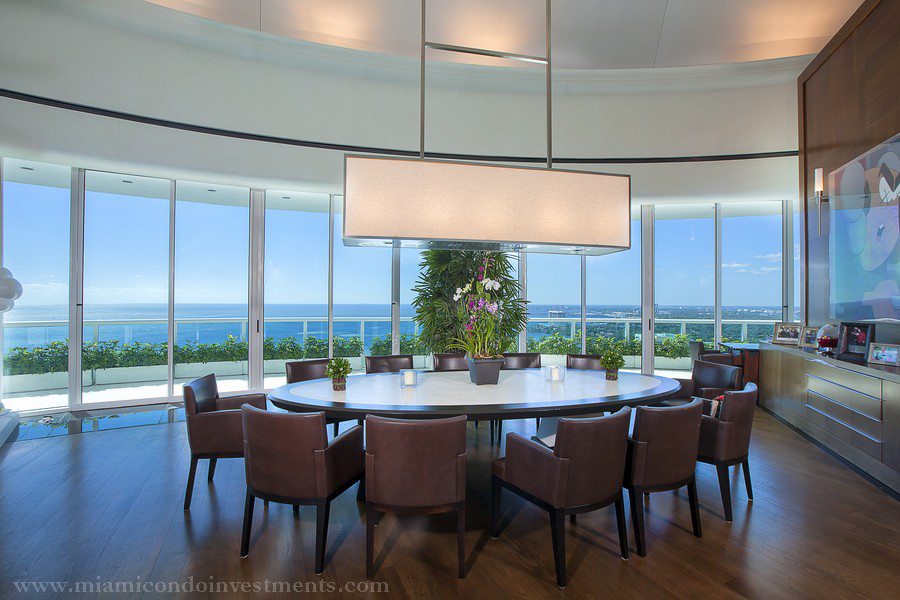
Two blocks up is Bristol Tower, the site of Pharrell’s famous penthouse and the first of Ugo Colombo’s Brickell buildings. The 40 story rotunda shaped building offers large units, from 1,210 square foot 1 bedrooms up to the 9,000 square foot triplex penthouse. The largest unit on the market currently is a 2,825 square foot 3 bedroom for $2.38 million. Rentals range from $4,700/month for a 2 bedroom to $9,500/month for a 3 bedroom.
The newest building on the Brickell list is Skyline at Brickell, which was built in 2004. The floor plans range from 1 to 3 bedrooms and offer up to 1,762 square feet. Prices start at $309,900 or $1,850/month for a fifth floor 1 bedroom with 791 square feet up to $820,000 or $3,900/month for a 2 bedroom an $950,000 to $1.1 million for a 3 bedroom. Most all of the units have at least a partial bay view.
From the newest building to possibly the most famous, many people have seen this iconic Miami building in the Scarface as well as Miami Vice. It is the first high rise designed by Architectonica, who has gone on to dominate the skyline. Atlantis on Brickell offers 2 to 4 bedroom plans from $475,000 to $1.45 million and rental units from $2,900/month to $3,700/month. All of the rental units available today are 2 bedroom plans between 1,304 square feet up to 1,666 square feet.
To follow the success of Atlantis, Architectonica went on to design the Imperial at Brickell at 16th and Brickell avenue in 1983. This building is very popular due to its proximity to the financial district and large floorplans. Available units range from 1,316 square feet to 1,792 square feet and $489,000 to $895,000. Rentals range from $2,600/month for a 2 bedroom to $3,500/month for a 3 bedroom.
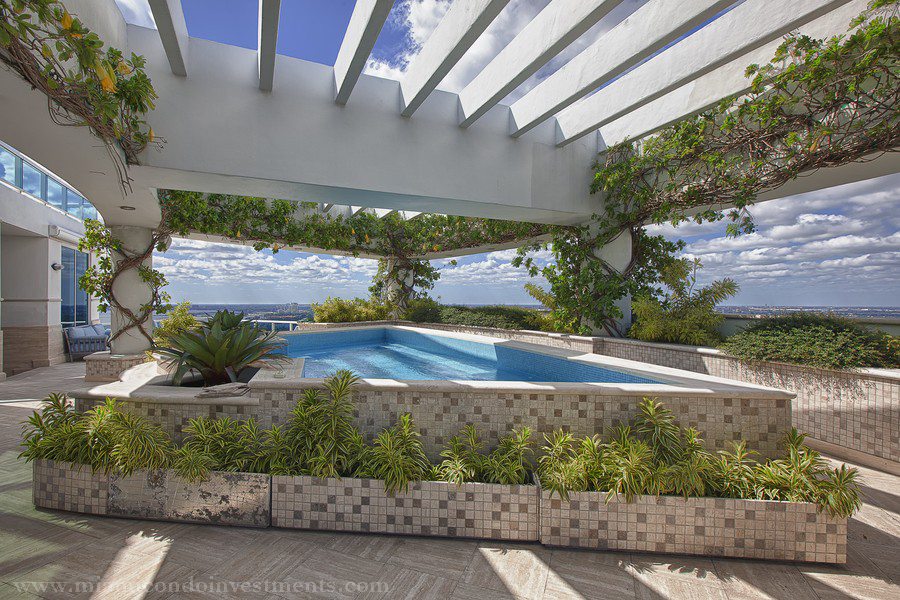
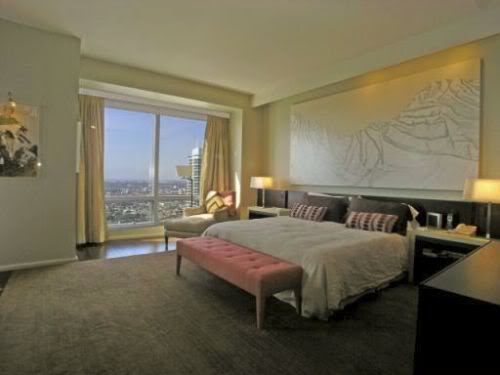
The most luxurious option on our list of Brickell apartments that have tennis courts is Ugo Colombo’s Santa Maria. This is actually one of the most luxurious buildings in the neighborhood. It was built in 1997 and features the last of the original Brickell waterfront estate homes that once lined the bay. Intensely private, there are no photographs allowed of this estate, but it is an amazing place to hold an event. The apartments at Santa Maria start at $1.93 million up to $11.5 million. They have private elevators and 2,100 square feet up to 6,300 square feet. Rentals range from $6,900/month to $20,000/month.
Another interesting building in Brickell that also has a tennis court is The Palace on Brickell. It was developed by the husband of the “Queen of Mean,” Leona Helmsley. She once owned the penthouse, which was sold to a Saudi Sheik and redesigned as Brickell’s Taj Mahal. You can see photos of that penthouse here. As for current availability, units start at $595,000 and go up to $699,000. All of the available units are 2 bedroom plans around 1,650 square feet. If you are looking to lease, there are slightly more options between $3,400/month to $4,600/month. All of the rental units are also 2 bedroom plans.
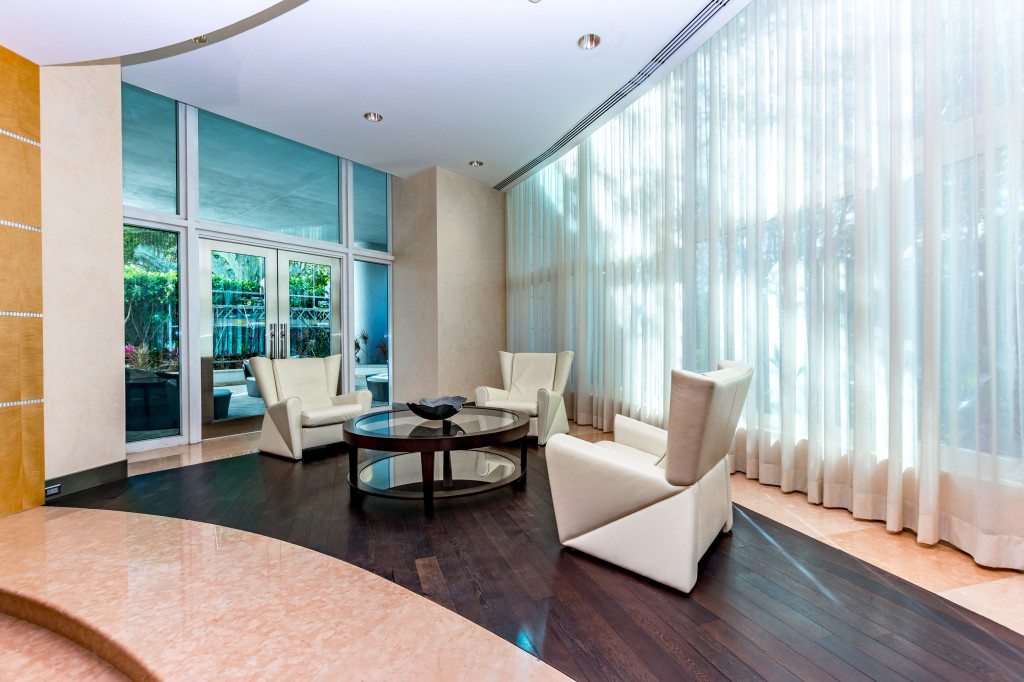
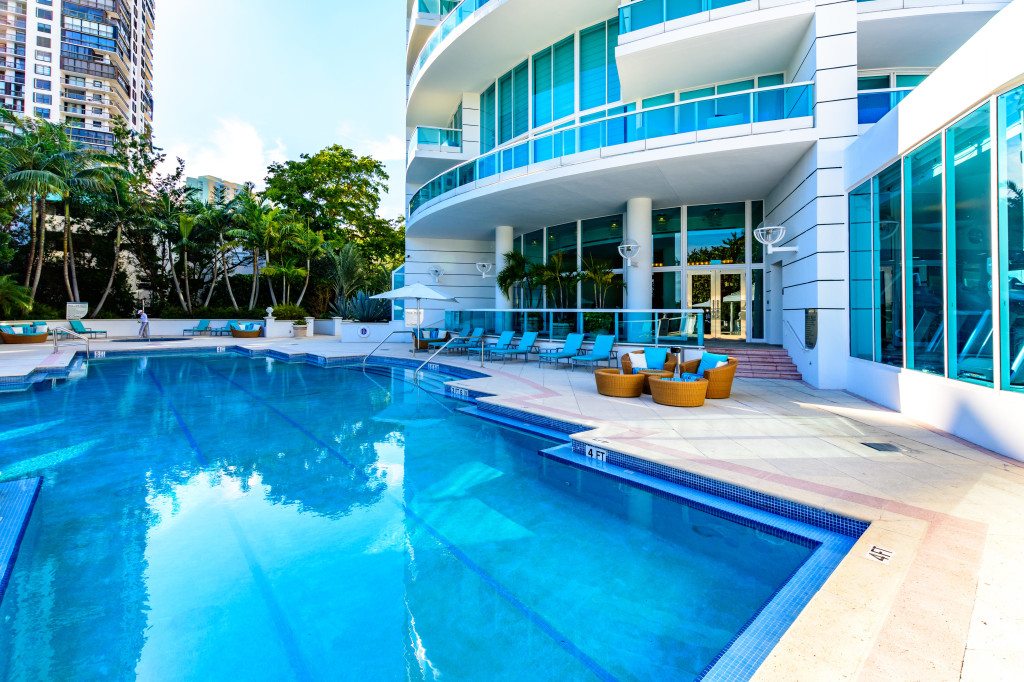
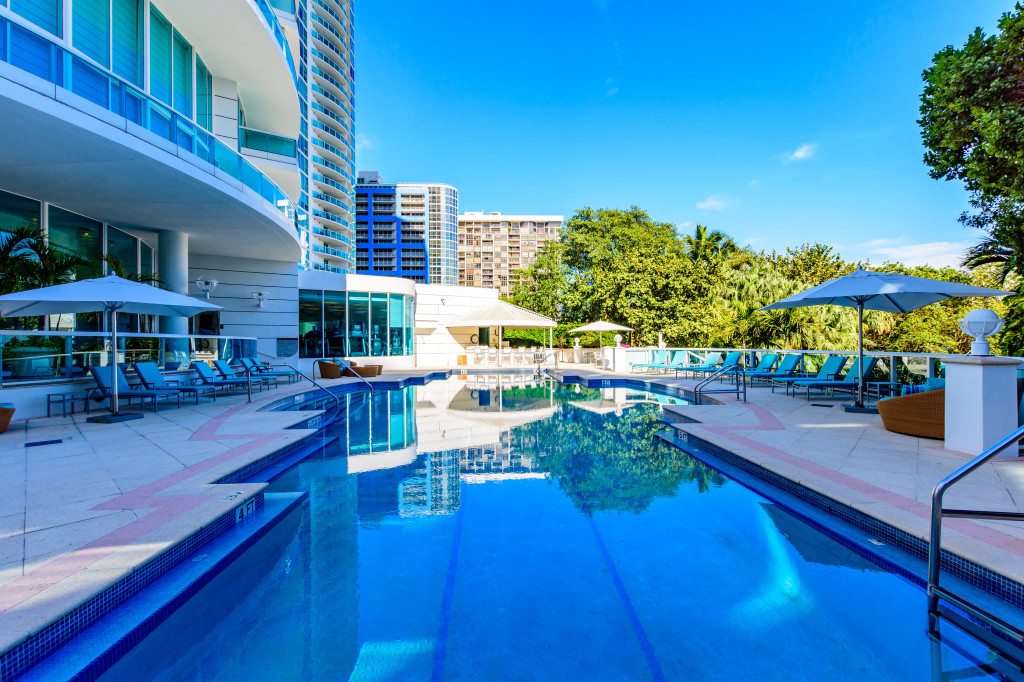
The only current condo building in the financial district section of Brickell that has a tennis court is The Mark on Brickell. It is also located on a waterfront lot, at 1155 Brickell Bay Drive. Despite being built in 2001, the building recently underwent a thorough renovation. They received a new lobby, the pool deck and tennis court were refurbished, the building was repainted and the balcony railings were switched to glass from the original iron railings to give the building a newer and more high end look. This is one of my personal favorite buildings to get a great value, particularly after the modernization. It is close enough to the action of Brickell to be a part of it, yet secluded enough to be more peaceful when you want to be. The layouts are modern and usable and the prices are fair. Currently there are 1 bedrooms starting at $290,000 and a 2 bedroom penthouse is available for $760,000. All of the units have a bay view, and rental prices range from $2,100/month to $3,700/month.
Just like yesterday, when we toured the Brickell Key condo buildings that have tennis courts, it is important to remember that the prices we discuss are what is available right now. Apartments come available and others go into contract every day, so reach out if you are interested in learning more about any of these Miami buildings with tennis courts.
Pharrell Williams Finally Sells His Toy-Filled, Domed Penthouse at the Bristol Tower for $9.25 Million
Pharrell Williams’ Penthouse at the Bristol Tower.
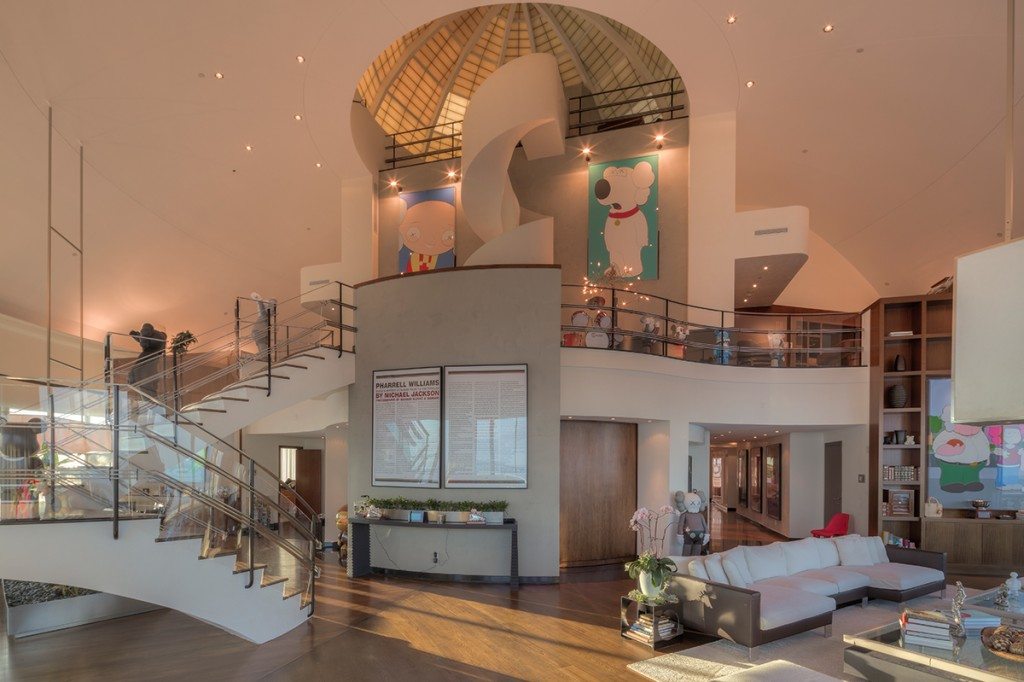
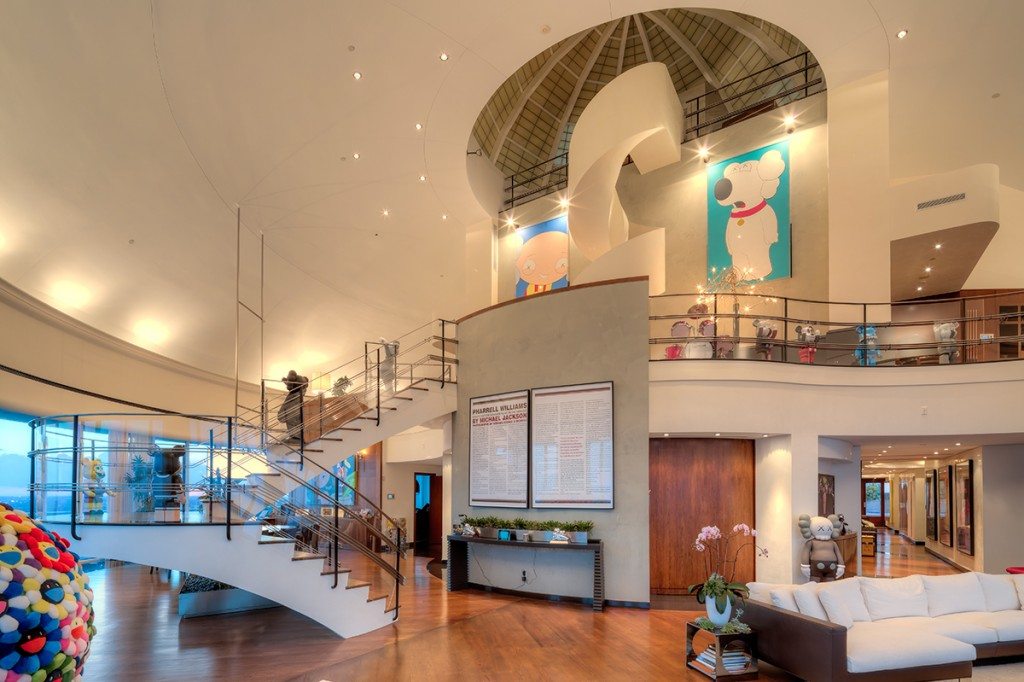
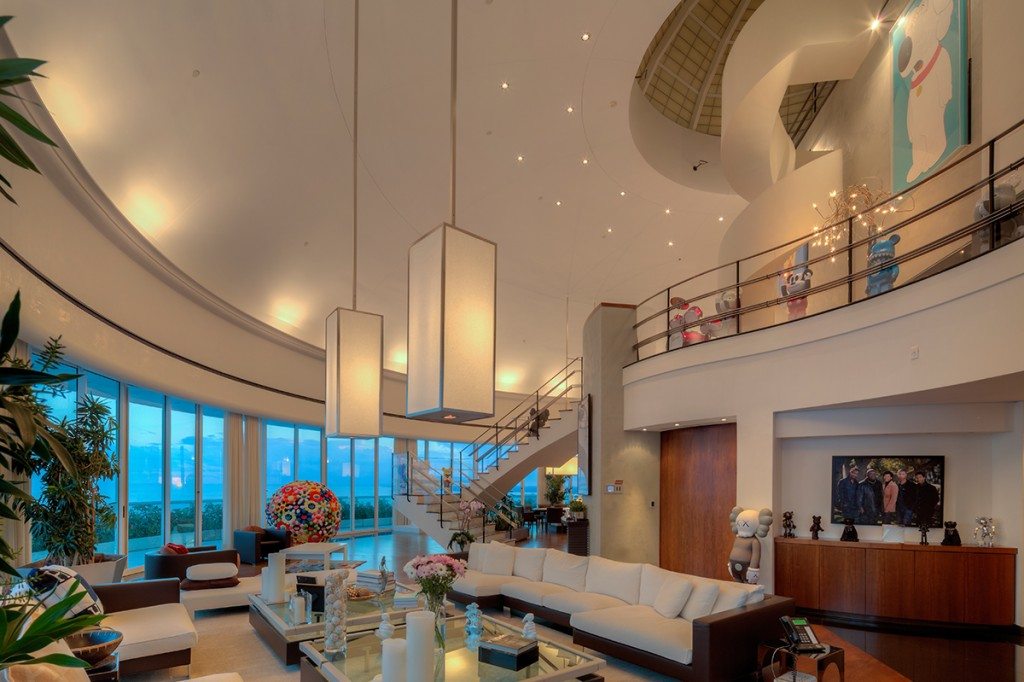
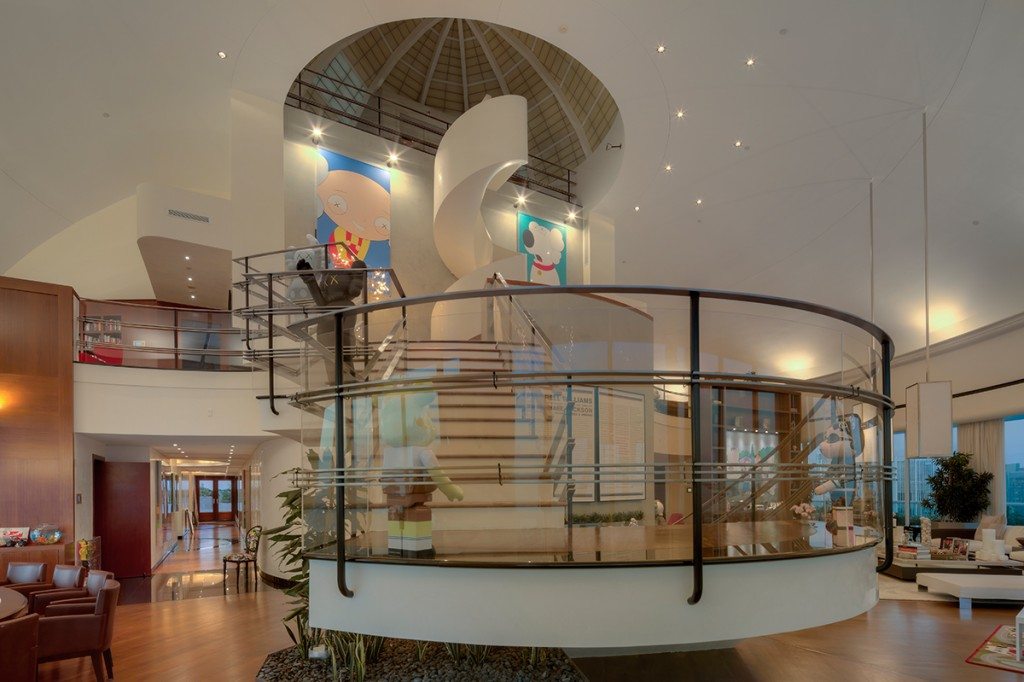
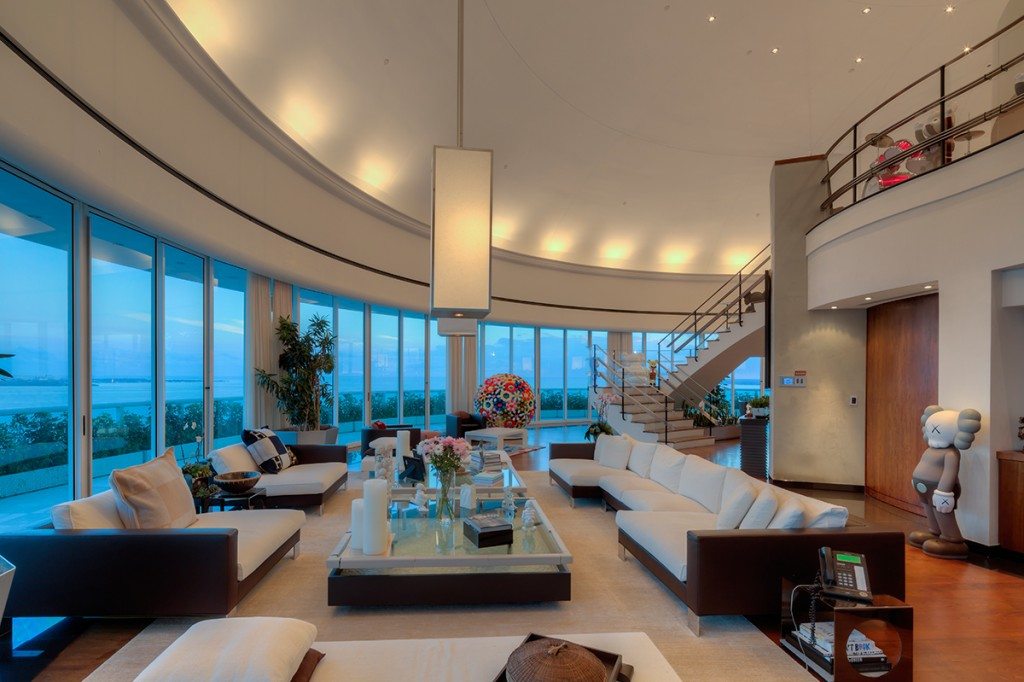
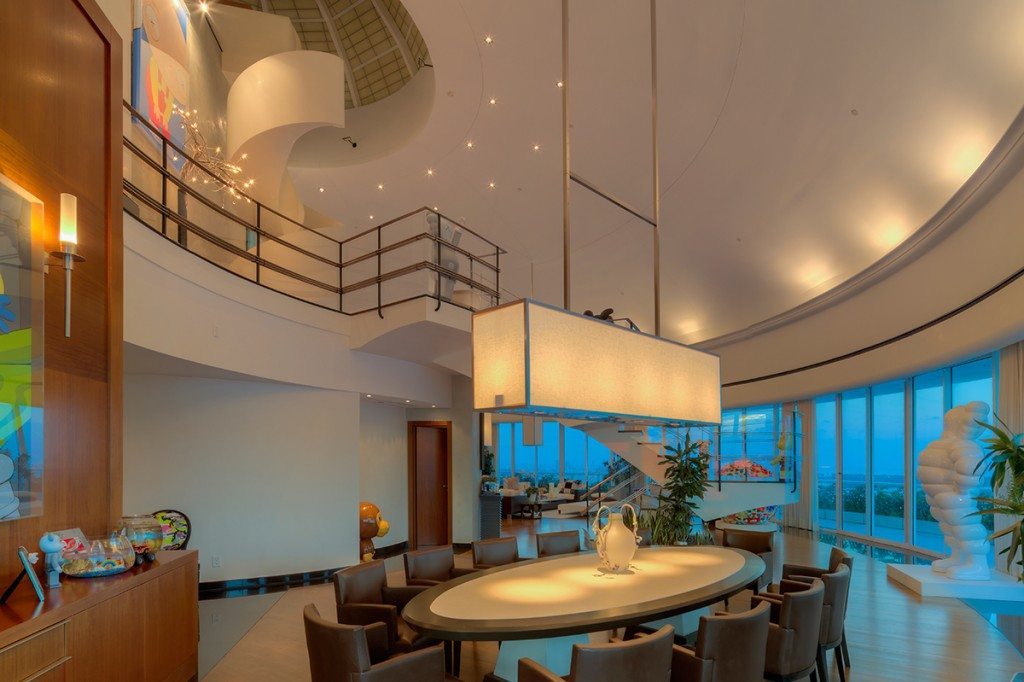
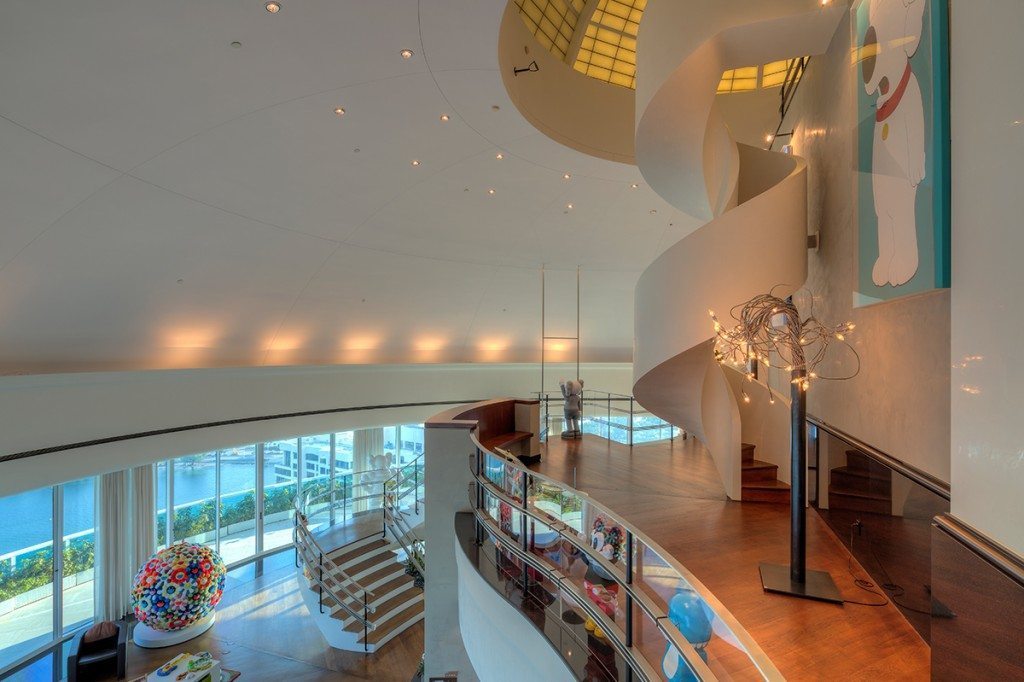
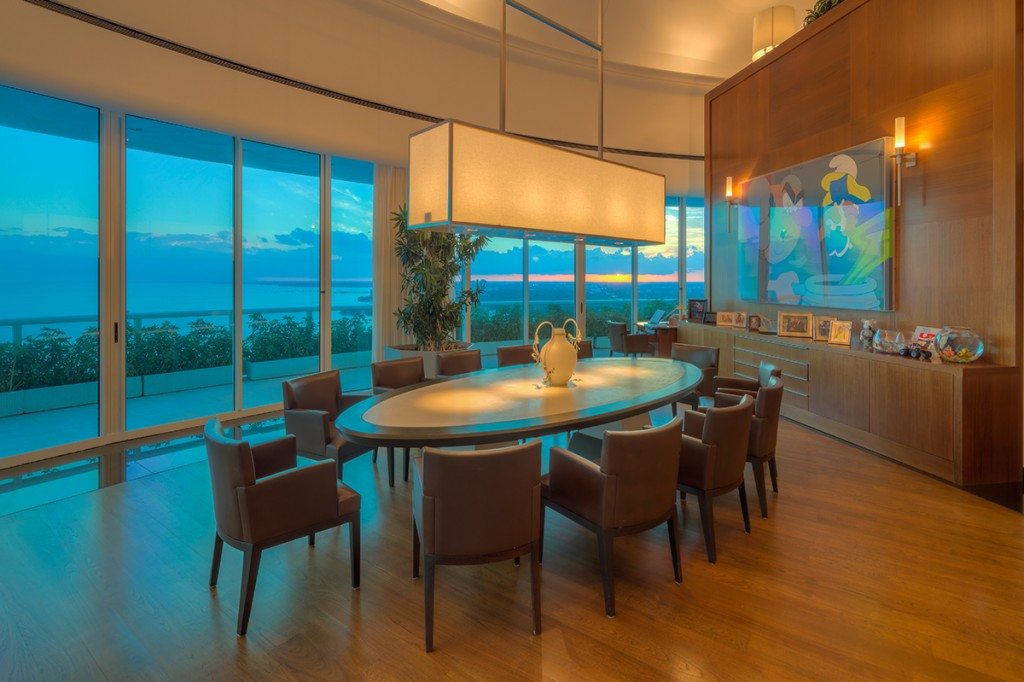
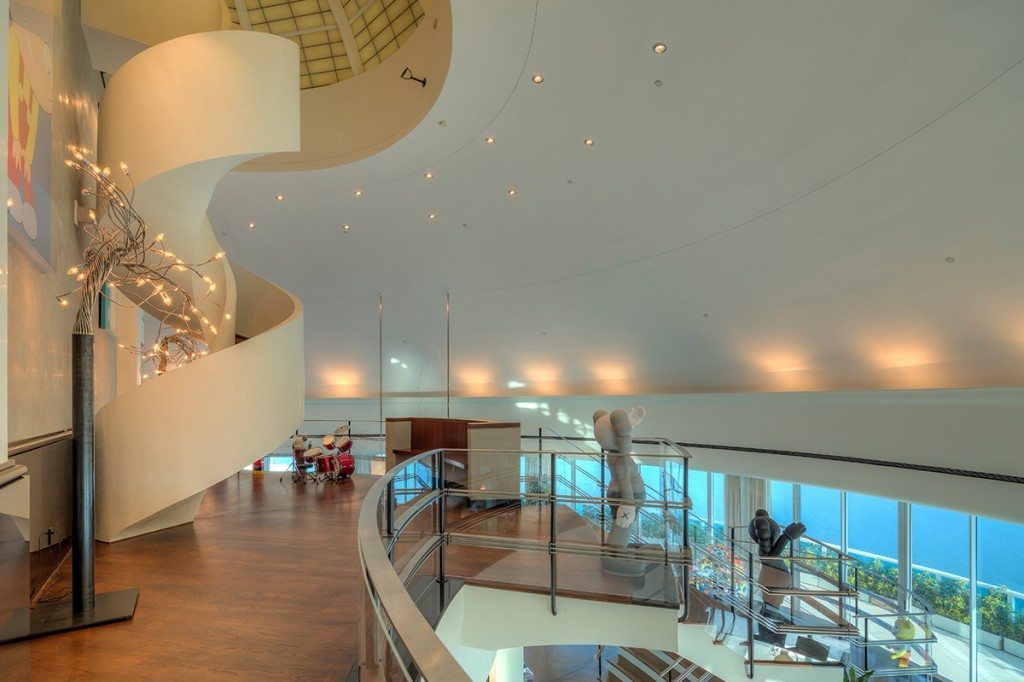
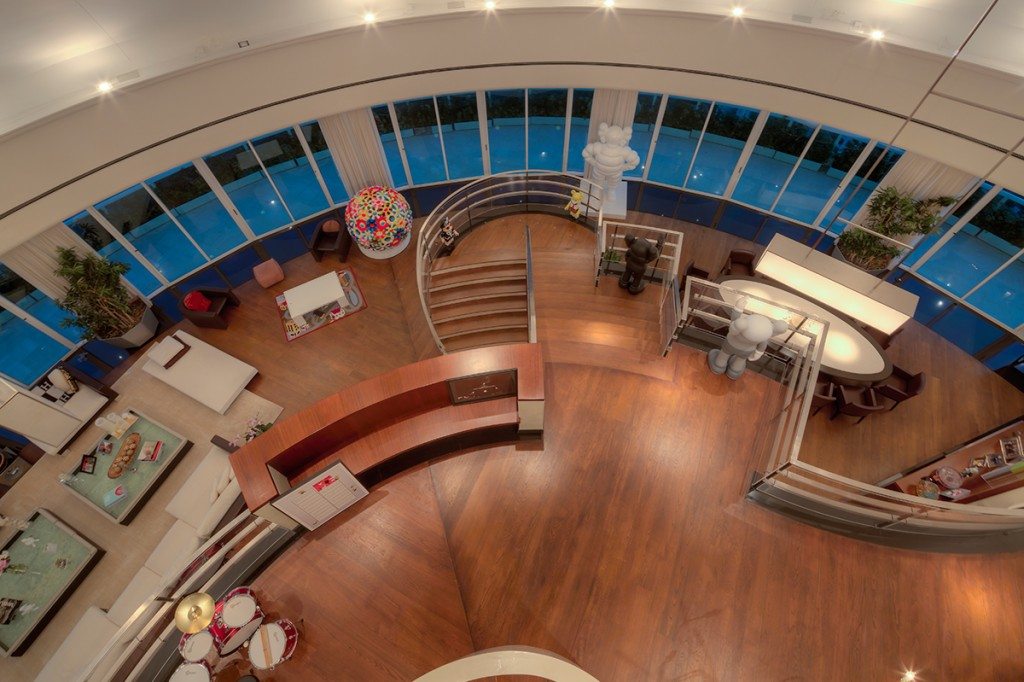
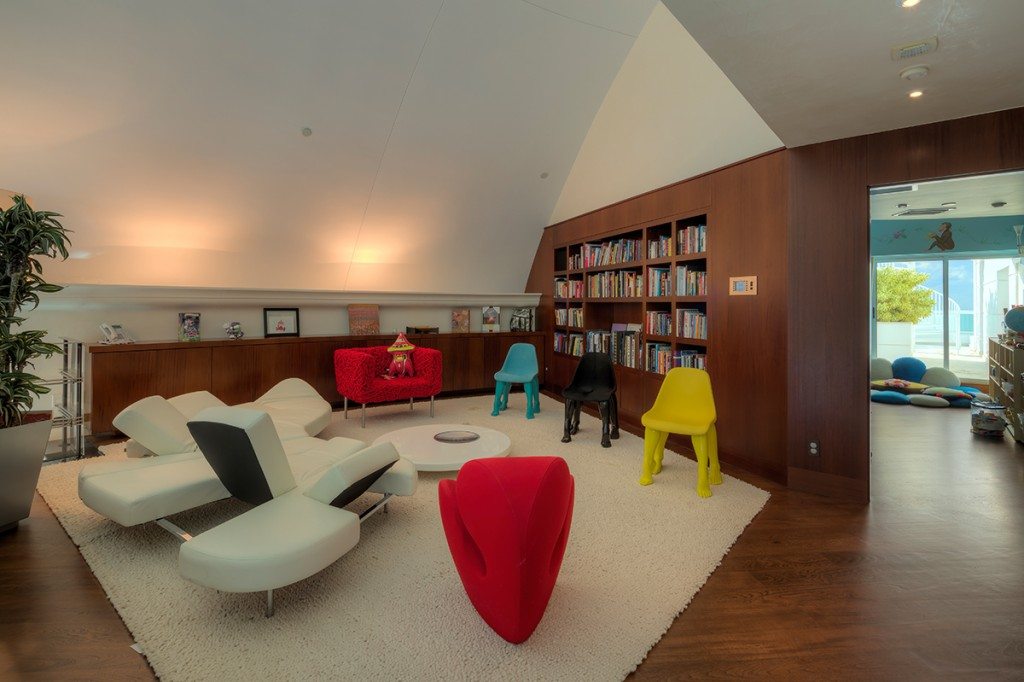
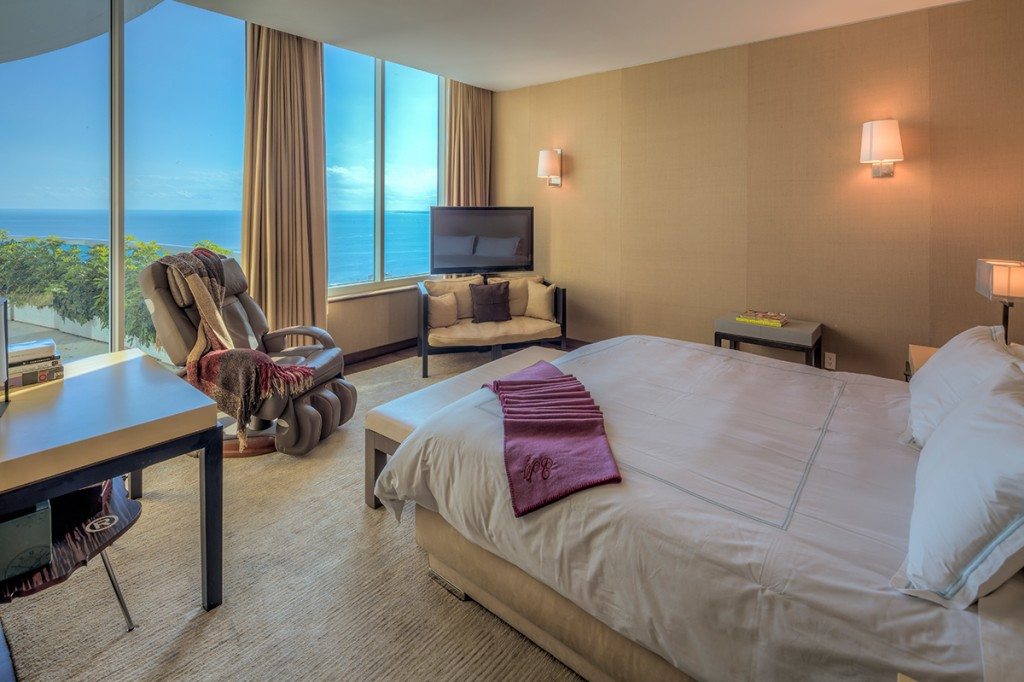
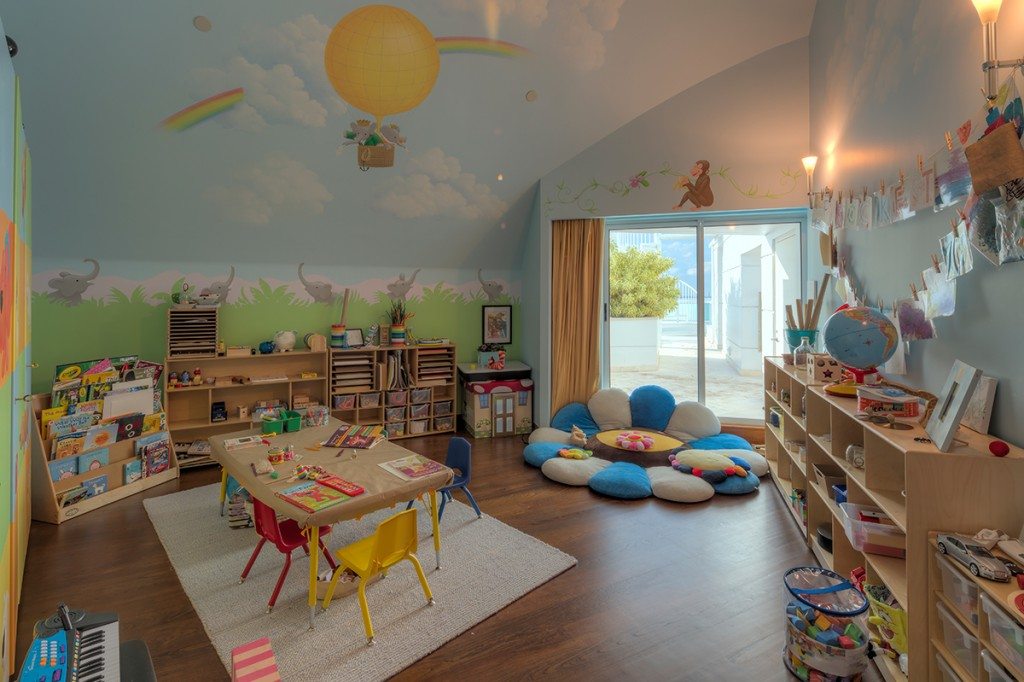
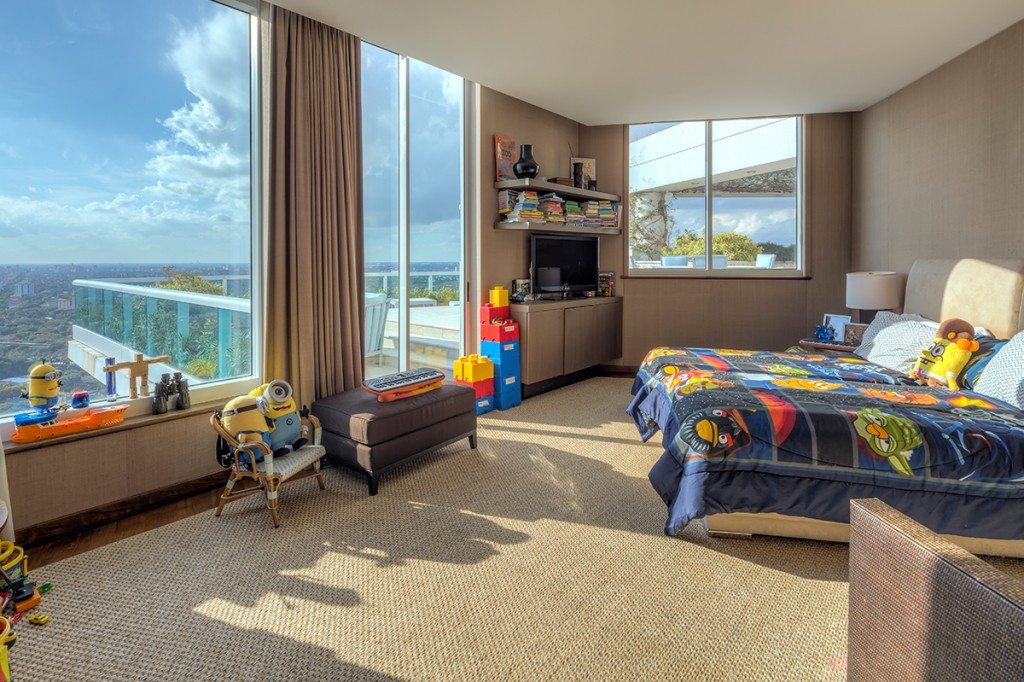
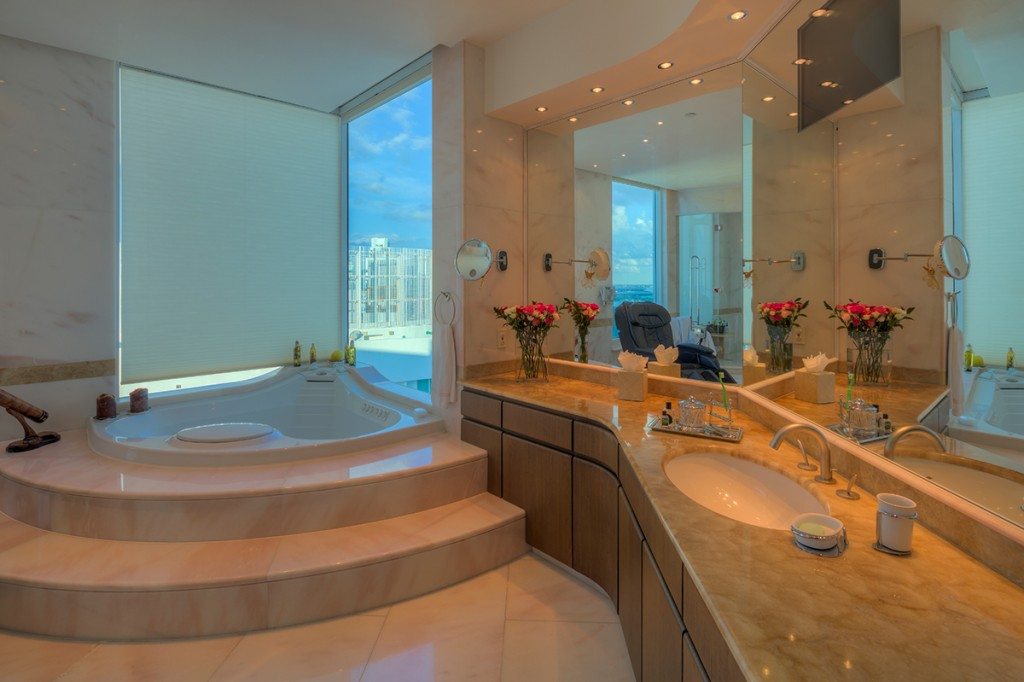
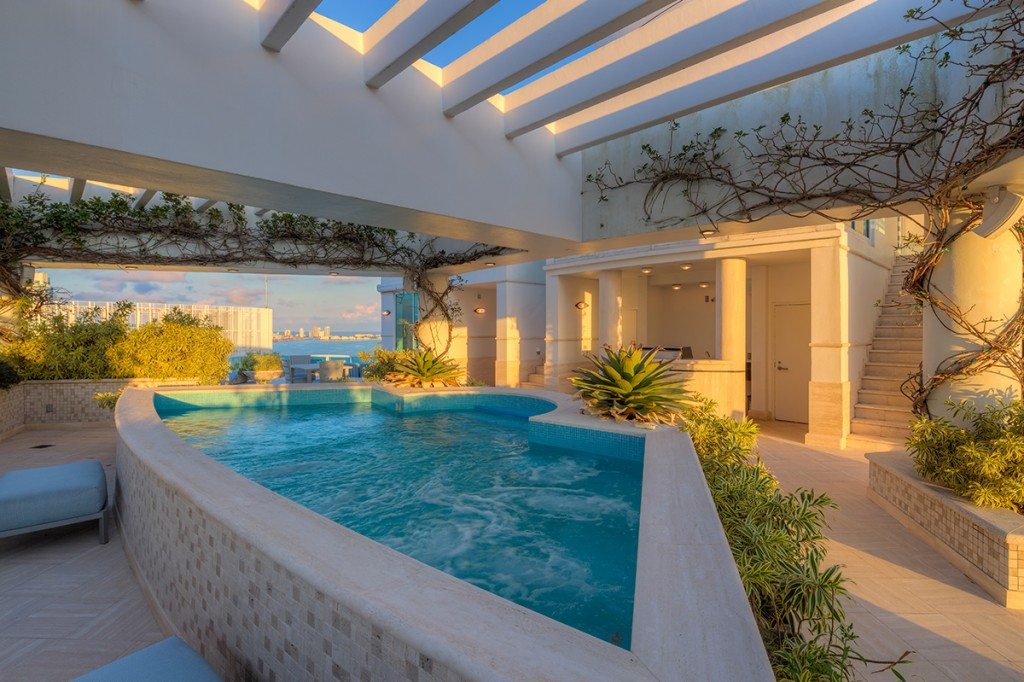
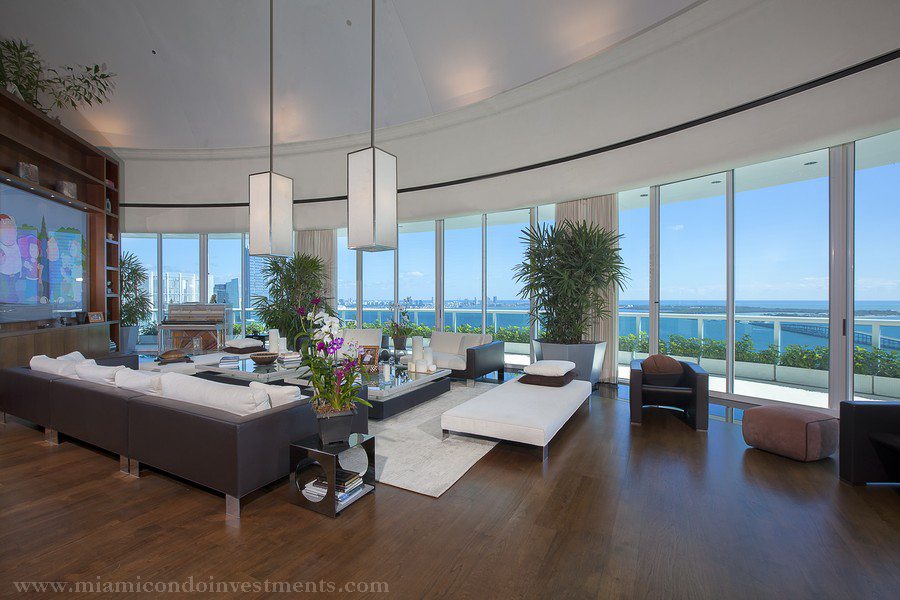
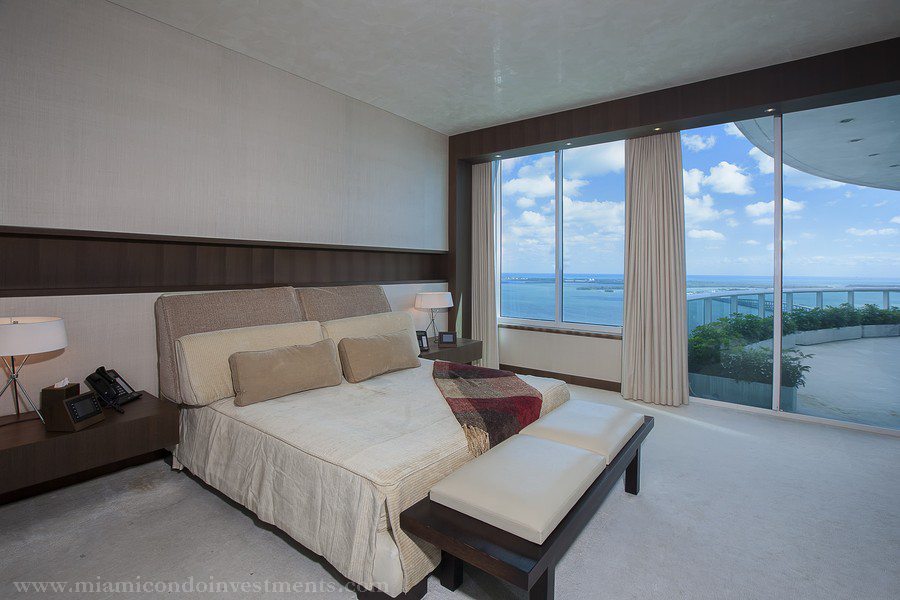
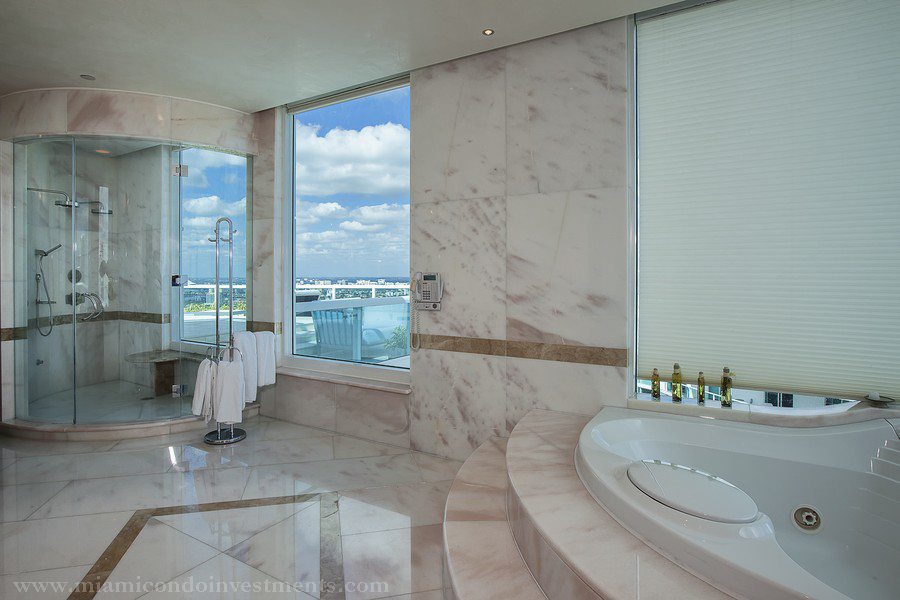
After three and a half years on the market, broker Dora Puig of Luxe Living Realty has finally sold singer Pharrell Williams’ incredible Brickell Avenue penthouse, at the Bristol Tower, for $9.25 million. Full disclosure: Miami Condo Investments is under the umbrella of Luxe Living, so go boss! We’re proud of our own, yo. The Journal just broke the story. The ten thousand square foot pad takes up the entire top of the building, with an incredible triple-height living space under the building’s massive dome. Mr. Williams had it artfully decorated with toys galore, from his many projects including Minions, and things he loved, with an obviously personal touch. It includes a home theater, five bedrooms, and a rooftop pool.
The unique design of the whole condo was obviously personal too, which is undoubtedly one reason why it took so long to sell. And yes, Pharrell did take a financial hit on the place, having purchased it for $12.525 million at the height of the last real estate bubble. But Dora did it! After an original ask of $16.8 million under another broker, a price that Curbed expressed skepticism about when I was there (Dora originally listed it for $10.9), and multiple price cuts, she clinched the sale.
Pharrell Williams’ Miami Penthouse Marked Down $5.9M
It appears that the market for Miami penthouse condos is not all sunshine and rainbows. Despite a red hot Miami luxury real estate market which has seen an array of record-breaking penthouse sales during the first half of this year (See Exhibit A, Exhibit B, Exhibit C and Exhibit D), the Bristol Tower penthouse currently owned by hip-hop sensation, Pharrell Williams, has seen its price slashed $5.9M since hitting the market this past November. Initially set at $16.8M, the tri-level mansion-in-the-sky was recently marked down to $10.9M – a whopping 35 percent price reduction!
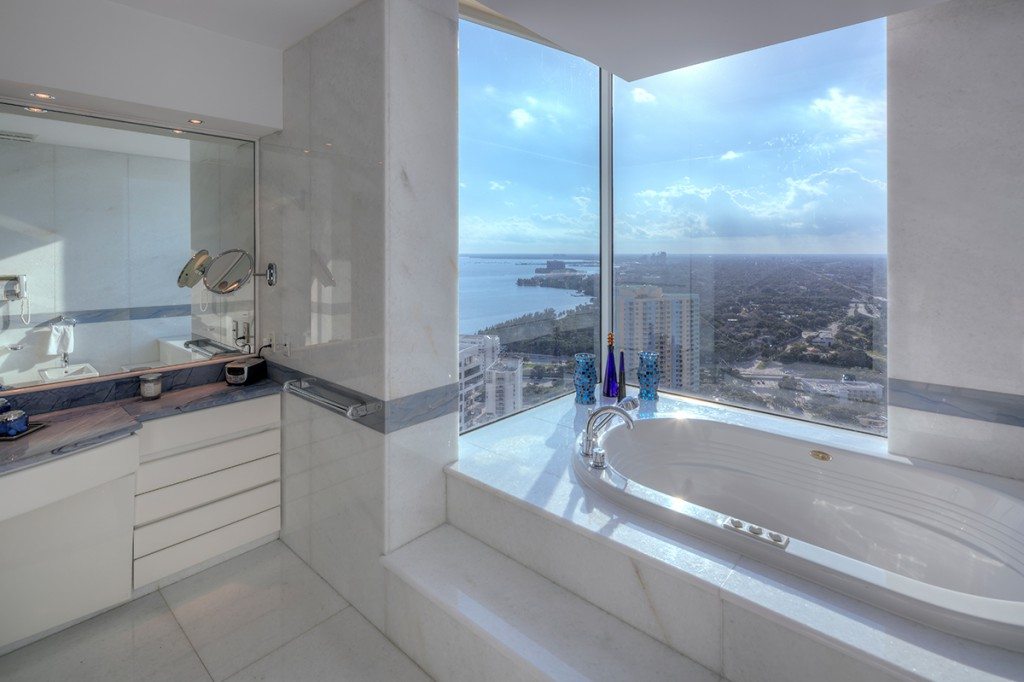
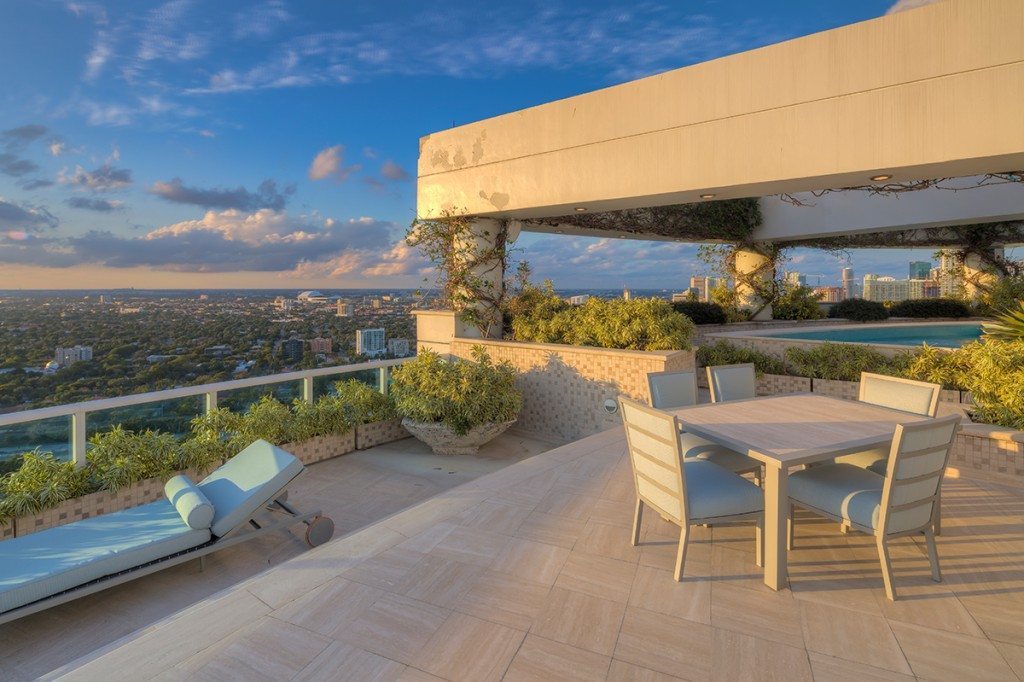
Formerly the residence of Bristol Tower developer, Ugo Colombo, the 5 bedroom, 6.5 bath penthouse features 9,080 interior square feet, private elevator entry, grand living spaces with impressive floor-to-ceiling glass walls, a 180-degree wrap-around balcony, 7 assigned parking spaces and rooftop terraces with summer kitchen, pool and Jacuzzi. The one-of-a-kind penthouse also sports a sensational view! It offers sweeping 360-degree views of Biscayne Bay, the Atlantic Ocean and sparkling city lights at night along with the opportunity to enjoy both the sunrise and sunset each day.
According to property records, Mr. Williams acquired the penthouse in March 2007 for $12,525,000.
Best Luxury 3 Bedroom Condo Deal in Brickell
“Luxury” is a word that is oftentimes used carelessly without any regard for its true, intended meaning. When it comes to Brickell, only a handful of condo developments deserve to be mentioned in the same sentence as that descriptor. In my opinion, Santa Maria is at the top of that list followed closely by Four Seasons Residences. Despite being built in 1993, Bristol Tower is a second Ugo Colombo development that would make the short list of luxury residential buildings in Brickell. It has stood the test of time and remains one of Brickell’s most distinguished condo developments. Colombo’s work is synonymous with the word “quality”. Along with Bristol Tower, he has developed such masterpieces as Santa Maria, Epic Residences and Hotel and Grovenor House. All four buildings today look just as flawless as they did the day they were completed.
That being said, luxury three bedroom condos in Brickell are in very short supply. Very few are available at the aforementioned Brickell condo developments and most are priced above $2M. There is one listing, however, that is stunning and has stuck out in my mind as being an incredible deal. It is a spacious 3 bedroom plus den, 4.5 bath residence which has 2,825 interior square feet, a large wrap-around balcony offering majestic bay and city views, a laundry room with Miele appliances, white Porcelanato floors in the living areas, wide-plank hardwood floors in the bedrooms and a white Italian kitchen with rare Quartzite green countertops as well as kitchen appliances by Miele and Sub-Zero. The condo, unit 3302, is located on the 33rd floor, just two floors below the penthouse.
The best part of this elegantly appointed three bedroom condo at Bristol Tower is its price. The sellers are asking just $1,749,000, or $619 per square foot. For comparison sake, unit 2702 at Bristol Tower sold for $1.61M, or $570 per square foot, this past December. That was a complete gut-job though and requires at least $100 per square foot to make it comparable. Obviously, unit 3302 also has a better view being that it is located six floors higher than unit 2702. Additional evidence to support my assertion that unit 3302 is a great value can be found in a second recent sale at Bristol Tower which closed on October 29, 2012. Unit 3005, a smaller three bedroom floor plan, sold for $606 per square foot. It is important to note, however, that the 05 line at Bristol Tower faces southwest and has only a slight water view. It is predominantly a city view with a sliver of water. Also, all of the bathrooms in that unit are original whereas all of the bathrooms in unit 3302 have been upgraded. After adjusting for water view and upgrades, it becomes obvious that unit 3302 is a great deal even at full asking price. My prediction is that this one will be under contract by month’s end.
Recent Luxury Condo Sales in Miami
Below are five recent luxury sales that have closed in Miami within the past 30 days. The unit at 900 Biscayne Bay marks the highest priced condo sale in the building for a non-penthouse unit.
Four Seasons Residences 49F – 3 bedroom/3.5 bath (3,795 square feet) – This condo sold for $3,025,000, or $797 per square foot, on February 17, 2011.
Four Seasons Residences 46B – 2 bedroom/2.5 bath (2,309 square feet) – This condo sold for $1,500,000, or $650 per square foot, on February 28, 2011.
Asia Brickell Key 1002 – 2 bedroom/2.5 bath (1,781 square feet) – This condo sold for $1,200,000, or $674 per square foot, on March 8, 2011.
900 Biscayne Bay 4006 – 3 bedroom/4 bath (2,335 square feet) – This condo sold for $1,100,000, or $471 per square foot, on February 28, 2011.
Bristol Tower 2101 – 3 bedroom/3.5 bath (3,065 square feet) – This condo sold for $419 per square foot, on March 11, 2011.
The Brickell Rental Market Under a Microscope
The rental market is a very interesting segment of the real estate market, not only for potential tenants on the prowl for a new pad but also current landlords and would-be investors trying to assess the demand for rentals across various neighborhoods and, more specifically, across various condo developments. Only a few years ago, the supply of rentals in Miami far outpaced demand. As a result, rental prices plunged and renters ruled the day. Fast forward to the present and an entirely different rental market is upon us in Miami. Nowadays, rental inventory is being absorbed quickly and overall rental prices are on the rise. For those living in Miami, I’m sure this a message that you have not only read in the local paper but have also heard directly from friends and family who have experienced it firsthand.
Obviously, not all neighborhoods and condo developments are created equal. Factors such as price, location, views, quality and recommendations from peers help determine rental demand. As a result, one would assume that demand can vary greatly from building to building and even neighborhood to neighborhood. Which condo developments are the leaders when it comes to rental demand and which are the laggards? More importantly, which buildings should we expect to see prices climb in the near future?
In this first segment, I decided to analyze the Brickell rental market to answer the above questions. Below, you will find a spreadsheet containing rental data for various condo developments in Brickell. Click the link below the spreadsheet to view it in its entirety.
Brickell Rental Market as of March 01, 2011
Columns C through G show the number of available rentals pertaining to each condo development grouped by number of bedrooms. Column I displays the total number of rentals available in each condo development while column J shows the total number of units within that development. I debated whether or not to include column K, the number of available rentals over the total number of units in the development expressed as a percentage, because the figure can be deceiving in buildings where developer inventory remains which has neither been sold nor rented. This is the case in buildings such as Icon Brickell and Infinity at Brickell. Regardless, I decided to include the figure because it can provide additional insight in buildings where this is not the case.
The main objective in creating this spreadsheet was to calculate months of inventory for each condo development. This can be seen in column M. Months of inventory was calculated by dividing total units available for rent by the monthly average number of units rented over a 3-month period from November 16, 2010 to February 15, 2011. You may be wondering why I did not include closed rental data from the past two weeks in determining the monthly average. I have noticed that it can take real estate agents days, and even weeks, to change the status of a rental in the MLS from pending to rented. As a result, I felt that the average would be skewed to the downside and not be an accurate representation of the Brickell rental market. Furthermore, if I had to venture a guess, I would also say that it is highly likely that around 10 percent of the total number of units available for rent are in fact no longer available. In this case, the listing agent has yet to change the status from available to pending.
Regardless, a lot can be ascertained from the spreadsheet above. In my opinion, any building with 1.5 months of inventory or less has a solid rental market. 1060 Brickell, The Plaza on Brickell and Vue at Brickell are standouts with absorption rates hovering around one month. I expect rentals prices in these developments to continue to rise in the near future. For those in the market to lease a condo in one of these developments, I advise that you act quickly and put your best foot forward when making an offer.
According to the spreadsheet, there is currently 2.29 months of rental inventory available in Brickell. Some may expect this number to increase as more units from Icon Brickell and Infinity at Brickell hit the rental market. Of course, this will all depend on how quickly the units become available and at what pace demand absorbs them. Only time will tell, but I plan to watch Brickell rental market closely and post updates on a monthly basis.
I would love to hear your thoughts and comments.
Brickell Condo Index – August 2010
The Brickell Condo Index is back! It has been a year and a half since I last published the Brickell Condo Index. Fortunately, eighteen months is a good reference point and definitely enough time where one would expect a lot to have changed with the condo market. For those of you who haven’t followed this blog that long, the Brickell Condo Index is an in-depth look at the various condo buildings in Brickell with various statistics included to illustrate the health or weakness of each building.
I hate to be the bearer of bad news but this will be the last Brickell Condo Index to appear on this blog. From here on out, the Brickell Condo Index, as well as other neighborhood indexes, will only be made available via email. Early next week, I will unveil a new version of the Miami Condo Investments website. The new website will be much easier to navigate, have a lot more content, load considerably faster and, most importantly, allow you to register to our Miami Condo Investments weekly newsletter. The weekly newsletter will contain the best condo deals of the week, relevant news stories and exclusive market data such as the neighborhood condo indexes. The neighborhood condo indexes will be emailed the Sunday following the 15th of each month, the day that I have chosen to collect and compile the data. Each neighborhood will be represented every six months as follows: Brickell this month, Brickell Key next month, Downtown Miami in October, the Edgewater in November, South Beach in December and the Miami River area in January. The cycle will then start all over so a neighborhood update is provided twice per year. In the meantime, if you’d like to be included on the newsletter list then simply send us an email at [email protected] and convey your interest to be placed on the list. The blog will not change and will continue to be updated but the market data reports will only be made available via our newsletter.
Before we get into this month’s numbers, let me discuss a few changes that I made to the Brickell Condo Index since the last update in February 2009. First, I excluded One Miami from the index. One Miami will be included in the Downtown Miami Condo Index in October. Second, Latitude on the River and Neo Vertika were also excluded. Both will appear in the Miami River Condo Index in January 2010. Third, I decided to include 1060 Brickell, 500 Brickell, Brickell on the River South and The Plaza on Brickell. Each has had enough closed resales to warrant their inclusion in the Brickell Condo Index. Fourth, I decided to bring back The Sail on Brickell. As of late, I’ve seen much more interest in the building due to its price point and it is much healthier than it was in October 2007 when I dropped it from the index. I guess you can say that it’s officially off the pink sheets. There are now a total of twenty buildings in the Brickell Condo Index whereas before there were eighteen. Last, but not least, I decided to round the price per square foot calculations. I think it makes everything easier to read and I honestly don’t think excluding the two decimal points makes the figures any less insightful.
As per the MLS, the average of the asking prices of the twenty condo buildings that now represent the Brickell Condo Index is $376 per square foot. The average asking price per square foot for each Brickell condo building individually can be found below:
1060 Brickell – 1050 & 1060 Brickell Ave – $375
500 Brickell – 500 Brickell Ave & 55 SE 6 St – $362
Atlantis on Brickell – 2025 Brickell Ave – $255
Brickell on the River North – 31 SE 5 St – $268
Brickell on the River South – 41 SE 5 St – $276
Bristol Tower – 2127 Brickell Ave – $471
Emerald at Brickell – 218 SE 14 St – $348
Four Seasons Residences – 1425 Brickell Ave – $954
Imperial at Brickell – 1627 Brickell Ave – $285
Jade Brickell – 1331 Brickell Bay Dr – $532
Santa Maria – 1643 Brickell Ave – $691
Skyline on Brickell – 2101 Brickell Ave – $352
Solaris at Brickell – 186 SE 12 Ter – $189
The Club at Brickell Bay – 1200 Brickell Bay Dr – $285
The Mark on Brickell – 1155 Brickell Bay Dr – $313
The Palace – 1541 Brickell Ave – $298
The Plaza on Brickell – 951 Brickell Ave & 950 Brickell Bay Dr – $394
The Sail on Brickell – 170 SE 14 St – $299
Villa Regina – 1581 Brickell Ave – $350
Vue at Brickell – 1250 S Miami Ave – $214
At the bottom of this post, I included a chart that shows how each of the above figures compares with those published in February 2009. Solaris at Brickell experienced the largest drop with average asking prices there falling slightly over 40 percent. Three of the buildings saw a slight increase in their average asking price per square foot within the past eighteen months. These were Bristol Tower, Four Seasons Residences and Villa Regina.
Below, you’ll find the average price per square foot for Brickell condos sold in the MLS within the six month period from February 1, 2010 to July 31, 2010. I decided to do it this way because I’ve noted that oftentimes it takes agents a few weeks to change the status of a listing in the MLS from pending to closed. The neighborhood as a whole sold at an average price per square foot of $285 during that time period.
The biggest surprise in the figures above when compared to those in February 2009 is Jade Brickell. The average price per square foot for closed sales during the previous six months increased a little over 14 percent when compared to the figures published eighteen months ago. Other buildings that experienced an increase are Skyline on Brickell, The Mark on Brickell, Villa Regina and Vue at Brickell. With the exception of Villa Regina, these buildings were some of the hardest hit in Brickell when the market collapsed mainly due to the large amount of mortgage fraud that took place in these buildings. The Club at Brickell Bay and Solaris at Brickell are two other buildings in Brickell that were heavily victimized by mortgage fraud. The Club at Brickell Bay saw about a 1 percent decrease in average closed sales prices while prices at Solaris at Brickell fell slightly over 9 percent. This actually makes sense since the fallout at Solaris at Brickell didn’t take place until about a year after the others. Also worth mentioning, prices at Santa Maria fell a little over 4 percent within the past eighteen months but the numbers were a bit skewed due to Penthouse 4901 recently selling for $1,100 per square foot. The average for the past six months would have been much lower had it not been for that sale.
Below you will find some additional statistics. Click on the image to enlarge it.
The first column to the right of each condo development name is the difference in the average sales price and list price for this month, expressed as a percentage. A high percentage indicates that there is a large discrepancy between the average asking price for condos currently on the market and what has actually sold within the past six months. In other words, many of the sellers in these buildings are delusional and are in need of a reality check. For example, 1060 Brickell has a very large discrepancy because there are quite a few units asking over $400 per square foot and even some asking over $560 per square foot while closed sales have averaged around $208 per square foot within the past six months.
The second column shows the number of active listings currently in the MLS for each condo development. The third column shows the percentage that these listings represent over the total number of condo units in each development. The cells highlighted in green reveal those condo developments that have active listings that that represent less than 10 percent of the overall units in the building. This is typically one indication of a sound condo building. When I first started doing the Brickell Condo Index in 2007 many of the cells in this column were highlighted in red, indicating that active listings represented over 20 percent of the building. This was always a good indication that prices would fall further in these buildings. For example, in February 2009, active listings at Solaris at Brickell represented slightly over 20 percent of the building. That was the largest percentage of listings at that time and it is not a coincidence that eighteen months later prices fell the most at Solaris at Brickell of all the buildings represented in the Brickell Condo Index.
The fourth column reveals the number of condos currently pending sale in each building. The Club at Brickell Bay has a whopping 42 pending sales at this time and there are a total of 155 pending sales in all of the buildings combined. In February 2009, there were only 81 pending sales although a total of twenty buildings are now present in the Brickell Condo Index rather than eighteen. The fifth column displays the number of closed sales from February 1, 2010 to July 31, 2010. Once again, The Club at Brickell Bay leads the way with a total of 38 closed sales in that time period. It’s interesting to note that there were 20 more closed sales in the six months prior to February 2009 when compared to the current closing numbers even though the index now has two additional buildings.
The sixth column shows the difference in the average list prices from this month’s and February 2009’s, expressed as a percentage. Those highlighted in red reveal those condo developments which had a drop in their average list price while those highlighted in green show those that experienced an increase.
The seventh column reveals the difference in average sales prices from this month’s and February 2009’s, expressed a percentage. Once again, those highlighted in green represent an increase while those highlighted in red represent a decrease.
Well, that’s all for today. Have fun with the numbers. Time for me to get back to work on the new website.
Brickell & Brickell Key Closed Condo Sales – November 2009
Click on the links below to view the condo sales in Brickell and Brickell Key closed in November 2009:
Brickell Closed Condo Sales – November 2009 – There were 30 closed condo sales in Brickell last month. The average sales price of these condos was $243 per square foot. I was surprised to see that a one bedroom condo at Skyline on Brickell sold for $334 per square foot.
Brickell Key Closed Condo Sales – November 2009 – 10 condos in Brickell Key closed last month. These sold at an average sales price per square foot of $258. Here I was shocked to see that someone would be willing to pay $294 per square foot for a unit at Isola, especially one with carpeting.
Brickell Condo Index – February 2009
A lot has changed since I last published the Brickell Condo Index three months ago. Condo foreclosures have continued to hit the market, financing has become extremely difficult to obtain and a few bulk condo deals have closed in that time. As a result, it should come as to no surprise that overall condo prices have continued to drop throughout Brickell within the past 3 months. The data used to compile the statistics below was collected on February 18, 2008 from the MLS. You may want to compare the following figures to those published three months ago in November 2008. Also, be sure to view the charts towards the bottom of this post to see how much Brickell condo prices have changed within the past 15 months.
The average asking prices of the 18 condo developments that comprise the Brickell Condo Index is currently $401.30 per square foot. This represents a 6.57 percent drop in average list prices over the past three months.
Average price per square foot of Brickell condos currently listed on the MLS:
The average price of Brickell condos sold over the past six months has gone up 1.51 percent to $296.00 per square foot from November’s average of $291.59. However, this is due to the fact that Four Seasons Residences had been excluded from the average in November due to no closings occurring within the previous six months. Four Seasons Residences has been reincluded in this month’s index as a result of a condo closing in December 2008. The average for Brickell condos sold over the past six months would have dropped 3.58 percent had it not been re-included. With the exception of Bristol Tower, average sales prices for each of the other Brickell condo developments dropped since the November update.
Average price per square foot of Brickell condos sold in the MLS within the past six months:
Atlantis – 2025 Brickell Ave | 33129 | $228.95
Brickell on the River – 31 SE 5 St | 33131 | $234.18
Solaris at Brickell – 186 SE 12 Ter | 33131 | $201.59
The Club at Brickell Bay – 1200 Brickell Bay Dr | 33131 | $188.28
The Mark on Brickell – 1155 Brickell Bay Dr | 33131 | $228.61
The Palace – 1541 Brickell Ave | 33129 | N/A
Villa Regina – 1581 Brickell Ave | 33129 | $256.71
Vue at Brickell – 1250 S Miami Ave | 33131 | $147.18
Below you will find some additional statistics. Click on the image to enlarge it.
The first column to the right of each condo development’s name is the difference in the average sales price and list price for this month, expressed as a percentage. An “N/A” is found next to Latitude on the River and The Palace since this percentage could not be computed as each building failed to have a closed sale within the past six months through the MLS. A high percentage indicates that there is a large discrepancy between the average asking price for condos currently on the market and what has actually sold within the past six months.
The second column is the number of active listings in each condo development currently in the MLS. The third column shows the percentage that these listings represent over the total number of condo units in each development. The cells highlighted in green reveal those condo developments that have active listings that represent less than 10 percent of the the overall units in the building. This is typically one indication of a sound condo building. Bristol Tower, Four Seasons Residences, Imperial at Brickell, Latitude on the River, The Palace and Villa Regina are the condo buildings highlighted in green. However, I think it’s too soon to use this rule of thumb for Latitude on the River. It’s too new of a development. Short-sales and foreclosures have just started to hit the market there. The ones highlighted in red reveal those condo developments that have active listings that represent over 20 percent of the overall units. There’s definitely underlying risk in buying in these condo developments and I’d only advise buying in one of these if the price justifies the risk. As in the November update, Solaris at Brickell is the only condo developments highlighted in red. This is usually a good indication that prices will fall further in future months.
The fourth column shows the number of condos currently pending sale. There are currently a total of 81 pending sales in the 18 condo buildings represented in the Brickell Condo Index. I did not include pending sales that went pending before November 1, 2008. The fifth column displays the number of closed condo sales within the past six months. The 18 Brickell condo developments have had a total of 198 condos close within that time frame. The vast majority of these closings occurred in just a handful of the condo developments. Latitude on the River and The Palace were the only two condo buildings that haven’t had a condo close within the past six months.
The sixth column shows the difference in the average list prices from this month’s and November’s, expressed as a percentage. Those highlighted in red reveal those condo developments which had a drop in their average list price while those highlighted in green show those that showed an increase. Bristol Tower was the only condo development that had an increase in asking prices since November. In just three month’s time, average asking prices fell about 15 percent at Imperial at Brickell and Solaris at Brickell, 14 percent at Vue at Brickell and 10 percent at Brickell on the River.
The seventh column reveals the difference in average sales prices from this month’s and November’s, expressed as a percentage. The Mark on Brickell saw the largest drop with a 20.95 percent decline. Brickell on the River, Emerald at Brickell, Imperial at Brickell and One Miami also had double digits drops. Average sales prices at Santa Maria increased about 14 percent but it should be noted that only one closed sale occurred within the past six months.
I thought it would be interesting to see how prices compare now to those we saw a year ago. Unfortunately, I didn’t publish a Brickell Condo Index 12 months ago. However, I used data from the November 2007 Brickell Condo Index to create the charts below to compare current prices to those we saw 15 months ago. Click on the images below to enlarge them.
(Below) Percentage Change in Average $/SqFt of List Prices Within 15 Months:
(Below) Percentage Change in Average $/SqFt of Sales Prices Within the Last 15 Months:
Keep in mind that condo prices in Miami peaked around the beginning of 2006. The graphs above would be all the more shocking if we were to cross compare current prices to those we saw at that time. By November 2007, Miami condo prices had already fallen significantly.
One positive thing to note is that the number of condos on the market in the condo buildings comprised in the Brickell Condo Index is down about 26 percent since November 2007. (This excludes Latitude on the River which had not been included in the Brickell Condo Index at that time.) Emerald at Brickell and Santa Maria are the only condo developments in the Brickell Condo Index that now have more condos listed than in November 2007. To put this into perspective, the number of listed condos at Vue at Brickell 15 months ago represented a little over 24 percent of the total condos in the building. Current inventory at Vue at Brickell represents slightly more than 13 percent.