The rental market is a very interesting segment of the real estate market, not only for potential tenants on the prowl for a new pad but also current landlords and would-be investors trying to assess the demand for rentals across various neighborhoods and, more specifically, across various condo developments. Only a few years ago, the supply of rentals in Miami far outpaced demand. As a result, rental prices plunged and renters ruled the day. Fast forward to the present and an entirely different rental market is upon us in Miami. Nowadays, rental inventory is being absorbed quickly and overall rental prices are on the rise. For those living in Miami, I’m sure this a message that you have not only read in the local paper but have also heard directly from friends and family who have experienced it firsthand.
Obviously, not all neighborhoods and condo developments are created equal. Factors such as price, location, views, quality and recommendations from peers help determine rental demand. As a result, one would assume that demand can vary greatly from building to building and even neighborhood to neighborhood. Which condo developments are the leaders when it comes to rental demand and which are the laggards? More importantly, which buildings should we expect to see prices climb in the near future?
In this first segment, I decided to analyze the Brickell rental market to answer the above questions. Below, you will find a spreadsheet containing rental data for various condo developments in Brickell. Click the link below the spreadsheet to view it in its entirety.
Brickell Rental Market as of March 01, 2011
Columns C through G show the number of available rentals pertaining to each condo development grouped by number of bedrooms. Column I displays the total number of rentals available in each condo development while column J shows the total number of units within that development. I debated whether or not to include column K, the number of available rentals over the total number of units in the development expressed as a percentage, because the figure can be deceiving in buildings where developer inventory remains which has neither been sold nor rented. This is the case in buildings such as Icon Brickell and Infinity at Brickell. Regardless, I decided to include the figure because it can provide additional insight in buildings where this is not the case.
The main objective in creating this spreadsheet was to calculate months of inventory for each condo development. This can be seen in column M. Months of inventory was calculated by dividing total units available for rent by the monthly average number of units rented over a 3-month period from November 16, 2010 to February 15, 2011. You may be wondering why I did not include closed rental data from the past two weeks in determining the monthly average. I have noticed that it can take real estate agents days, and even weeks, to change the status of a rental in the MLS from pending to rented. As a result, I felt that the average would be skewed to the downside and not be an accurate representation of the Brickell rental market. Furthermore, if I had to venture a guess, I would also say that it is highly likely that around 10 percent of the total number of units available for rent are in fact no longer available. In this case, the listing agent has yet to change the status from available to pending.
Regardless, a lot can be ascertained from the spreadsheet above. In my opinion, any building with 1.5 months of inventory or less has a solid rental market. 1060 Brickell, The Plaza on Brickell and Vue at Brickell are standouts with absorption rates hovering around one month. I expect rentals prices in these developments to continue to rise in the near future. For those in the market to lease a condo in one of these developments, I advise that you act quickly and put your best foot forward when making an offer.
According to the spreadsheet, there is currently 2.29 months of rental inventory available in Brickell. Some may expect this number to increase as more units from Icon Brickell and Infinity at Brickell hit the rental market. Of course, this will all depend on how quickly the units become available and at what pace demand absorbs them. Only time will tell, but I plan to watch Brickell rental market closely and post updates on a monthly basis.
I would love to hear your thoughts and comments.
Brickell Condo Index – August 2010
The Brickell Condo Index is back! It has been a year and a half since I last published the Brickell Condo Index. Fortunately, eighteen months is a good reference point and definitely enough time where one would expect a lot to have changed with the condo market. For those of you who haven’t followed this blog that long, the Brickell Condo Index is an in-depth look at the various condo buildings in Brickell with various statistics included to illustrate the health or weakness of each building.
I hate to be the bearer of bad news but this will be the last Brickell Condo Index to appear on this blog. From here on out, the Brickell Condo Index, as well as other neighborhood indexes, will only be made available via email. Early next week, I will unveil a new version of the Miami Condo Investments website. The new website will be much easier to navigate, have a lot more content, load considerably faster and, most importantly, allow you to register to our Miami Condo Investments weekly newsletter. The weekly newsletter will contain the best condo deals of the week, relevant news stories and exclusive market data such as the neighborhood condo indexes. The neighborhood condo indexes will be emailed the Sunday following the 15th of each month, the day that I have chosen to collect and compile the data. Each neighborhood will be represented every six months as follows: Brickell this month, Brickell Key next month, Downtown Miami in October, the Edgewater in November, South Beach in December and the Miami River area in January. The cycle will then start all over so a neighborhood update is provided twice per year. In the meantime, if you’d like to be included on the newsletter list then simply send us an email at [email protected] and convey your interest to be placed on the list. The blog will not change and will continue to be updated but the market data reports will only be made available via our newsletter.
Before we get into this month’s numbers, let me discuss a few changes that I made to the Brickell Condo Index since the last update in February 2009. First, I excluded One Miami from the index. One Miami will be included in the Downtown Miami Condo Index in October. Second, Latitude on the River and Neo Vertika were also excluded. Both will appear in the Miami River Condo Index in January 2010. Third, I decided to include 1060 Brickell, 500 Brickell, Brickell on the River South and The Plaza on Brickell. Each has had enough closed resales to warrant their inclusion in the Brickell Condo Index. Fourth, I decided to bring back The Sail on Brickell. As of late, I’ve seen much more interest in the building due to its price point and it is much healthier than it was in October 2007 when I dropped it from the index. I guess you can say that it’s officially off the pink sheets. There are now a total of twenty buildings in the Brickell Condo Index whereas before there were eighteen. Last, but not least, I decided to round the price per square foot calculations. I think it makes everything easier to read and I honestly don’t think excluding the two decimal points makes the figures any less insightful.
As per the MLS, the average of the asking prices of the twenty condo buildings that now represent the Brickell Condo Index is $376 per square foot. The average asking price per square foot for each Brickell condo building individually can be found below:
1060 Brickell – 1050 & 1060 Brickell Ave – $375
500 Brickell – 500 Brickell Ave & 55 SE 6 St – $362
Atlantis on Brickell – 2025 Brickell Ave – $255
Brickell on the River North – 31 SE 5 St – $268
Brickell on the River South – 41 SE 5 St – $276
Bristol Tower – 2127 Brickell Ave – $471
Emerald at Brickell – 218 SE 14 St – $348
Four Seasons Residences – 1425 Brickell Ave – $954
Imperial at Brickell – 1627 Brickell Ave – $285
Jade Brickell – 1331 Brickell Bay Dr – $532
Santa Maria – 1643 Brickell Ave – $691
Skyline on Brickell – 2101 Brickell Ave – $352
Solaris at Brickell – 186 SE 12 Ter – $189
The Club at Brickell Bay – 1200 Brickell Bay Dr – $285
The Mark on Brickell – 1155 Brickell Bay Dr – $313
The Palace – 1541 Brickell Ave – $298
The Plaza on Brickell – 951 Brickell Ave & 950 Brickell Bay Dr – $394
The Sail on Brickell – 170 SE 14 St – $299
Villa Regina – 1581 Brickell Ave – $350
Vue at Brickell – 1250 S Miami Ave – $214
At the bottom of this post, I included a chart that shows how each of the above figures compares with those published in February 2009. Solaris at Brickell experienced the largest drop with average asking prices there falling slightly over 40 percent. Three of the buildings saw a slight increase in their average asking price per square foot within the past eighteen months. These were Bristol Tower, Four Seasons Residences and Villa Regina.
Below, you’ll find the average price per square foot for Brickell condos sold in the MLS within the six month period from February 1, 2010 to July 31, 2010. I decided to do it this way because I’ve noted that oftentimes it takes agents a few weeks to change the status of a listing in the MLS from pending to closed. The neighborhood as a whole sold at an average price per square foot of $285 during that time period.
The biggest surprise in the figures above when compared to those in February 2009 is Jade Brickell. The average price per square foot for closed sales during the previous six months increased a little over 14 percent when compared to the figures published eighteen months ago. Other buildings that experienced an increase are Skyline on Brickell, The Mark on Brickell, Villa Regina and Vue at Brickell. With the exception of Villa Regina, these buildings were some of the hardest hit in Brickell when the market collapsed mainly due to the large amount of mortgage fraud that took place in these buildings. The Club at Brickell Bay and Solaris at Brickell are two other buildings in Brickell that were heavily victimized by mortgage fraud. The Club at Brickell Bay saw about a 1 percent decrease in average closed sales prices while prices at Solaris at Brickell fell slightly over 9 percent. This actually makes sense since the fallout at Solaris at Brickell didn’t take place until about a year after the others. Also worth mentioning, prices at Santa Maria fell a little over 4 percent within the past eighteen months but the numbers were a bit skewed due to Penthouse 4901 recently selling for $1,100 per square foot. The average for the past six months would have been much lower had it not been for that sale.
Below you will find some additional statistics. Click on the image to enlarge it.
The first column to the right of each condo development name is the difference in the average sales price and list price for this month, expressed as a percentage. A high percentage indicates that there is a large discrepancy between the average asking price for condos currently on the market and what has actually sold within the past six months. In other words, many of the sellers in these buildings are delusional and are in need of a reality check. For example, 1060 Brickell has a very large discrepancy because there are quite a few units asking over $400 per square foot and even some asking over $560 per square foot while closed sales have averaged around $208 per square foot within the past six months.
The second column shows the number of active listings currently in the MLS for each condo development. The third column shows the percentage that these listings represent over the total number of condo units in each development. The cells highlighted in green reveal those condo developments that have active listings that that represent less than 10 percent of the overall units in the building. This is typically one indication of a sound condo building. When I first started doing the Brickell Condo Index in 2007 many of the cells in this column were highlighted in red, indicating that active listings represented over 20 percent of the building. This was always a good indication that prices would fall further in these buildings. For example, in February 2009, active listings at Solaris at Brickell represented slightly over 20 percent of the building. That was the largest percentage of listings at that time and it is not a coincidence that eighteen months later prices fell the most at Solaris at Brickell of all the buildings represented in the Brickell Condo Index.
The fourth column reveals the number of condos currently pending sale in each building. The Club at Brickell Bay has a whopping 42 pending sales at this time and there are a total of 155 pending sales in all of the buildings combined. In February 2009, there were only 81 pending sales although a total of twenty buildings are now present in the Brickell Condo Index rather than eighteen. The fifth column displays the number of closed sales from February 1, 2010 to July 31, 2010. Once again, The Club at Brickell Bay leads the way with a total of 38 closed sales in that time period. It’s interesting to note that there were 20 more closed sales in the six months prior to February 2009 when compared to the current closing numbers even though the index now has two additional buildings.
The sixth column shows the difference in the average list prices from this month’s and February 2009’s, expressed as a percentage. Those highlighted in red reveal those condo developments which had a drop in their average list price while those highlighted in green show those that experienced an increase.
The seventh column reveals the difference in average sales prices from this month’s and February 2009’s, expressed a percentage. Once again, those highlighted in green represent an increase while those highlighted in red represent a decrease.
Well, that’s all for today. Have fun with the numbers. Time for me to get back to work on the new website.
Lobby Makeover Planned at The Club at Brickell Bay
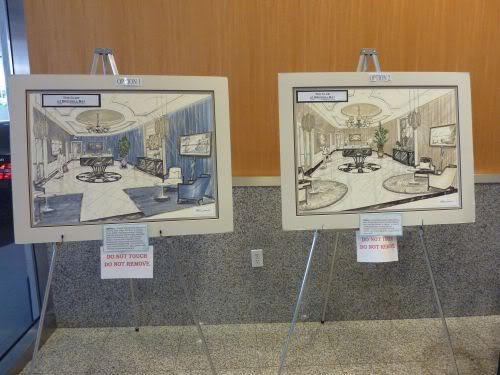
Late last week, I showed a few condos at The Club at Brickell Bay to a client. On our way out, I noticed a pair of poster boards alongside a voting box in the lobby. The voting box urged condo owners to vote for one of two plans to renovate the building lobby with the following descriptions below each option:
Option 1: A royal blue scheme, referencing existing color tones, but done in a much more opulent and sophisticated manner, with new porcelain tile flooring, area rugs below new seating areas, wall covering, drapery feature wall treatment (while keeping the window wall unobstructed), reception/concierge desk, central feature table, ceiling treatments, light fixtures and artwork/accessories/greenery
Option 2: A neutral champagne scheme that is a more distinct color departure from the existing blue, but nearly identical to Option 1 in terms of architectural design treatment with the exception of a mirror installed in place of artwork, and circular rugs in lieu of square at the seating areas
The best news of all is that I heard that there’s enough money in the budget to undertake such a project. Maintenance fees will not increase as a result of the renovation project nor will a special assessment be levied. Looks like the building has come a long way since management was replaced a few years ago. I remember the days when The Club at Brickell Bay had difficulties paying its own operating expenses.
Shrinking Rental Inventory in Brickell and Downtown
In this episode, we discuss the shrinking rental inventory of condos in Brickell and Downtown Miami. In recent months, it has become increasingly more difficult to find a rental in these neighborhoods than it has since the peak of the market. For example, at this time The Plaza on Brickell, which has 1,000 total units, only has two unfurnished one bedrooms available while 1060 Brickell has zero. We highlight eight other well known condo buildings in these areas and provide an overview of the rental availability within them.
Miami Real Estate Review – Episode 7
In this episode, we provide an update regarding the developer blowout sale at The Plaza on Brickell that started last Thursday. We also touch upon pricing at Icon Brickell and discuss news regarding Marquis. We end the show by highlighting four noteworthy foreclosures that came onto the market since last Friday.
Top 5 Distressed Condo Sales Closed in January 2010
Below, you will find what I believe to be the five best condo deals of the 66 distressed sales that closed in January 2010 in the MLS located in Brickell, Brickell Key, Downtown Miami and the Arts District.
Ten Museum Park #1905 – 1 bedroom/1.5 bath (791 square feet) – This unit sold for $137,000, or $173 per square foot, on January 11, 2010. Short Sale
Neo Vertika #PH226 – 1 bedroom/2 bath (1,155 square feet) – This unit sold for $158,000, or $137 per square foot, on January 11, 2010. Foreclosure
Parc Lofts #206 – 2 bedroom/1 bath (1,267 square feet) – This unit sold for $122,000, or $96 per square foot, on January 8, 2010. Foreclosure
The Club at Brickell Bay #1506 – 1 bedroom/1 bath (825 square feet) – This unit sold for $108,000, or $131 per square foot, on January 15, 2010. Foreclosure
Solaris at Brickell #806 – 1 bedroom/1 bath (754 square feet) – This unit sold for $120,000 or $159 per square foot, on January 29, 2010. Foreclosure
Special Approval Designation List for Miami-Dade Condo Developments
Below, you will find a list of condo developments in Miami-Dade County that have already received the special approval designation by Fannie Mae. The following are some of the larger and more widely recognized buildings. Lenders will now be able to originate and deliver mortgage loans to Fannie Mae in these condo developments.
Brickell & Brickell Key Closed Condo Sales – November 2009
Click on the links below to view the condo sales in Brickell and Brickell Key closed in November 2009:
Brickell Closed Condo Sales – November 2009 – There were 30 closed condo sales in Brickell last month. The average sales price of these condos was $243 per square foot. I was surprised to see that a one bedroom condo at Skyline on Brickell sold for $334 per square foot.
Brickell Key Closed Condo Sales – November 2009 – 10 condos in Brickell Key closed last month. These sold at an average sales price per square foot of $258. Here I was shocked to see that someone would be willing to pay $294 per square foot for a unit at Isola, especially one with carpeting.
Recently Listed Condo REOs in Miami – August 2009
Earlier this evening, I did a search for condo foreclosures in Miami for a client. 9 condos recently listed caught my attention.
Santa Maria #2506 – 2 bedroom/2.5 bath (2,100 square feet of interior) – Asking $899,900, or $429 per square foot – 24 days on the market
Jade Brickell #1201 – 2 bedroom/2.5 bath (1,878 square feet of interior) – Asking $667,900, or $356 per square foot – less than 2 hours on the market
Carbonell #1805 – 2 bedroom/2.5 bath (1,505 square feet of interior) – Asking $525,000, or $349 per square foot – 8 days on the market
Four Seasons Hotel #3203 – 1 bedroom/1.5 bath (983 square feet of interior) – Asking $460,000, or $468 per square foot – 7 days on the market
Emerald at Brickell #1101 – 2 bedroom/2.5 bath (1,594 square feet of interior) – Asking $364,900, or $229 per square foot – 3 days on the market
Blue Condo #1701 – 2 bedroom/2.5 bath (1,449 square feet of interior) – Asking $208,395, or $144 per square foot – 7 days on the market
50 Biscayne #4705 – 1 bedroom/1 bath (845 square feet of interior) – Asking $179,900, or $213 per square foot – 3 days on the market
The Club at Brickell Bay #4304 – 1 bedroom/1 bath (825 square feet of interior) – Asking $119,900, or $145 per square foot – 8 days on the market
1800 Biscayne Plaza #1203 – 2 bedroom/2 bath (1,040 square feet of interior) – Asking $117,590, or $113 per square foot – 8 days on the market