Incredible Buy on a 1 Bedroom at The Grand – $299K
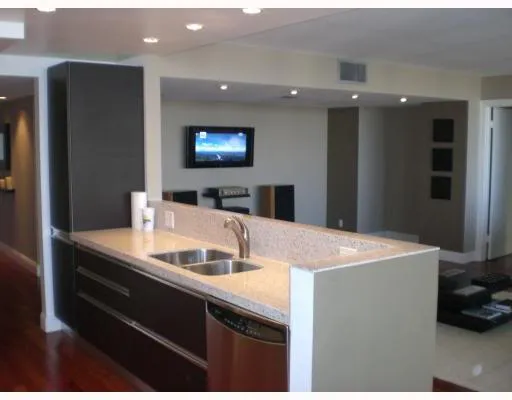

I just came across a one bedroom/one bath listing at The Grand that looks to be incredibly well priced. It has 1,180 square feet of interior space. It is listed for $299,000, or $253 per square foot. There are a few other one bedrooms in the building that are listed for slightly less but none of them come even close to having the level of quality that was put into this unit.

This is a perfect condo for somebody in search of a spacious one bedroom that is in impeccable condition for under $300K. You won’t find this type of space in a one bedroom in most of the new buildings.

Take a look at the MLS listing for more information and pictures. You can call me for additional details as well or if you’d like me to schedule you a showing.

Miami Condo Index – Brickell Key – November 2007
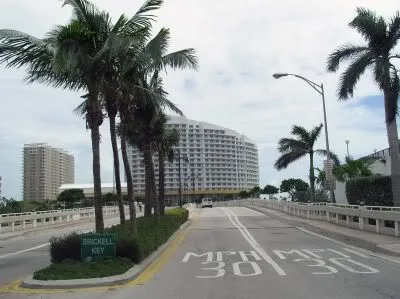

The average price per square foot of condos listed in Brickell Key has gone down once again, as it has every month since I began this index. The average price per square foot of the ten condos, which represent the Brickell Key Condo Index, fell to $494.61 this month from last month’s figure of $501.55. The weight-adjusted average also fell to $490.87 per square foot versus last month’s weight-adjusted average of $497.82.
Average price per square foot of Brickell Key condos currently listed on the MLS:

This is the first month since I began the Brickell Key Condo Index that the average price per square foot of condos sold over the previous six months has gone up. The average price per square foot of condos sold within the last six months increased to $435.21 from last month’s average of $430.08. The weight-adjusted average also increased to $433.31 from last month’s weight-adjusted average of $424.57. Most of this is attributed to the lack of closed sales at Brickell Key Two. A closed sale of $375 per square foot at Brickell Key Two fell off the average and was replaced by a new closed sale within the past month at $446 per square foot. One closed sale within the past six months encompassed the average in October and November. As I said, the lack of closed sales is to blame.
- Brickell Key One – 520 Brickell Key Drive | 33131 | $308.28
- Brickell Key Two – 540 Brickell Key Drive | 33131 | $445.83
- Carbonell – 901 Brickell Key Drive | 33131 | $535.63
- Courts Brickell Key – 801 Brickell Key Drive | 33131 | $435.03
- Courvoisier Courts – 701 Brickell Key Drive | 33131 | $424.63
- Isola – 770 Claughton Island Drive | 33131 | $440.14
- One Tequesta Point – 888 Brickell Key Drive | 33131 | $407.77
- St. Louis – 800 Claughton Island Drive | 33131 | $442.40
- Three Tequesta Point – 848 Brickell Key Drive | 33131 | $461.58
- Two Tequesta Point – 808 Brickell Key Drive | 33131 | $450.84

Additional statistics can be found in the chart below:

There have been a total of 6 closed sales within the past month which is much better than the pathetic 2 closings revealed in last month’s update. These 6 closings, however, were highly concentrated with 4 of the 6 closings residing at Carbonell. Pending sales have inched up to 18 from last month’s 16 pending sales.
Closings to Begin at Opera Tower Very Soon

Word reached me tonight that the crown top at Opera Tower has been illuminated. I have also been informed that the swimming pool and hot tubs have been filled. Opera Tower is located in Miami’s up-and-coming Edgewater neighborhood.
This suggests to me that closings at Opera Tower will begin very soon, although closings were originally scheduled for September. However, when I drove by Opera Tower this past week, the street-level commercial spaces still looked to be at least one month away from being finished.
I’m not a fan of this development. I’ve made it known in a previous post that I think that this development will have a high default rate for various reasons that are disclosed in that post. I think it is likely that we will see a majority of these condos owned by the bank that loaned money to the developer of Opera Tower by April 2008.
What do I know though? I’m no real estate oracle.
Brickell Condo Index – November 2007
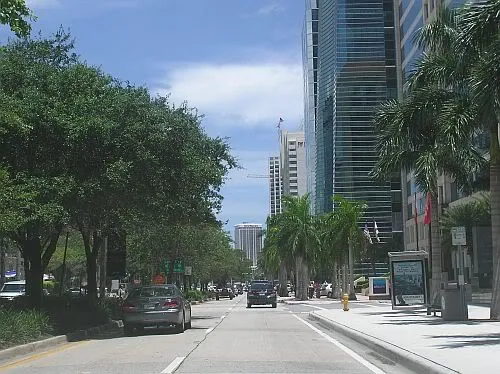

The following data was collected on November 18, 2007. It took me a while to get everything up due to the holiday and work. I made a correction to October’s data. The average price per square foot of closed sales over the previous six months at Vue at Brickell was previously stated at $364.32. The correct figure should have been $469.93. The correction has been made and the overall average for closed sales in Brickell was adjusted to $481.69 instead of $475.16.
The average price per square foot of condos listed has once again dropped this month to $512.14 from last month’s figure of $518.91. The weight-adjusted average also dropped to $509.24 per square foot from last month’s figure of $521.29.
Average price per square foot of units currently listed on the MLS:

Someone recently commented that the average price per square foot of closed sales statistic doesn’t provide much insight due to the lack of activity in the Miami real estate market. This is quite true. List prices need to come down more in order for buyers to be enticed into buying. The condos that have been selling lately are the ones that are aggressively priced. Once each building has at least 5 or more closed sales then the average will begin to show more insight. Below you will see the total number of closings within the past six months in each condo development:

As you can see all of the buildings except One Miami and Neo Vertika have 4 or less closings. The lack of closed sales doesn’t make for an informative average. Nonetheless, I will continue to provide this statistic in hopes that the peak-season months will bring in more closed sales. I have definitely seen more interest within the past couple of weeks. The average price of condos sold over the past six months has gone down to $472.80 from last month’s figure of $481.69. Emerald at Brickell hasn’t had any closed sales within the past six months. The drop would have been less if the average for Emerald at Brickell would have remained the same at $523.78. If that were the case then the average price of condos sold over the past six months in Brickell would have been $475.80.
Average price per square foot of condos sold in the MLS within the past six months:
- Atlantis – 2025 Brickell Ave | 33129 | $283.10
- Brickell on the River – 31 SE 5 St | 33131 | $400.00
- Bristol Tower – 2127 Brickell Ave | 33129 | $425.96
- Emerald at Brickell – 218 SE 14 St | 33131 | N/A
- Four Seasons Residences – 1425 Brickell Ave | 33131 | $680.57
- Imperial at Brickell – 1627 Brickell Ave | 33129 | $331.99
- Jade – 1331 Brickell Bay Dr | 33131 | $723.60
- Neo Vertika – 690 SW 1 Ct | 33130 | $332.27
- One Miami – 325 & 335 S Biscayne Blvd | 33131 | $424.36
- Santa Maria – 1643 Brickell Ave | 33129 | $682.23
- Skyline on Brickell – 2101 Brickell Ave | 33129 | $391.91
- Solaris at Brickell – 186 SE 12 Ter | 33131 | $422.66
- The Club at Brickell Bay – 1200 Brickell Bay Dr | 33131 | $684.44
- The Mark on Brickell – 1155 Brickell Bay Dr | 33131 | $575.90
- The Palace – 1541 Brickell Ave | 33129 | $395.54
- Villa Regina – 1581 Brickell Ave | 33129 | $403.39
- Vue at Brickell – 1250 S Miami Ave | 33131 | $406.92
Below you will find some additional statistics:

As with last month, the first column to the right of each condo development’s name is the difference in the average sales price and list price for this month, expressed as a percentage. The Club at Brickell Bay, The Mark on Brickell and The Palace are the only developments that have a higher average sales price than list price. The former two have questionable closed sales included in the six month average.
The second column is the number of active listings in each development currently in the MLS. The third column shows the percentage that these listings represent over the total number of condo units in each development. The cells highlighted in green reveal those developments that have active listings that represent less than 10 percent of the the overall units in the building. I find this to be a healthy number. The ones highlighted in red reveal those developments that have active listings that represent over 20 percent of the overall units in the building. I would stay away from these condo developments and others that approach the 20 percent mark. The condo developments with active listings less than 10 percent are considered very safe, in my opinion, and anything in the 10-15 percent range is considered normal, even in a healthy market.
The fourth column shows the number of pending sales while the fifth column displays the number of closed sales within the past month. The number of pending sales has dropped this month to 49 from last month’s figure of 51. The number of closed sales within the past month has remained the same at 7, which is still the lowest that I’ve seen in Brickell within one month since I’ve been tracking this statistic.
The sixth column show you the difference in the average list prices from this month’s and last month’s, expressed a percentage. Those highlighted in red reveal those condo developments which had a drop in their average list price while those highlighted in green show those that had an increase. As you can see, listings at Solaris at Brickell had an increase of 7.47 percent within the past month. Much of this increase is attributed to a new listing that is listed at $904 per square foot! What are they thinking? What I find to be particularly funny is that it says “Owner Hardly Motivated” in the broker remarks. Why even list it then? It is a one bedroom with 730 square feet listed for $660,000. I’m going to keep my eye on this one because I wouldn’t be surprised to see it under contract by the wrong type of buyer.
The seventh column reveals the difference in average sales prices from this month’s and last month’s, expressed as a percentage. The 15.49 percent price decrease at Skyline on Brickell is mainly attributed to a closed sale at a high price per square foot that dropped off the average. The large 27.41 percent price increase at Villa Regina is legitimate. There have been two closed sales in the building within the past month and one of them was a 3,060 square foot 3 bedroom/3.5 bath condo with a direct bay view that sold for $1,480,000, or $484 per square foot.

I think next month we’ll see more activity. I did notice that Jade had 2 closed sales on November 20, 2007. Those transactions will appear on next month’s Brickell Condo Index.
Downtown Dadeland Project Developer Goes Bust

This past week, the Daily Business Review published a very interesting real estate news story. The article, entitled “Condo Meltdown: Historic Failure in Kendall Project”, revealed that the developers of the Downtown Dadeland project, located in Kendall, have decided to walk away from the project and are handing the development over to the lender.
The article opens with the following two paragraphs:
The developers of Downtown Dadeland are walking away from the massive mixed-use project in Kendall and handing over the unfinished complex to construction lender Goldman Sachs Commercial Mortgage.
Gulfside Development principals Jackson Ward and Stefan Johansson say they can no longer afford to make payments on the $224 million construction loan and won’t fight a foreclosure suit filed two weeks ago in Miami-Dade Circuit Court.
The rest of the article goes on to say how this could be one of the largest defaults to have ever occurred in Miami-Dade County. I think this is just the beginning. It will be interesting to see how many similar stories will be published within the next couple of years.
Investment groups, bulk buyers, vulture capitalists – whatever you wish to call them – will have a field day in Miami in 2008.

Yet Another Auction
I wanted to make everyone aware of another auction that will be held December 15, 2007 at the Miami Beach Convention Center in South Beach. I’ve perused the list of condos to be auctioned and it looks like there are some quality condos on the list. Below you will find some of the condos that will be auctioned:
- Courvoisier Courts – Unit 2312 – 3/2.5 – 1,655 SF (Brickell Key)
- Isola Brickell Key – Unit ??? – ??? – ??? SF (Brickell Key)
- Jade at Brickell – Unit 502 – 2/2 – 1,460 SF (Brickell)
- Jade – Unit ???? – ??? – ???? SF (Brickell)
- Murano Grande – Unit 805 – 2/2 – 1,400 SF (South Beach)
- Neo Lofts – Unit 1006 – 2/2 – 1,109 SF (Miami River)
- Ocean View – Unit 210 – 1/1 – ??? SF (Sunny Isles Beach)
- Ocean View – Unit ??? – ??? – 1,225 SF (Sunny Isles Beach)
- Royal Atlantic – Unit 209 – 1/1 – 654 SF (South Beach)
- The Club at Brickell Bay – Unit 2114 – 1/1 – 818 SF (Brickell)
- The Club at Brickell Bay – Unit 2603 – 1/1 – 825 SF (Brickell)
- The Club at Brickell Bay – Unit 3102 – 3/2 – 1,232 SF (Brickell)
- The Club at Brickell Bay – Unit 3202 – 3/2 – 1,232 SF (Brickell)
- The Cosmopolitan – Unit 2603 – 2/2 – 1,010 SF (South Beach)
- Vue at Brickell – Unit ??? – ??? – ??? SF (Brickell)
- Vue at Brickell – Unit 3606 – 3/2 – 1,551 SF (Brickell)
Contact me if you’d like more information about this auction so I can register you. There’s a 5 percent buyer’s premium and a $5,000 cashier’s check is required the day of the auction. The balance of 5 percent of the total price will be due the day of the auction if you are the highest bidder. Inspections must be conducted prior to bidding.
Miami & Miami Beach Condo Trends – November 2007
I’m going to start including a monthly condo trends report. My hope is that it will help to shed more light on the current state of the market. It is likely to be my most followed monthly piece. After the new year it, along with some other newly added statistics such as a rental market index, will become “premium” content. Just wanted to give you all the heads up. I just finished compiling the numbers and I was pretty shocked.
I basically wanted to find out how many months of inventory we have in Miami and Miami Beach. I created a report for Miami-Dade County, one for Miami and one for Miami Beach. I broke each report down to various price ranges to figure out which category has been affected the most. I took closed sales for the month of October and compared it to the inventory that is now available. Below you will find the numbers for Miami-Dade County:

As you can see Miami-Dade County has about 55 months, or 4.58 years, worth of inventory. I wanted to see how much of this supply resides in Miami compared to Miami Beach. Below you will find the numbers for Miami:

Miami currently has a 48 1/2 month, or approximately a 4 year, supply of condos. That’s actually much lower than I expected. However, keep in mind that there are thousands of condos that will come onto the market within the next 24 months. In fact, in July, I calculated that a little over 16,000 condos would hit the market within the next 19 months in the neighborhoods of Brickell Key, Brickell, Downtown Miami, Park West and the Performing Arts District. Probably about 1,500 or so units have hit the market since I wrote that post. If you add 14,500 units to the Miami figures above then we’re looking at close to a 10 year supply. Now that’s quite shocking!!!
Let’s take a look at the Miami Beach figures:

I was surprised to learn that the supply of Miami Beach condos is higher than that of Miami’s. The number of new condos coming onto the market, however, in Miami Beach pales in comparison to the new condos scheduled to hit the market within the next two years. My guess is that about 1,500 units will hit the Miami Beach market in that time which would put it at around an 8 year supply. Still pretty shocking given that it’s Miami Beach! I was equally shocked by the low number of closings in the $500,000-$999,999 price range. That appears to be a problematic price range if you’re a condo owner looking to sell somewhere in that range.
Despite a number of news stories that have hit the press lately, it looks like the ultra-luxury ($2.5M+) market isn’t moving. It has very few available listings compared to the other categories but it had basically no closed sales in October. There were a total of two in all of Dade-County. Both were located in Bal Harbour.
I receive a lot of monthly phone calls from investors who are waiting for the market to bottom-out. They all want to know when is the “right” time to buy into the South Florida condo market. I’m hoping that a report like the one above can help me pinpoint when that time might be.
A recent Fortune magazine article entitled, “Real Estate: Buy, Sell, or Hold?”, said the following:
The combination of steep discounts to move inventory and a stream of new communities built at a lower cost will keep prices far below their peak levels in the boom towns. And they’ll keep falling until builders work off the massive inventories. The tumbling prices of new homes, in turn, will put enormous pressure on the far bigger existing-home market, already under stress from two desperate groups of sellers, investors and banks. Hence, the adjustment needed to bring the ratio of prices to rents into alignment will happen far faster than in most housing downturns. “In the most vulnerable places in California and Florida, it’s highly possible that most of the correction will happen by the end of 2008,” says (Mark) Zandi, (chief economist at Moody’s Economy.com).
The article was mainly discussing single-family homes but I think the same holds true for the condo market. The Miami condo market is likely to drop lower, on a percentage basis, than other major U.S. cities but I agree with Mark Zandi that the market here will be quicker to correct itself because of the high number of foreclosures and defaults that we are likely to see. 2008 will be a time of readjustment. I’m looking quite forward to it.
Marina Blue – Two Condos on High Floors For Sale

Someone who has contracts on two great units at Marina Blue contacted me earlier this week. He wants to sell one prior to closing and hold onto the other.
The first condo is unit 5108. The 08 line is the best line in the entire building since it is situated in the middle of the building and has the best views. This condo has 10-foot ceilings. All units on the 45th floor or higher have 10-foot ceilings as opposed to the non-loft units below that have 9-foot ceilings. The unit has 1,334 square feet of interior space and a 160 square foot balcony. He is asking $740,000 for this unit.

The second condo is unit 4609. It is a very rare floor plan that I didn’t even know existed in the building. There are only six units that have this floor plan in the entire building. The condo has a total of 1,754 square feet of interior space and a 240 square foot balcony. As with the other unit, it has 10-foot ceilings. Both units have amazing water views. You can see the South Beach skyline, Biscayne Bay and the Atlantic Ocean. As you can see from the floor plan below it has a huge living room. He is asking $899,000 for this unit.

Closings are likely to begin at Marina Blue in December. Contact me if you or someone you know has an interested in either of these two units.
South Beach Condo Index – November 2007

The following data was collected on Sunday, November 11, 2007. The average price per square foot of condos currently listed in the following 19 developments in South Beach dropped from last month’s average. In fact, it even dipped below September’s average. It went from $889.83 per square foot, in October, to $886.71, for this month. The September average price per square foot was $887.60. The weight-adjusted average also slid slightly to $773.67 from last month’s weighted average of $773.73. Below, you will find the average price per square foot of condos listed in the following 19 condo developments in South Beach:

The average price per square foot of condos sold over the previous six months has gone down from $787.01 per square foot to $775.74. Once again, Meridian Lofts didn’t have any closed sales within the last six months which is why you will find the “N/A” below. If Meridian Lofts were included in the average this month, at its previous average price per square foot of $434.78 in September, then the average price of condos sold in this index would have dropped from $768.47, last month, to $757.80, this month. Below, you will find the average price per square foot of condos that have sold within the last six months in the following 19 developments in South Beach:
- 1500 Ocean Drive – 1500 Ocean Dr | 33139 | $946.39
- Bentley Bay – 520 & 540 West Ave | 33139 | $654.75
- Bentley Hilton – 101 Ocean Dr | 33139 | $1,056.76
- Continuum South Tower – 100 S Pointe Dr | 33139 | $1,050.00
- Cosmopolitan – 110 Washington Ave | 33139 | $521.61
- Courts at South Beach – 140 Jefferson Ave | 33139 | $456.52
- The Decoplage – 100 Lincoln Rd | 33139 | $508.06
- The Floridian – 650 West Ave | 33139 | $551.03
- Grand Venetian – 10 Venetian Wy | 33139 | $465.92
- Icon South Beach – 450 Alton Rd | 33139 | $777.97
- Il Villaggio – 1455 Ocean Dr | 33139 | $1,217.60
- Meridian Lofts – 2001 Meridian Ave | 33139 | N/A
- Mirador 1000 & 1200 – 1000 & 1200 West Ave | 33139 | $397.71
- Murano at Portofino – 1000 S Pointe Dr | 33139 | $1,040.34
- Murano Grande – 400 Alton Rd | 33139 | $721.85
- Portofino Tower – 300 S Pointe Dr | 33139 | $1,014.26
- Setai South Beach – 101 20 St | 33139 | $1,494.92
- Waverly at South Beach – 1330 West Ave | 33139 | $475.99
- Yacht Club at Portofino – 90 Alton Rd | 33139 | $611.65
As with the Brickell and Brickell Key condo indices, I have provided the graph below to make it easier for everyone to make sense of the statistics above. If you can’t read the numbers below then you need to upgrade your glasses to a set of binoculars. Otherwise, right-click and save the graph below and blow it up to as big as you’d like.

The first column, to the right of each condo development’s name, is the difference in the average sales and list prices for the statistics at the top, expressed as a percentage. With the exception of Portofino Tower and The Floridian, the average sales prices are well below the average list prices in these 19 developments. Portofino Tower had a condo sell for $1,505 per square foot on June 29, 2007. Once that transaction falls off the average in January, we shall see Portofino Tower begin to show its true colors. Average list and sales prices at The Floridian are merging together because the high number of short-sales that are available at The Floridian. Once a few of these actually close, the average sales price will fall well below the average list price.
The second column is the number of active listings in each development currently in the MLS. The third column shows the percentage that these listings represent over the total number of condo units in each development. The cells highlighted in green reveal those developments that have active listings that represent less than 10 percent of the the overall units in the building. I find this to be a very healthy number. 1500 Ocean Drive, Courts at South Beach, The Decoplage, Grand Venetian, Il Villaggio and Murano at Portofino fall into this territory.
The 10-15 percent range is considered average while the 15-20 percent range is beginning to approach dangerous levels. The ones highlighted in red reveal those developments that have active listings that represent over 20 percent of the overall units in the building. This indicates that the danger zone has been breached and caution should be heeded. Of the 19 condo developments in the South Beach Condo Index, Bentley Bay, Murano Grande and Setai South Beach fall into this red zone area.

The fourth column shows the number of pending sales while the fifth column displays the number of closed sales since October’s South Beach Condo Index. As you can see, there are 31 pending sales in South Beach. There’s been a total of 13 closed sales within the last month, which matches last month’s figure. Icon South Beach, with 3 closed sales, is beginning to show some spirit. There was a recent article in the papers that stated that former NFL quarterback Michael Vick, recently acquired a pricey condo at Icon South Beach. I’m pretty sure that the neighbors won’t be pleased by all of the dog barking until he begins to serve his time. Woof, woof!!!
The sixth column shows you the difference in the average list prices from this and last month’s, expressed a percentage. Those highlighted in red reveal those condo buildings which had a drop in their average list price, those highlighted in green show those that had an increase while those highlighted in yellow reveal a stalemate from last month’s figures. As you can see, Meridian Lofts had an 11.44 percent drop. That’s probably because it hasn’t had any closed sales within the last six months. Time to drop prices!
The seventh column reveals the difference in average sales prices from this and last month’s, expressed as a percentage. The color scheme remains the same. Sales prices at Bentley Bay spiked up 7.33 percent because a transaction that took place on May 8, 2007 at $476 per square foot fell off the average. The Setai South Beach took a beating this month, with a 9.71 percent drop from last month’s average. This is mainly attributed to a Penthouse unit that sold for $1,851 per square foot falling off the average this past month.
Pending sales have increased to 31 from last month’s figure of 25. It looks like the off-peak months have begun to knock boots with the on-peak months. Just wait until January. I promise that you’ll begin to see more pending and closed sales during those months.


