Fun Fact Friday: Every Building Swire Builds Is Blessed By Monks… Twice
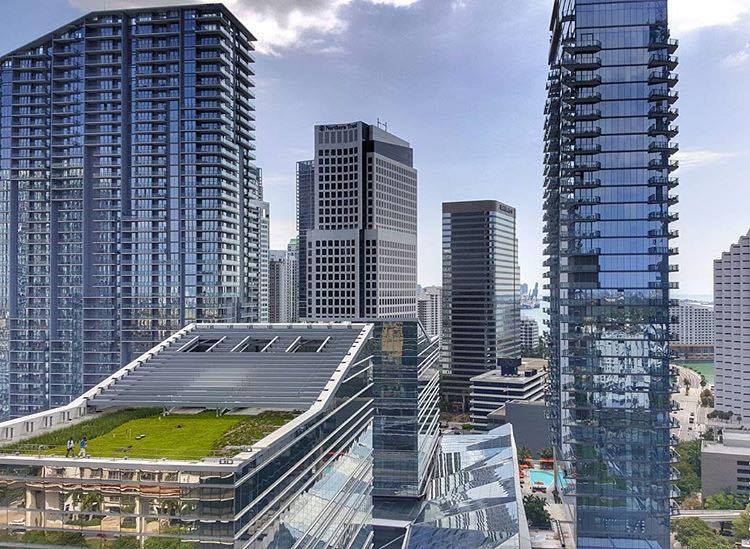
We find ourselves praising Swire Properties regularly. They move trees from their development sites to local parks rather than cutting them down, they donate money to The Underline (Miami’s answer to New York’s High Line), they spend $31 million on a climate ribbon that cools their shopping center, protects shoppers from the elements and looks really nice from every angle. Now, we also learn that each and every building that Swire Properties builds is blessed by monks at least twice.
The Hong Kong based developer has a tradition of flying monks to their build site at groundbreaking for a blessing ceremony. The ceremony is repeated once the project is complete. In 2005, Carbonell was even able to be blessed by the Dalai Lama himself! Brickell City Centre was blessed multiple times. First, there was a blessing ceremony at groundbreaking, then the East Hotel was blessed upon completion. Reach and Rise received their own completion ceremonies with the East Hotel receiving an additional blessing at this time. When the mall opened, the entire project was blessed again. Talk about counting our blessings! Here are the other buildings in the area that were built by Swire Properties:
Brickell Key One (1982)
Brickell Key Two (1991)
One Tequesta Point (1995)
Courvoisier Courts (1997)
Two Tequesta Point (1998)
Three Tequesta Point (2001)
Courts at Brickell Key (2003)
Jade Residences at Brickell Bay (2004)
Carbonell (2005)
Now that’s what we call #Blessed!!
Brickell Key Buildings With Tennis Courts
Yesterday we honored the 2017 Miami Open by taking an in-depth look at all of the new construction buildings coming to the area that will offer tennis courts, but what is out there for those who need to move more quickly? Here are our suggestions for buildings that are already constructed and also have onsite tennis facilities.
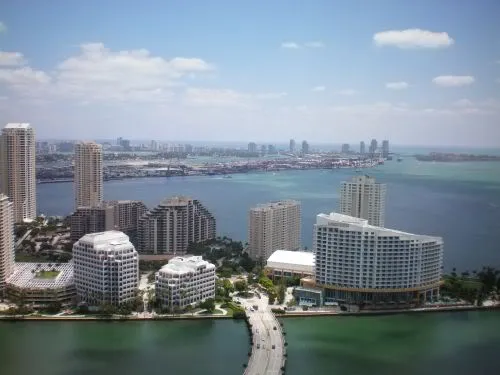
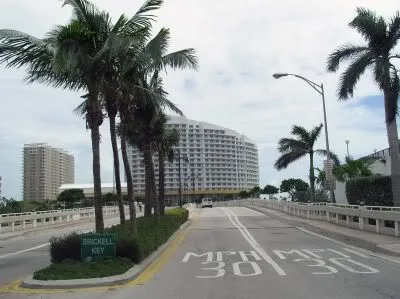
Brickell Key has the largest concentration of buildings with tennis courts in the area. For those who don’t know, it is a private island with 11 residential buildings, most of which were built in the 1980’s through the early 2000’s. Given the fact that it is situated behind a guard gate and the large array of family-friendly amenities, the island is very popular for families with young children.
The newest and most luxurious building on the island is Asia. It was built in 2008 and has 123 residences. Some of the amenities include private elevators and fingerprint access. Prices range from around $1 million to the $12.8 million penthouse. Rental prices range from $4,500/month to $12,000/ month.
The most affordable buildings with tennis courts are Brickell Key 1 & Brickell Key 2. Brickell Key 1 was the first building to be constructed on the island in 1982, followed by Brickell Key 2 in 1991. Together, they offer a resort-like feel and share a tennis court. Prices currently start at $220,000 for a studio and average $425/square foot. Rental prices start at $1,750 for 1 bedrooms and $2,500 for 2 bedrooms. Every now and again you can catch a studio for $1,550 or a 3 bedroom for $3,000.
On the south side of the island, next to the Mandarin Oriental Hotel, is Isola Condo. It was built in 1990 with 1 and 2 bedroom plans and has availability ranging from $260,000 – $600,000. Rental prices range from $1,750-$2,800.
Carbonell is located on the northern tip of the island and offers larger floor plans that range in price from $469,000 to $2.35 million. It was built in 2005 and has amazing unobstructed water views from most all of the apartments. Even the apartments facing south have nice water views over the island. Rental prices range from $2,700 for a 1 bedroom that is over 1,000 square feet up to $9,700 for a 2,860 square foot 4 bedroom and amazing wraparound terrace.
If you are interested in courts of all kinds, I would suggest Courts at Brickell Key. They have tennis, racquetball AND squash courts (hence the name). Apartments at Courts range from 863 one bedrooms up to 1,878 three bedrooms. Their prices range from $359,000 to $1.4 million for sales and $2,050/month to $4,900/month for rentals.
On the top of the hill are the Tequesta buildings. The newest is Three Tequesta Point, which also has a tennis court. This building was built in 2001 and also offers larger floor plans. The one bedrooms start at 1,087 square feet and $490,000. The largest unit is a 3,739 square foot 46th floor penthouse that is $3.825 million. Tenants can find opportunities between $2,950/month up to $14,700 for that same 46th floor penthouse.
Something that many people are unaware of is that Two Tequesta Point shares amenities with Three Tequesta Point, so residents of both towers share a tennis court. The apartments in Two Tequesta Point are slightly smaller, but just as beautiful. They range from $400,000 for a 907 square foot 1 bedroom up to $1.95 million for a 2,510 square foot 3 bedroom on the 34th floor. Rentals range from $2,500/month for a 1 bedroom up to $7,250/month for a 3 bedroom. Two Tequesta Point is also in the process of having its lobby renovated, which can be previewed here.
It is important to note that the prices we have discussed are valid for today, March 29, 2017. Since these are resales and rentals, they could change at any moment depending upon the market. If you would like to discuss specific availability, we are always here to help. Tomorrow, we will head back over to the mainland for a tour of Brickell condo buildings that have tennis courts!
New Miami Condo Buildings With Tennis Courts
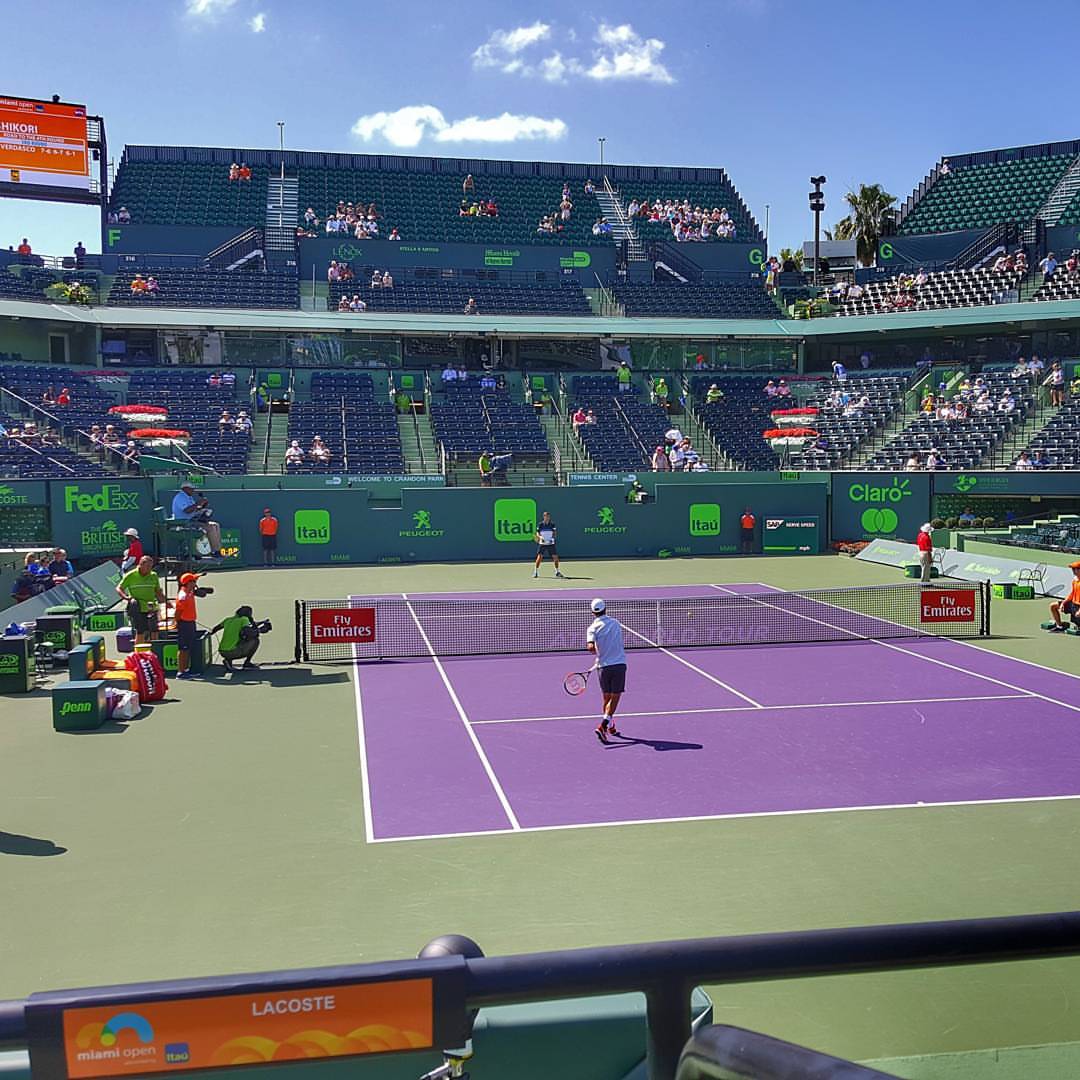
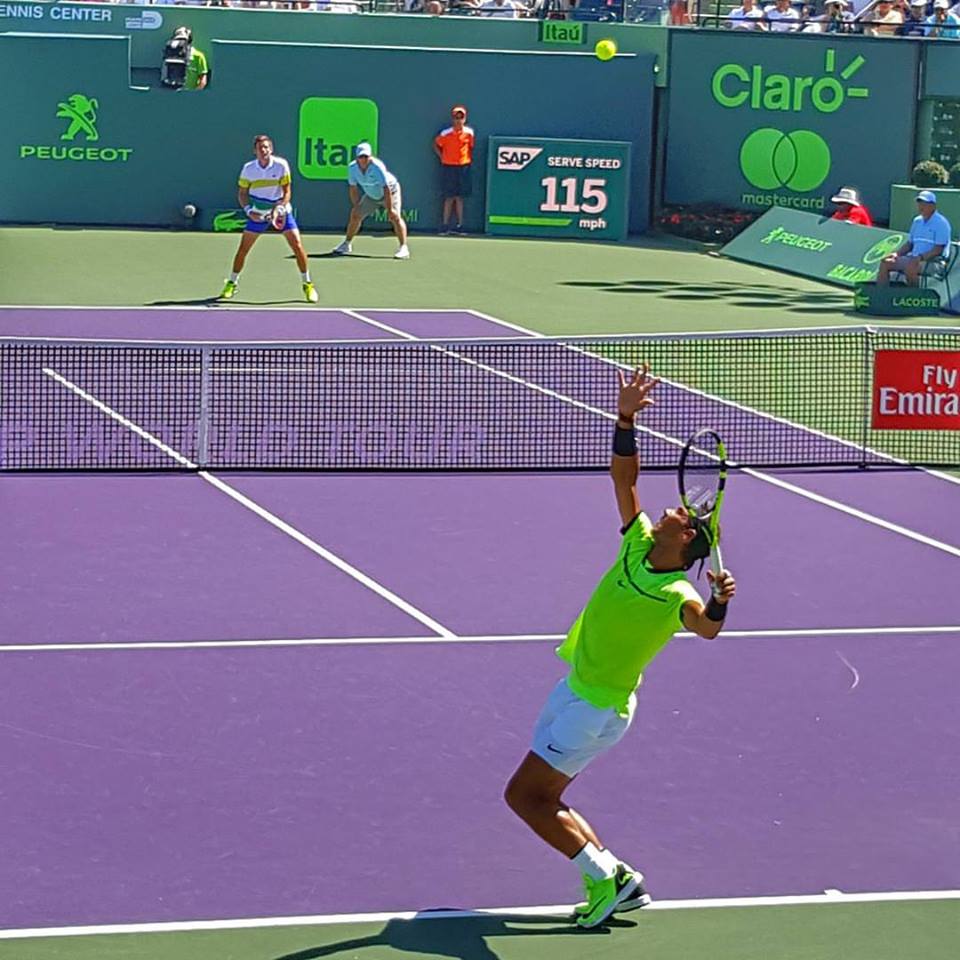
This time of year brings one of our favorite events to Miami. The Miami Open runs from March 19-April 1 this year, and to commemorate it, let’s have a look at our favorite buildings in the greater downtown area that have tennis courts!
If living in a brand-new condo is important to you, there are several in the pipeline. Key International’s 1010 Brickell is slated to open within a few weeks. They have an indoor tennis court and 3 remaining presales starting at $950,000. All are 3 bedroom layouts. There is one resale unit on the market so far. SLS Lux is also on track for completion this fall/winter. They have only four penthouses remaining that have recently been repriced.
In Downtown, Paramount Miami Worldcenter is going to bring every amenity imaginable to their mega-project. They are about 60% sold and have residences priced at an average of $750/square foot. Because of their strong sales figures, they were recently able to secure the second largest construction loan in this build cycle. They are currently in vertical construction and should deliver keys at the end of 2018.
If you’re looking for something sooner, you could head up to Edgewater and check out Biscayne Beach. They have 2 tennis courts over their parking deck and a bayfront beach club. They have 5 remaining presale opportunities, and we will be listing an amazing high floor 3 bedroom on the southeast corner.
For people who are looking for an integrated community, I would suggest the waterfront Paraiso complex. There are five residential sections to the complex, totaling 1400 units. Paraiso Bayviews is the most affordable section, with remaining inventory starting at $470k (as of today). They just passed the 42nd floor of construction and should be ready by the end of this year. Paraiso Bay was the first of the towers to open sales. They are currently all sold out and on track to open this summer. GranParaiso is the most luxurious of the towers. It will be finished in Spring of 2018 and has 2 bedroom residences starting at $1 million. One Paraiso is the sister building to Paraiso Bay. They have 3 remaining penthouses, starting at $1.9 million. Aside from the towers, there is also a small enclave of bayfront beach homes. There are only 8 in total and 1 remains at $2 million.
Hyde Midtown is going to be the first project in Midtown to offer a tennis court for residents. They recently topped off at 80% sold. Their prices start in the mid $400,000’s and the rooftop penthouses start at just $735,000! The penthouses have rooftop terraces as well.
Come back tomorrow and we can take a look at the existing buildings who also offer tennis courts!
Recently Listed Condo REOs in Miami – August 2009
Earlier this evening, I did a search for condo foreclosures in Miami for a client. 9 condos recently listed caught my attention.
- Santa Maria #2506 – 2 bedroom/2.5 bath (2,100 square feet of interior) – Asking $899,900, or $429 per square foot – 24 days on the market
- Jade Brickell #1201 – 2 bedroom/2.5 bath (1,878 square feet of interior) – Asking $667,900, or $356 per square foot – less than 2 hours on the market
- Carbonell #1805 – 2 bedroom/2.5 bath (1,505 square feet of interior) – Asking $525,000, or $349 per square foot – 8 days on the market
- Four Seasons Hotel #3203 – 1 bedroom/1.5 bath (983 square feet of interior) – Asking $460,000, or $468 per square foot – 7 days on the market
- Emerald at Brickell #1101 – 2 bedroom/2.5 bath (1,594 square feet of interior) – Asking $364,900, or $229 per square foot – 3 days on the market
- Blue Condo #1701 – 2 bedroom/2.5 bath (1,449 square feet of interior) – Asking $208,395, or $144 per square foot – 7 days on the market
- 50 Biscayne #4705 – 1 bedroom/1 bath (845 square feet of interior) – Asking $179,900, or $213 per square foot – 3 days on the market
- The Club at Brickell Bay #4304 – 1 bedroom/1 bath (825 square feet of interior) – Asking $119,900, or $145 per square foot – 8 days on the market
- 1800 Biscayne Plaza #1203 – 2 bedroom/2 bath (1,040 square feet of interior) – Asking $117,590, or $113 per square foot – 8 days on the market
Unit 701 at Carbonell in Brickell Key Revisited

Some of you may remember unit 701 at Carbonell which appeared in an earlier post entitled “Top 5 Distressed Condo Sales in December 2008“. The 1 bedroom/1.5 bath condo with 1,031 square feet of interior closed on December 19, 2008 for $215,000. Many of you felt that a condo for $209 per square foot at Carbonell was an amazing deal.

Well, the condo is back on the market. It appears that the investors who purchased the unit felt that they got such a great deal that they could flip it for a profit. The condo is now listed for $295,000 after two quick price reductions. I showed it Sunday afternoon. I didn’t realize until later that it was the same condo that previously sold as a foreclosure in December.

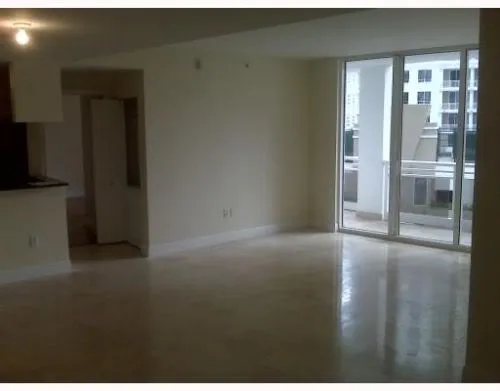
I know everyone hates to hear the word “flip”. However, I think the investors will be able to accomplish just that. The condo doesn’t have much of a view but it’s a very spacious floor plan, is in great condition with beautiful marble floors in the living room and kitchen and is in one of the best buildings in Brickell Key. Unit 701 is by far the best priced one bedroom at Carbonell at this time. The next best priced one bedroom is listed for $415,000. Unit 601, one floor below, is listed for $439,000.
Perhaps the investors will decide to hold onto their purchase. The condo is also listed for rent with an asking price of $1,825 per month.
Carbonell condos for sale
Top 5 Miami Distressed Condo Sales in December 2008
Sorry for the long hiatus. I’m back from my long vacation and ready to get back to work. Below, you will find what I believe to be the five best condo deals of the 36 distressed sales that closed in the month of December in the MLS located in Brickell, Brickell Key, Downtown Miami and the Arts District.
- Four Seasons Residences – unit 3305 – 1 bedroom/1 bath (611 square feet) – This unit sold for $285,000, or $466 per square foot, on December 3, 2008. Foreclosure
- Carbonell – unit 701 – 1 bedroom/1.5 bath (1,031 square feet) – This unit sold for $215,000, or $209 per square foot, on December 19, 2008. Foreclosure
- Three Tequesta Point – unit 1605 – 2 bedroom/2 bath (1,694 square feet) – This unit sold for $465,000, or $275 per square foot, on December 3, 2008. Foreclosure
- Blue Condominium – unit 2310 – 2 bedroom/2 bath (1,174 square feet) – This unit sold for $330,000, or $281 per square foot, on December 1, 2008. Foreclosure
- Cite on the Bay – unit 3502 – 3 bedroom/2 bath (1,398 square feet) – This unit sold for $230,000, or $165 per square foot, on December 10, 2008. Short-sale
Brickell Key Condo Index – June 2008

The following data was collected on June 27, 2008. It’s been quite some time since my last Brickell Key Condo Index. In fact, the last was published in January 2008, or 5 months ago. What’s interesting is that it has been one year since I started the Brickell Key Condo Index, so in this update we’ll be able to see how prices have fared over the past 12 months.
As many of you might have guessed, the average price per square foot of Brickell Key condos listed in the MLS has continued to go down since the January 2008 update. In fact, average list prices have gone down across the board throughout the 10 Brickell Key condo buildings represented in this index. I’ll show you the percentage decreases in each building towards the bottom of this post. In January 2008, the average price per square foot of condos listed in Brickell Key was $486.07. The average now stands at $450.49. That’s about a 7.3% drop in list prices in 5 months. More interesting is the drop since June 2007. At that time, the average price of condos listed in Brickell Key was at $519.97. That means list prices in Brickell Key have come down a little over a 13% in 12 months.

Average price per square foot of Brickell Key condos currently listed on the MLS:
The average price per square foot of condos that have sold within the past five months has gone down as well. This average dropped to $367.19 per square foot from the $416.92 that we saw in January 2008. This average stood at $445.59 in June 2007. That’s a 11.9% drop within 5 months and a 17.6% drop within 12 months. The average price per square foot for closed units at St. Louis was not included in this month’s index, however, because there haven’t been any closed sales within the past 6 months. That’s why you’ll see the absence of a bar for St. Louis in the graph below. The percentage drop may have been smaller had there been closings at St. Louis but nobody knows for sure since we don’t know where the market clearing value for these condos lies.

The average price per square foot of condos sold within the past six months:
- Brickell Key One – 520 Brickell Key Drive | 33131 | $321.16
- Brickell Key Two – 540 Brickell Key Drive | 33131 | $299.76
- Carbonell – 901 Brickell Key Drive | 33131 | $408.33
- Courts Brickell Key – 801 Brickell Key Drive | 33131 | $360.31
- Courvoisier Courts – 701 Brickell Key Drive | 33131 | $336.01
- Isola – 770 Claughton Island Drive | 33131 | $265.79
- One Tequesta Point – 888 Brickell Key Drive | 33131 | $392.33
- St. Louis – 800 Claughton Island Drive | 33131 | N/A
- Three Tequesta Point – 848 Brickell Key Drive | 33131 | $465.02
- Two Tequesta Point – 808 Brickell Key Drive | 33131 | $455.98
The chart below reveals additional statistics pertaining to the 10 aforementioned condo buildings in Brickell Key:

The first column to the right of each condo development is the difference in the average sales price and list price for this month, expressed as a percentage. As you can see, there is, in some cases, very large discrepancies in the average list price versus the average sales price for condos that have closed within the past six months. Notice the 36.75% difference in these two averages for Isola and about 29% differences for Brickell Key II and Carbonell. Wow! I guess list prices in these buildings still have a ways to go to catch up to price level where there’s actual demand to buy.
The second column is the number of active listings in each development currently in the MLS. The third column shows the percentage that these listings represent over the total number of condo units in each development. If you compare this month’s chart to the one published in January 2008, you’ll notice that the majority of the Brickell Key condo buildings have had a slight increase in the number of available listings. The cells highlighted in green reveal those developments that have active listings that represent less than 10 percent of the the overall units in the building. As I’ve stated before, I find this to be a very healthy number. The ones highlighted in red reveal those developments that have active listings that represent over 20 percent of the overall units in the building. Proceed with caution if you’re buying in a condo building where the available listings represents over 20 percent of the total number of units. Condo developments with active listings representing less than 10 percent of the overall condos are considered very safe, in my opinion, and anything in the 10-15 percent range is considered normal, even in a healthy market.
The fourth column shows the number of pending sales while the fifth column displays the number of closed sales within the past six months in the MLS. All of the buildings have had at least 3 closed sales within the past six months except St. Louis, which laid a fat goose egg. Two Tequesta Point experienced the most closings in that time frame with 9.
The sixth column shows the difference in the average list prices from January 2008 and this month, expressed a percentage. Those highlighted in red reveal those condo developments which have had a drop in their average list price. As you can see, each of the 10 buildings in Brickell Key, represented in this index, have experienced a drop in their average list prices within the past five months.
The seventh column reveals the difference in average sales prices from January 2008 and this month, expressed as a percentage. Only Two Tequesta Point and Three Tequesta Point have had increases in their average price per square foot for units sold within the past six months. With 9 and 6 closed sales, respectively, within the past six months, perhaps these two buildings have established a floor? I guess time will tell.
It’ll be interesting to see where prices for Brickell Key condos will reside in another 12 months. My take is that about 4 or 5 of these condo buildings are close to reaching their bottoms while the other half still needs at least another 4-6 months to reach that point.
Miami Condo Index – Brickell Key – January 2008

The Brickell Key Condo Index is back. I didn’t have time to provide a monthly update for December 2007. For those who have newly discovered this site, the Brickell Key Condo Index is a monthly post that provides important housing statistics pertaining to the 10 existing condo buildings located on Brickell Key. I also publish a monthly update pertaining to 17 well known buildings located in Brickell. Condos located in Downtown Miami and the Arts District of Miami will likely have their own index within the next six months. I’m just waiting for more buildings in those areas to be completed.
The average price per square foot of condos listed in Brickell Key has gone down since the November 2007 update. List prices have continued to drop each month since I began this index in June 2007. At that time, the average price per square foot of condos listed in Brickell was $519.97. It now stands at $486.07. That’s about a 6.5% drop in list prices in 7 months. These numbers are in line with the housing numbers that were released this past week. The weight-adjusted average also fell to $481.98 from November’s weight-adjusted average of $490.87.
Average price per square foot of Brickell Key condos currently listed on the MLS:

The average price per square foot of condos that have sold within the past six months has gone down as well. This average dropped to $416.92 per square foot from the $435.21 that we saw in November 2007. In June, this average stood at $445.59. The January average represents a 6.4% drop within the past 7 months. The weight-adjusted average also fell to $414.54 from November’s weight-adjusted average of $433.31.
The average price per square foot of condos sold within the past six months:
- Brickell Key One – 520 Brickell Key Drive | 33131 | $326.88
- Brickell Key Two – 540 Brickell Key Drive | 33131 | $398.70
- Carbonell – 901 Brickell Key Drive | 33131 | $481.29
- Courts Brickell Key – 801 Brickell Key Drive | 33131 | $466.49
- Courvoisier Courts – 701 Brickell Key Drive | 33131 | $444.20
- Isola – 770 Claughton Island Drive | 33131 | $342.72
- One Tequesta Point – 888 Brickell Key Drive | 33131 | $405.28
- St. Louis – 800 Claughton Island Drive | 33131 | $421.25
- Three Tequesta Point – 848 Brickell Key Drive | 33131 | $435.42
- Two Tequesta Point – 808 Brickell Key Drive | 33131 | $446.98
The chart below reveals additional statistics pertaining to the 10 existing condo buildings in Brickell Key:

The first column to the right of each condo development is the difference in the average sales price and list price for this month, expressed as a percentage. Courts Brickell Key was the only development that had a higher average sales price than list price.
The second column is the number of active listings in each development currently in the MLS. The third column shows the percentage that these listings represent over the total number of condo units in each development. The cells highlighted in green reveal those developments that have active listings that represent less than 10 percent of the the overall units in the building. As I’ve stated before, I find this to be a very healthy number. The ones highlighted in red reveal those developments that have active listings that represent over 20 percent of the overall units in the building. Proceed with caution! Condo developments with active listings representing less than 10 percent of the overall condos are considered very safe, in my opinion, and anything in the 10-15 percent range is considered normal, even in a healthy market.
The fourth column shows the number of pending sales while the fifth column displays the number of closed sales within the past two months. Since I didn’t have a December update, I decided to show the number of closed sales since November 28, 2007. As you can see, there have been 9 closed sales in Brickell Key within the past two months. There are currently 28 pending sales, however, 9 of these pending sales have been pending since August 2007 or longer. A few of them have been pending for over a year. I did notice that a good portion of the other 19 pending sales went pending within the first two weeks of the new year.
The sixth column shows the difference in the average list prices from November and this month, expressed a percentage. Those highlighted in red reveal those condo developments which have had a drop in their average list price while those highlighted in green reveal those that have had an increase. As you can see, Carbonell was the only condo building in Brickell Key that has had an increase in its average list price since November 2007. This is attributed to a penthouse condo that was listed the first week of December for around $1,500 per square foot!
The seventh column reveals the difference in average sales prices from November and this month, expressed as a percentage. Brickell Key I, Courts Brickell Key and Courvoisier Courts had average sales prices that were up from those found in November. The average at Isola dropped dramatically since November but not a lot can be made of it because only one closed sale in Isola has occurred within the past six months. It’s not a true average. However, three of the condos that have gone pending at Isola within the past three months have an average list price of $358 per square foot. This is close to the $342.72 price per square foot associated with the one condo that has sold within the past six months.
Miami Condo Index – Brickell Key – November 2007

The average price per square foot of condos listed in Brickell Key has gone down once again, as it has every month since I began this index. The average price per square foot of the ten condos, which represent the Brickell Key Condo Index, fell to $494.61 this month from last month’s figure of $501.55. The weight-adjusted average also fell to $490.87 per square foot versus last month’s weight-adjusted average of $497.82.
Average price per square foot of Brickell Key condos currently listed on the MLS:

This is the first month since I began the Brickell Key Condo Index that the average price per square foot of condos sold over the previous six months has gone up. The average price per square foot of condos sold within the last six months increased to $435.21 from last month’s average of $430.08. The weight-adjusted average also increased to $433.31 from last month’s weight-adjusted average of $424.57. Most of this is attributed to the lack of closed sales at Brickell Key Two. A closed sale of $375 per square foot at Brickell Key Two fell off the average and was replaced by a new closed sale within the past month at $446 per square foot. One closed sale within the past six months encompassed the average in October and November. As I said, the lack of closed sales is to blame.
- Brickell Key One – 520 Brickell Key Drive | 33131 | $308.28
- Brickell Key Two – 540 Brickell Key Drive | 33131 | $445.83
- Carbonell – 901 Brickell Key Drive | 33131 | $535.63
- Courts Brickell Key – 801 Brickell Key Drive | 33131 | $435.03
- Courvoisier Courts – 701 Brickell Key Drive | 33131 | $424.63
- Isola – 770 Claughton Island Drive | 33131 | $440.14
- One Tequesta Point – 888 Brickell Key Drive | 33131 | $407.77
- St. Louis – 800 Claughton Island Drive | 33131 | $442.40
- Three Tequesta Point – 848 Brickell Key Drive | 33131 | $461.58
- Two Tequesta Point – 808 Brickell Key Drive | 33131 | $450.84

Additional statistics can be found in the chart below:

There have been a total of 6 closed sales within the past month which is much better than the pathetic 2 closings revealed in last month’s update. These 6 closings, however, were highly concentrated with 4 of the 6 closings residing at Carbonell. Pending sales have inched up to 18 from last month’s 16 pending sales.


