Another Record-Breaking Sale By The Miami Condo Investments Team!
The Miami Condo Investments Team strikes again! In a condo market that offers years’ worth of inventory for the increasingly scarce number of buyers, our very own Lucas Lechuga closed on Villa Regina‘s T105 today with only 23 days on the market. There have been only 5 closed sales in the building this year with an average marketing time of 49 days, and he was able to get his job done in less than half of that.
On top of the short marketing time, he was able to find four buyers within the week that the final bid was agreed upon. The seller selected an all-cash offer of $810,000, or $427/square foot. This is another shining example that with the right team behind you, properties do sell quickly and for the right price even in a difficult market. We are very happy today to have a very happy client and also a very happy new neighbor in Villa Regina. Congratulations to all!
Just Listed – Lower Penthouse Condo at Villa Regina with 11-Foot High Ceilings
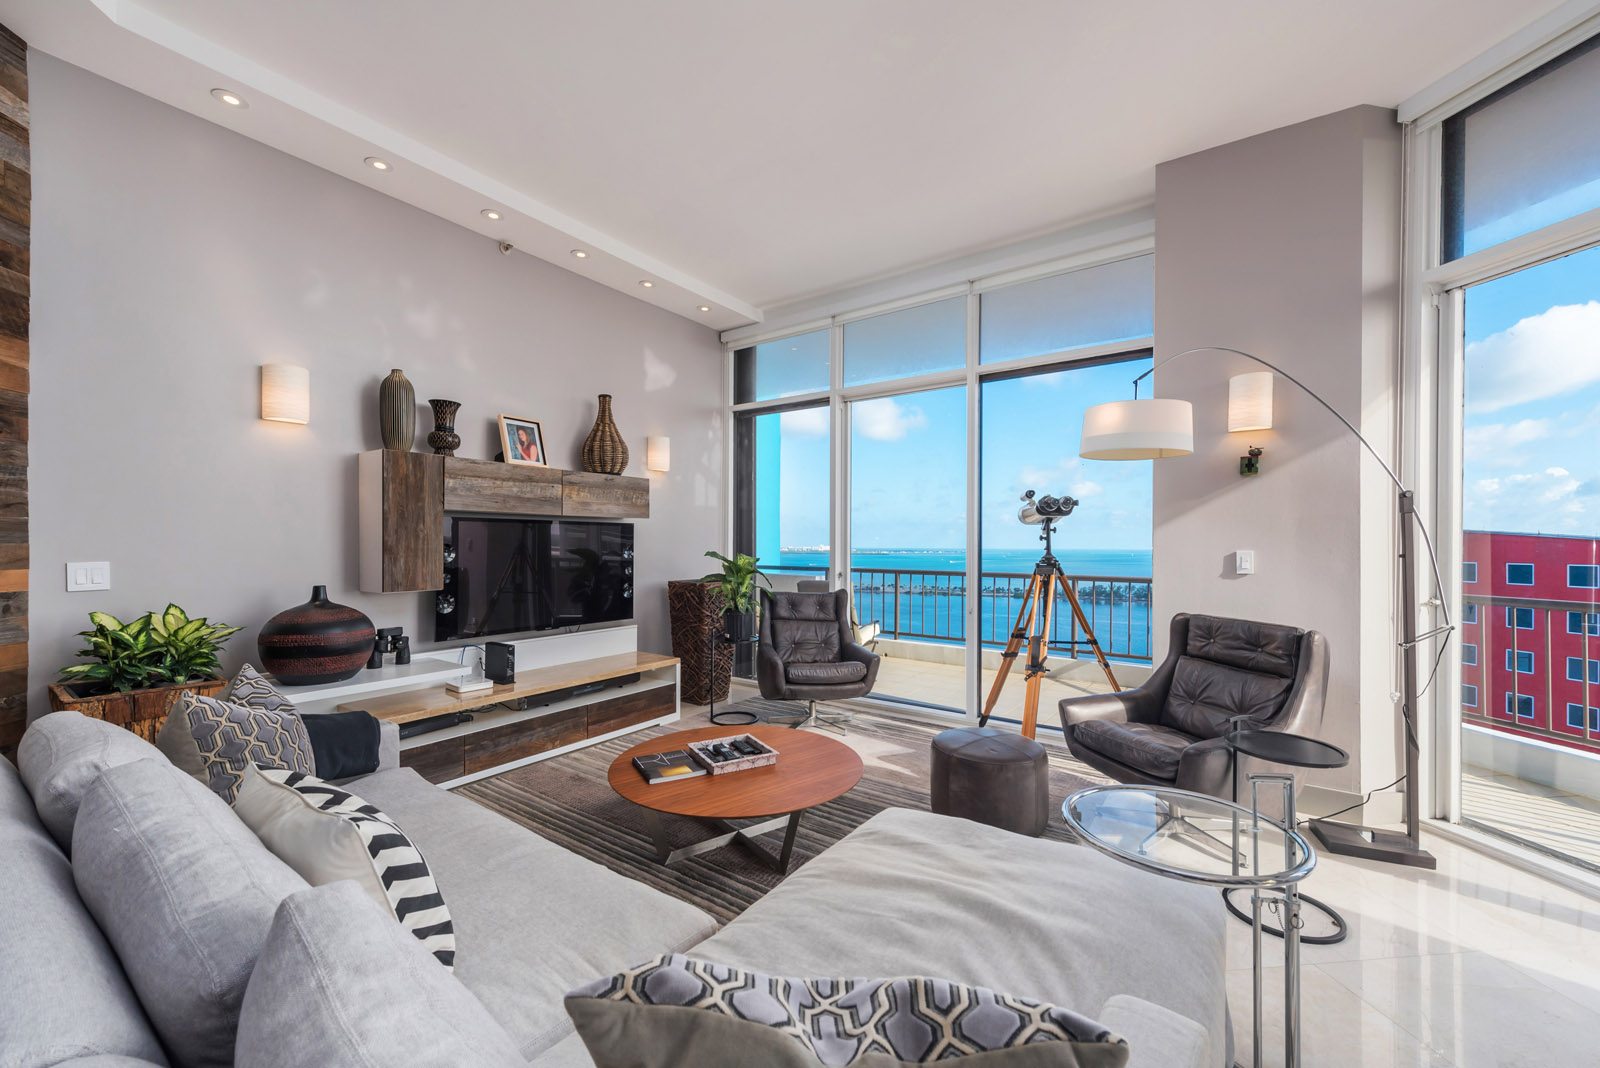
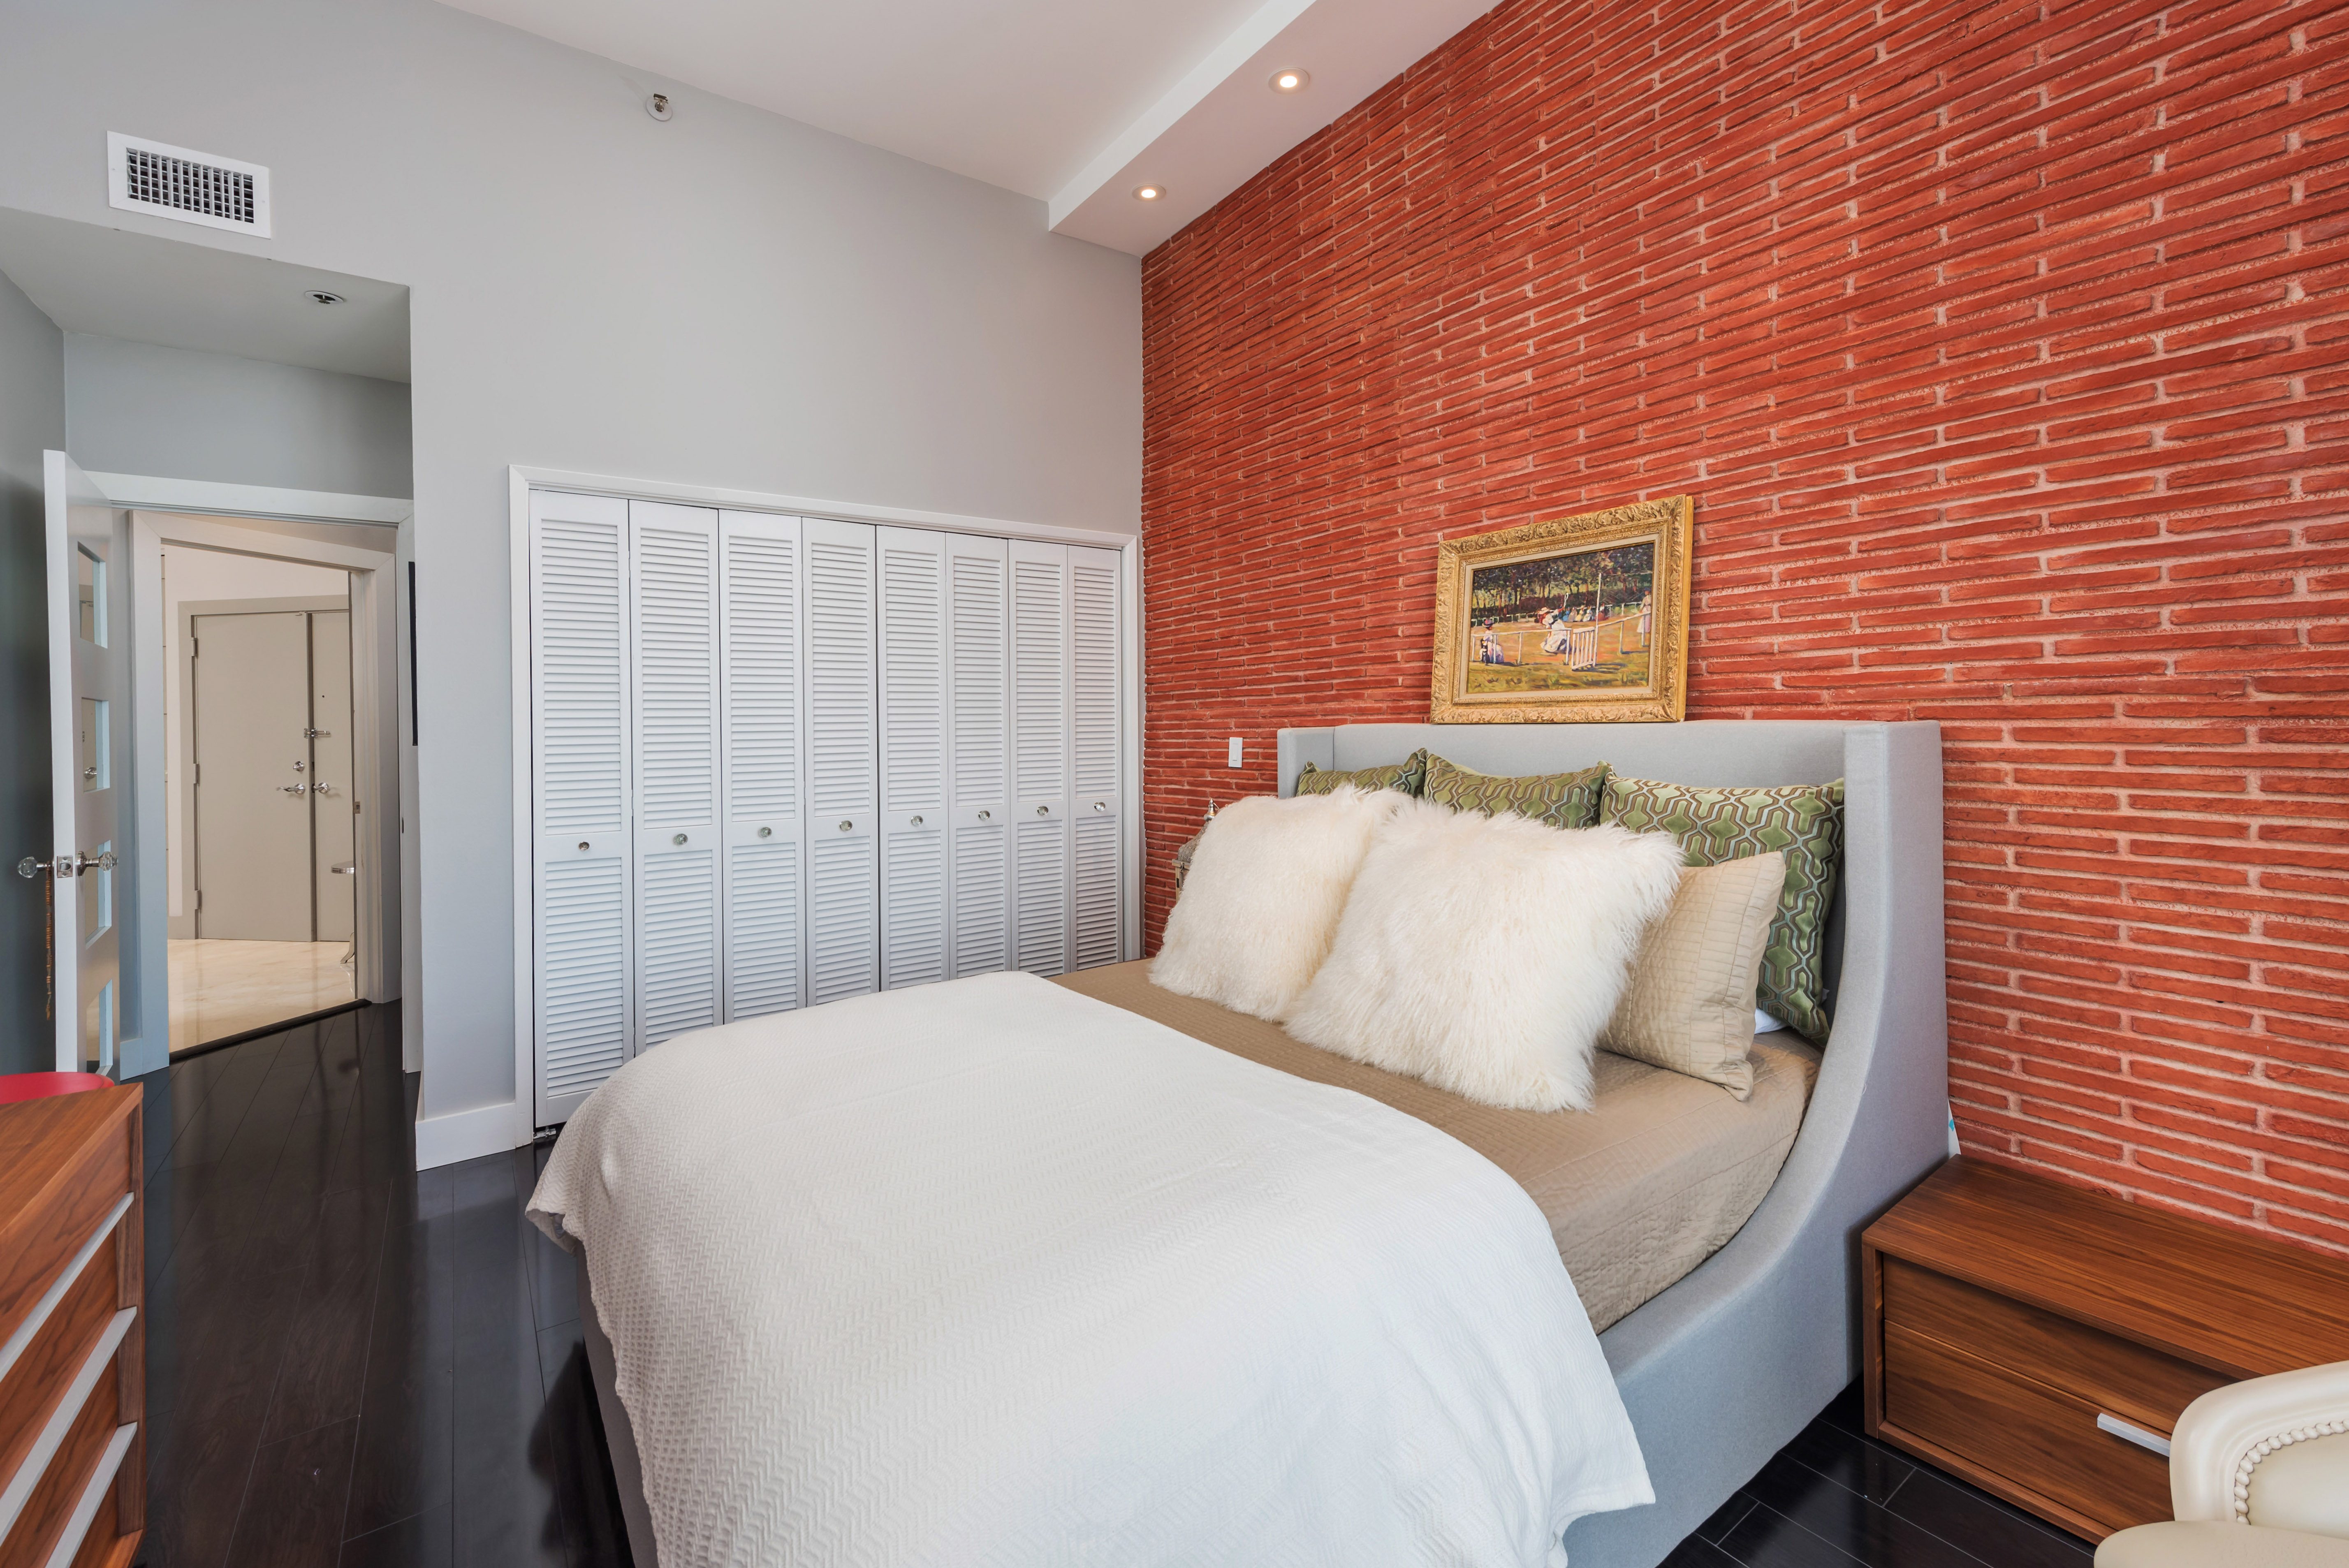
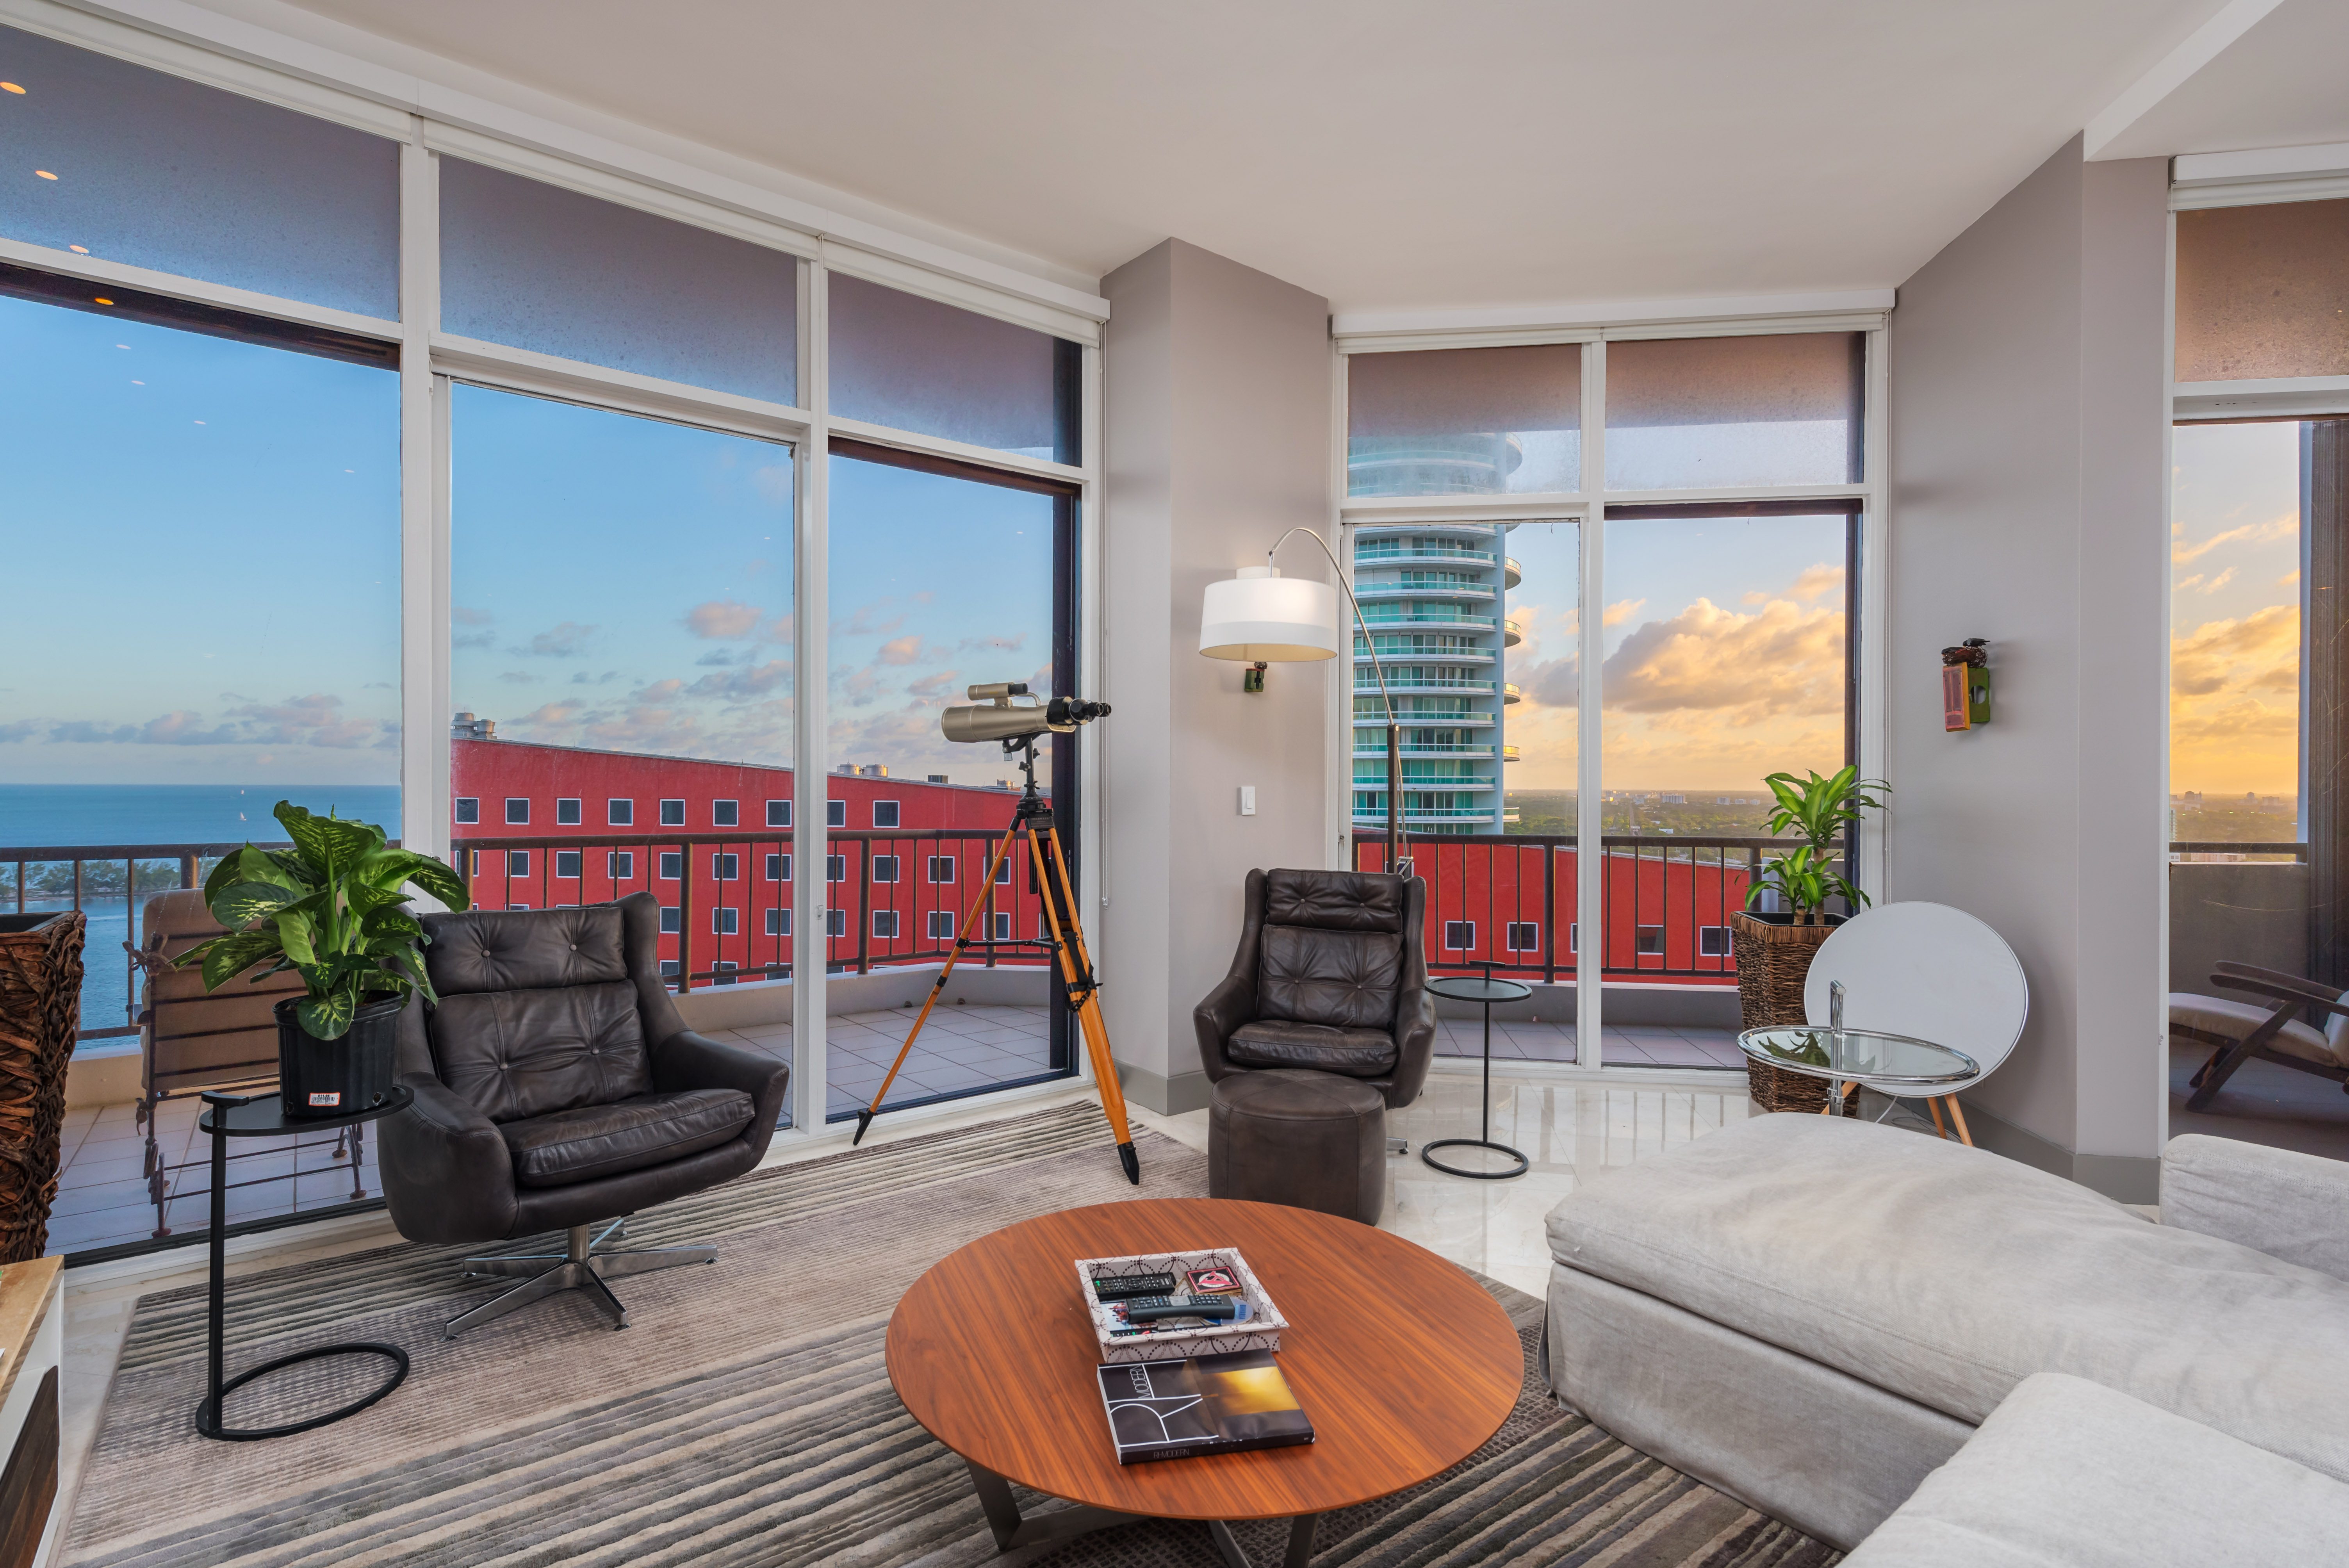
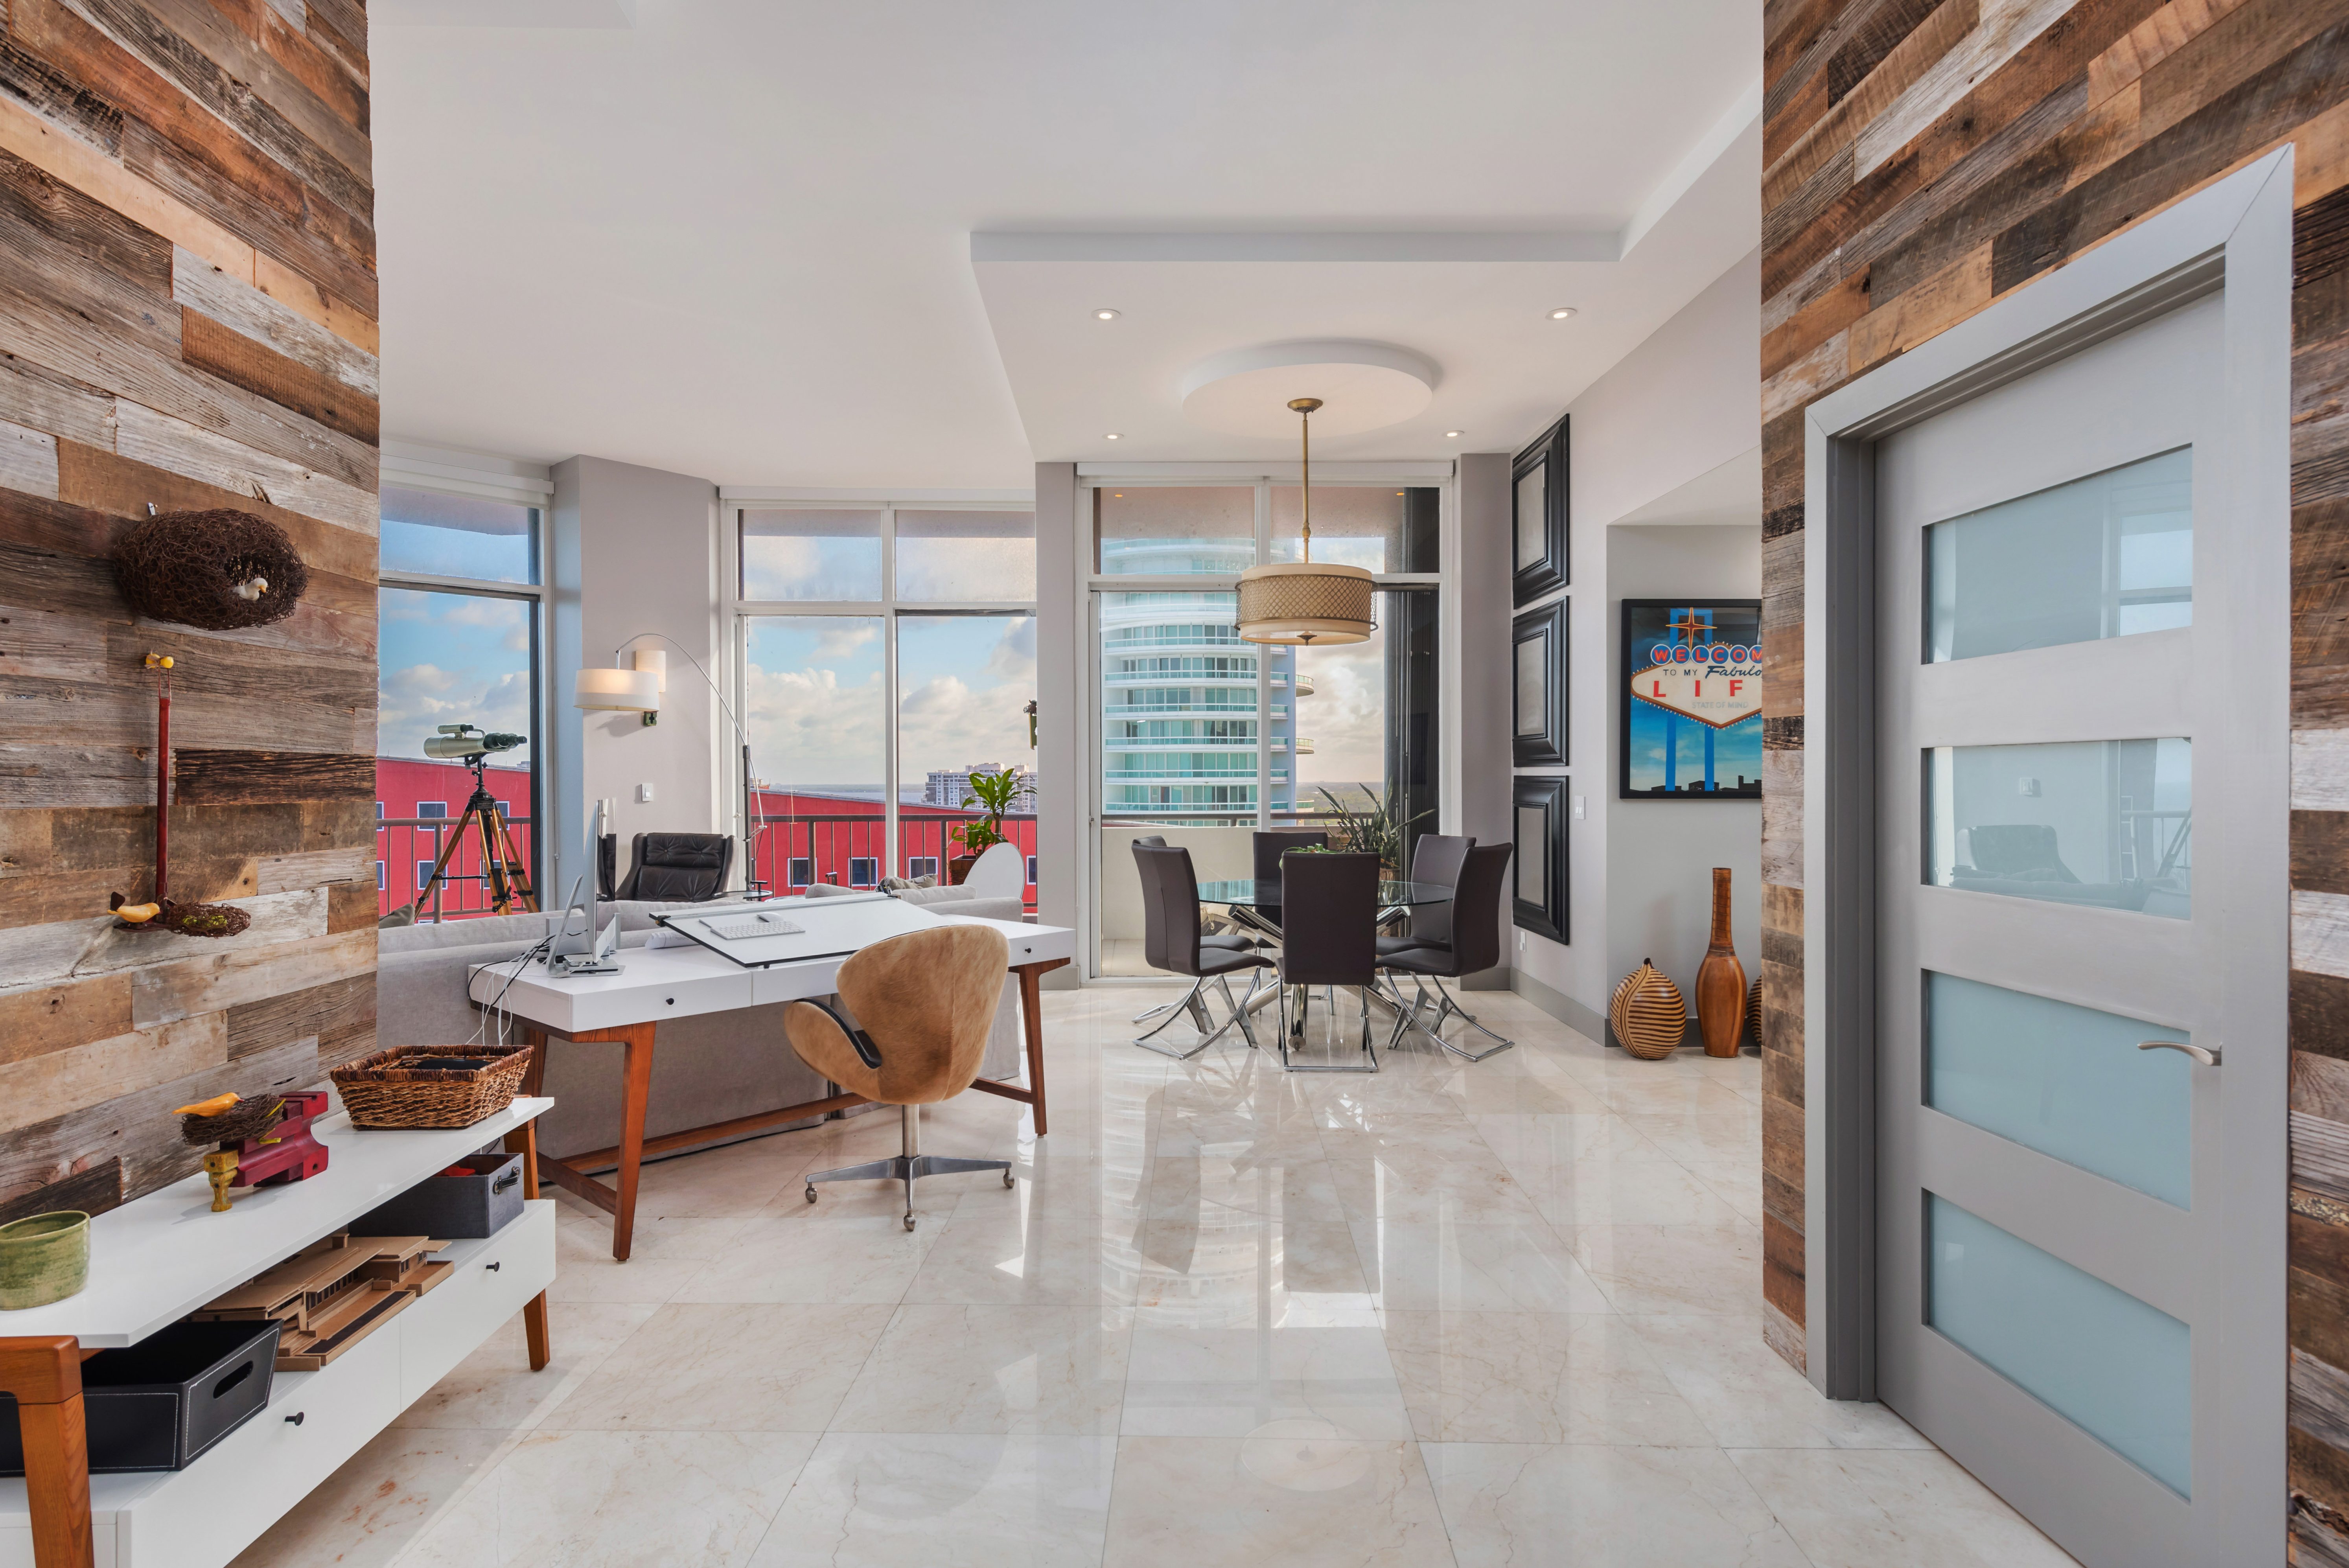
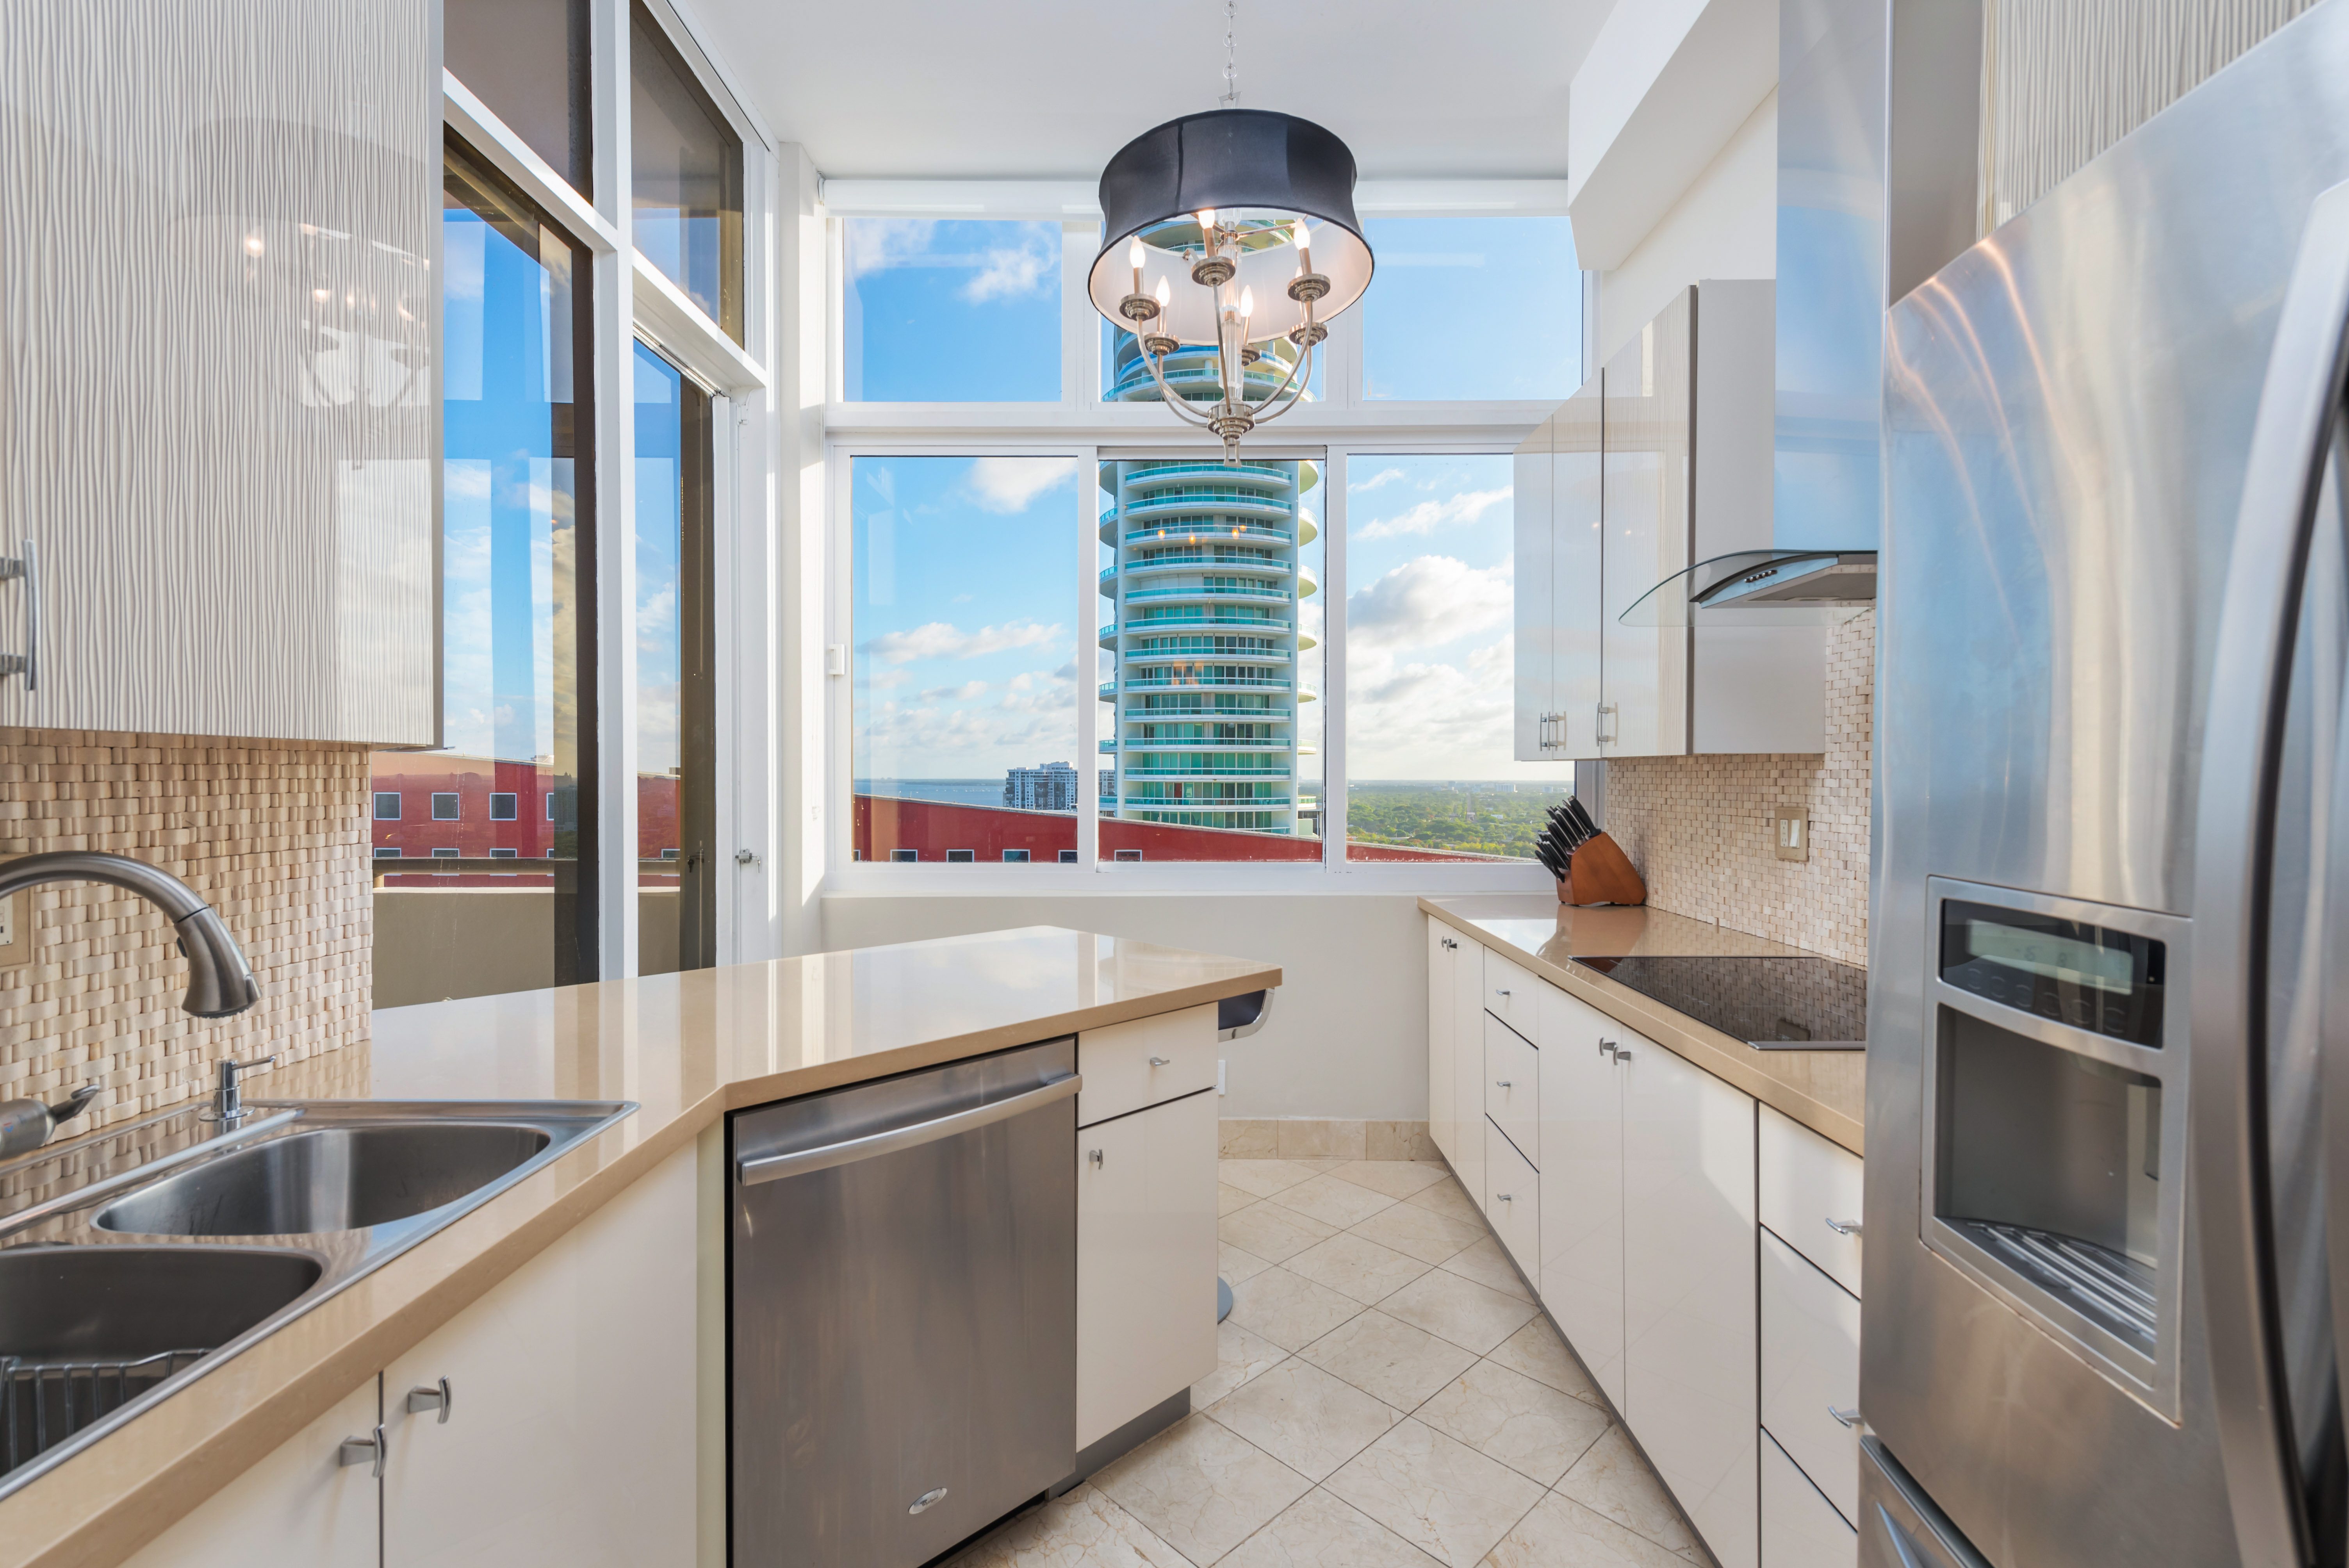
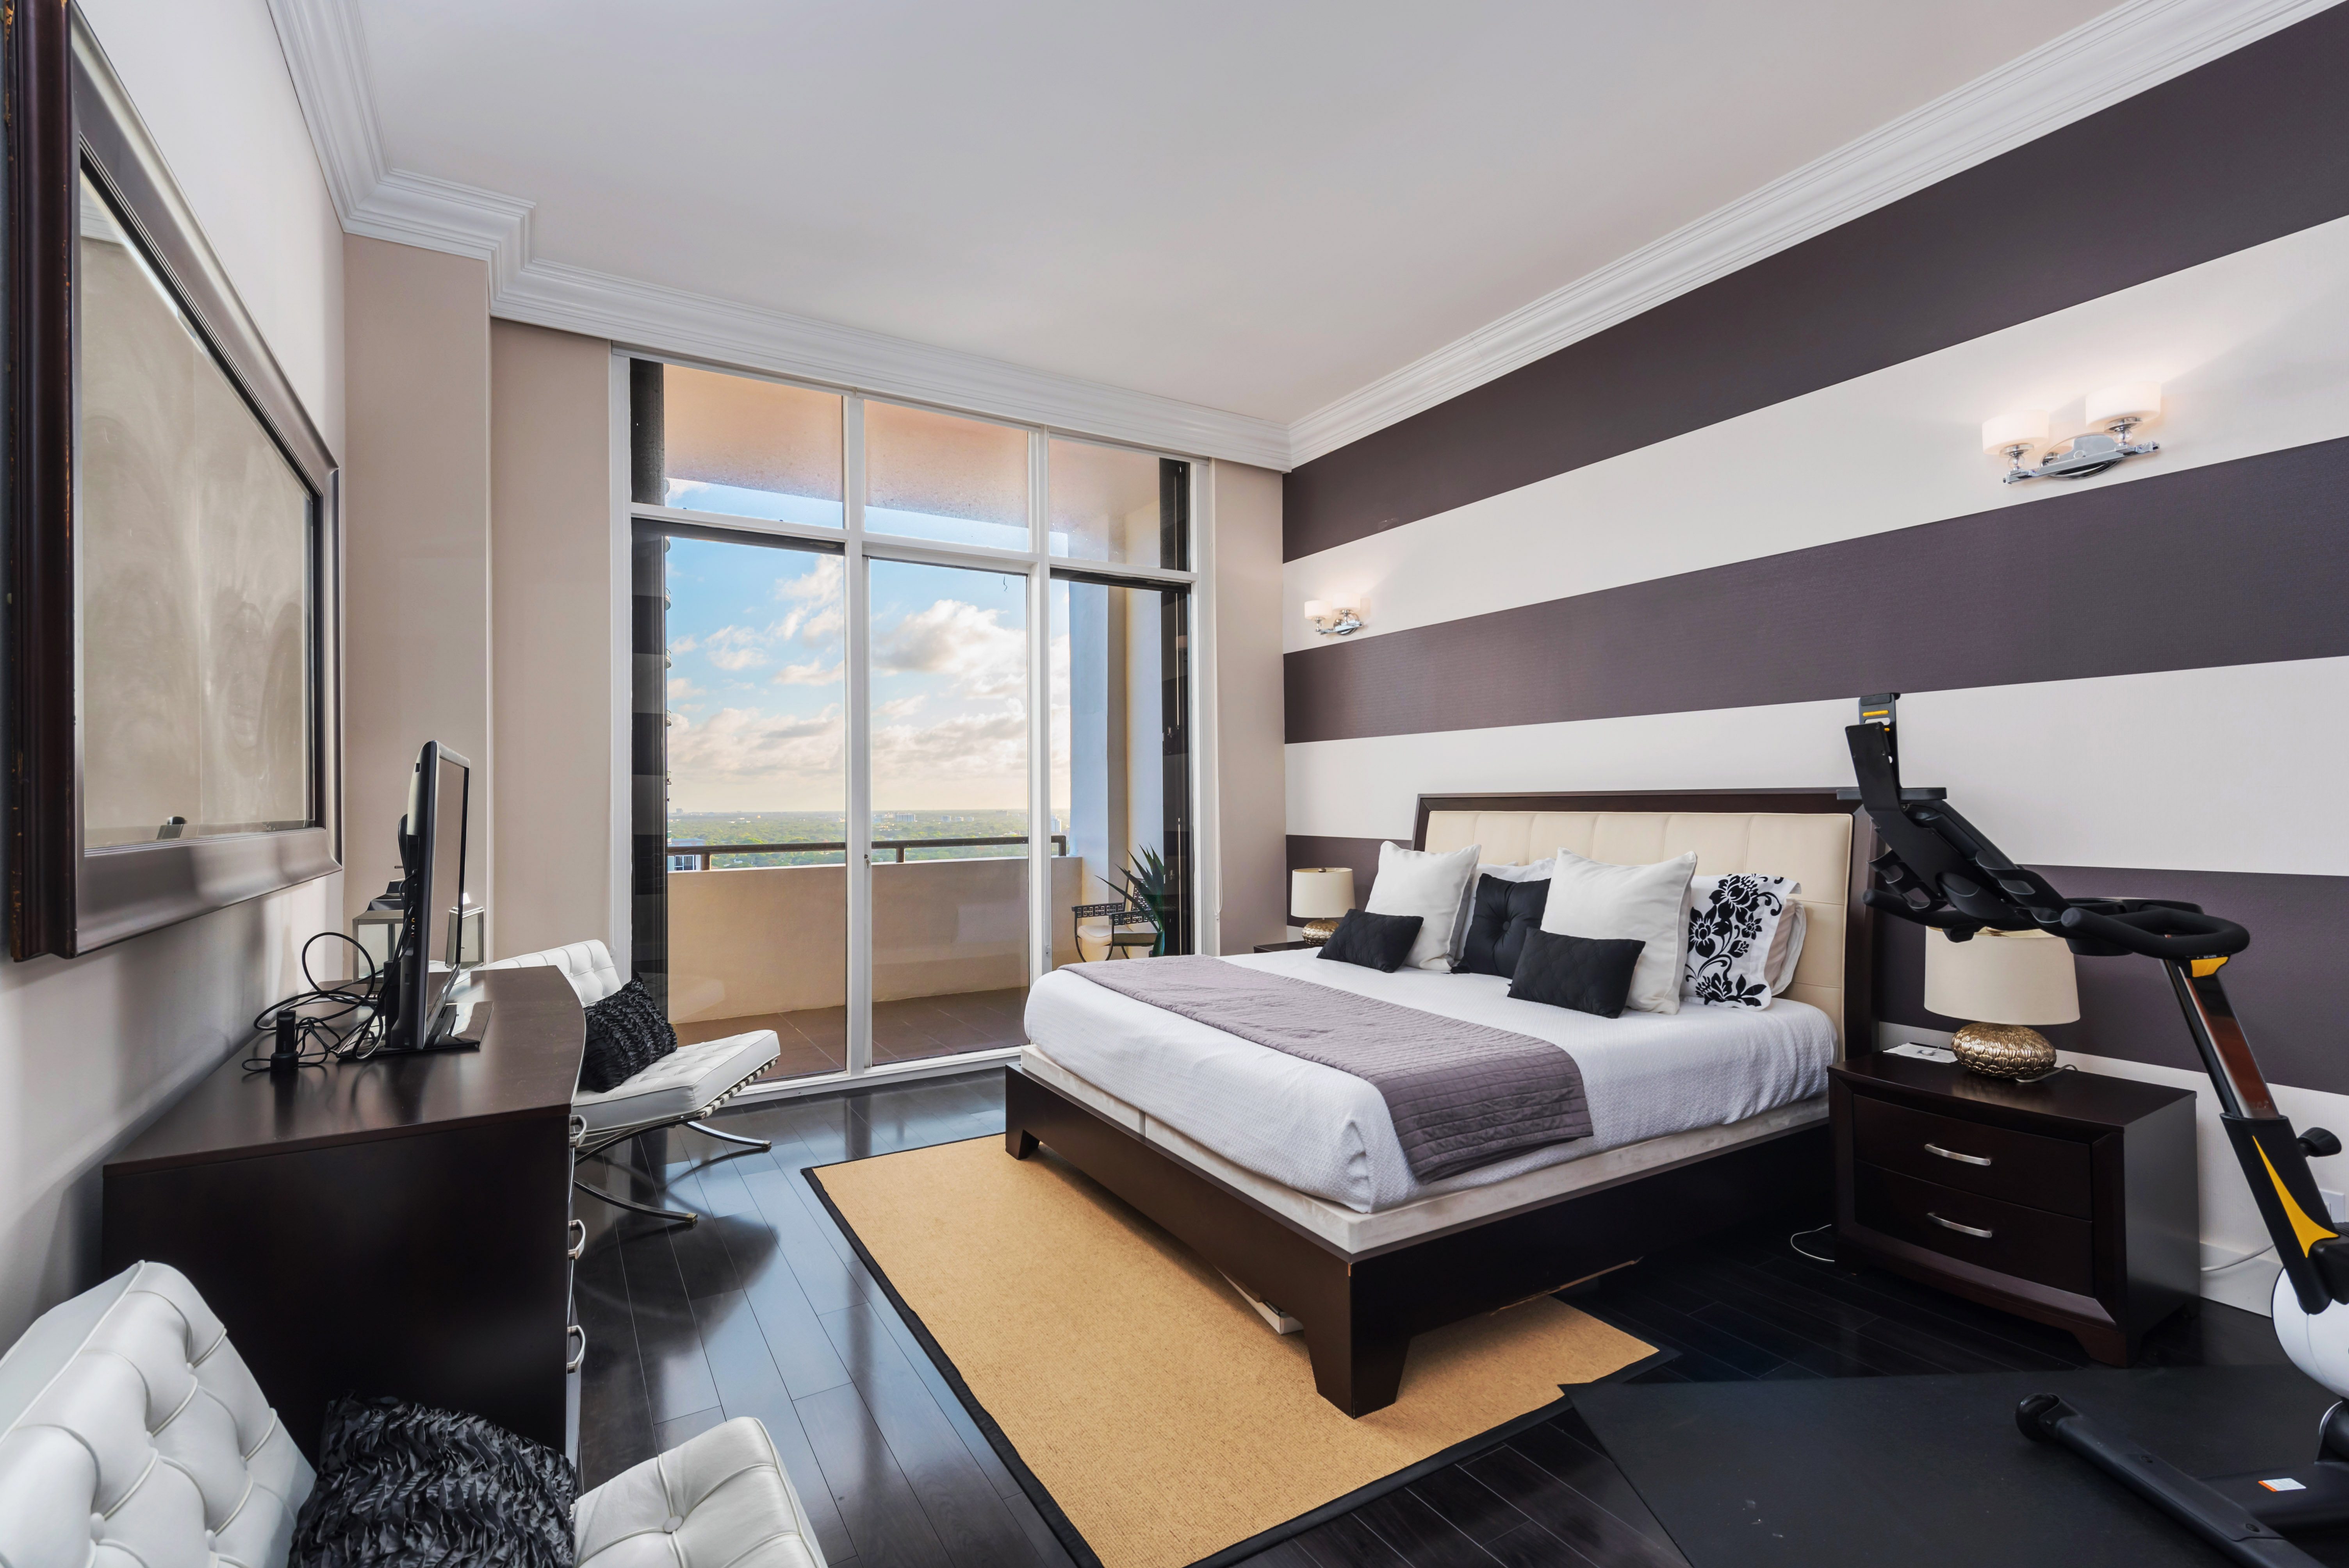
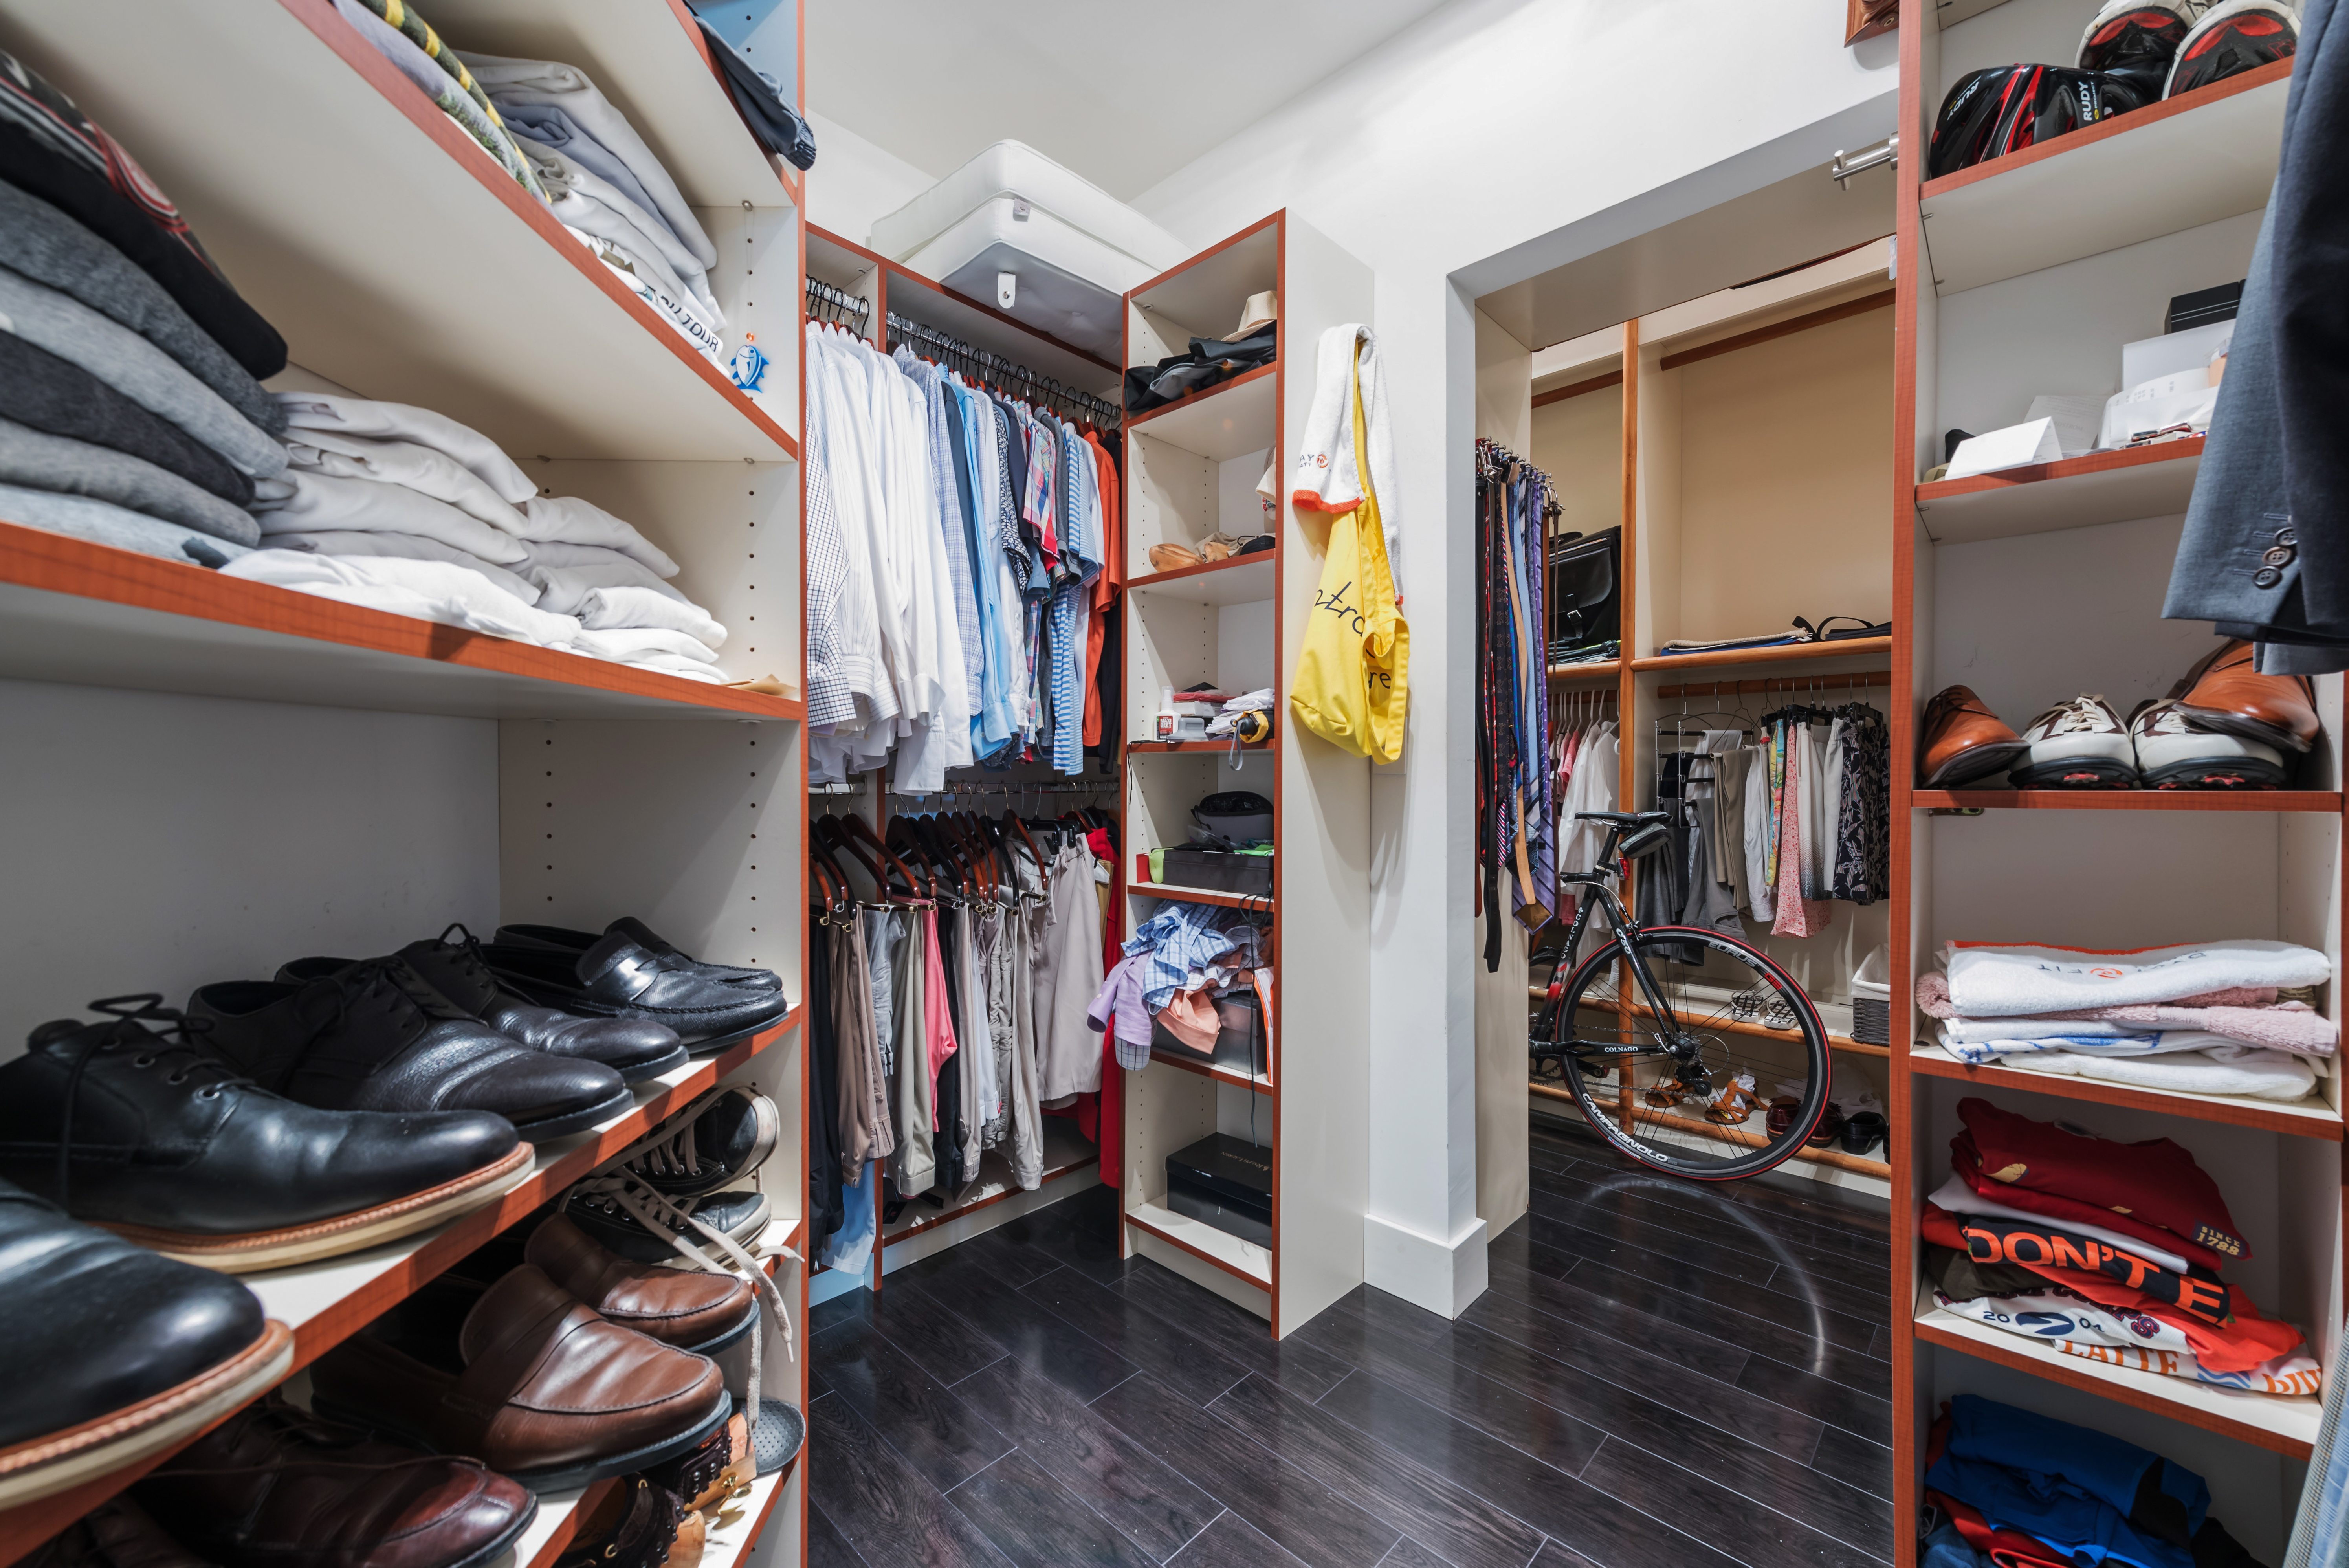
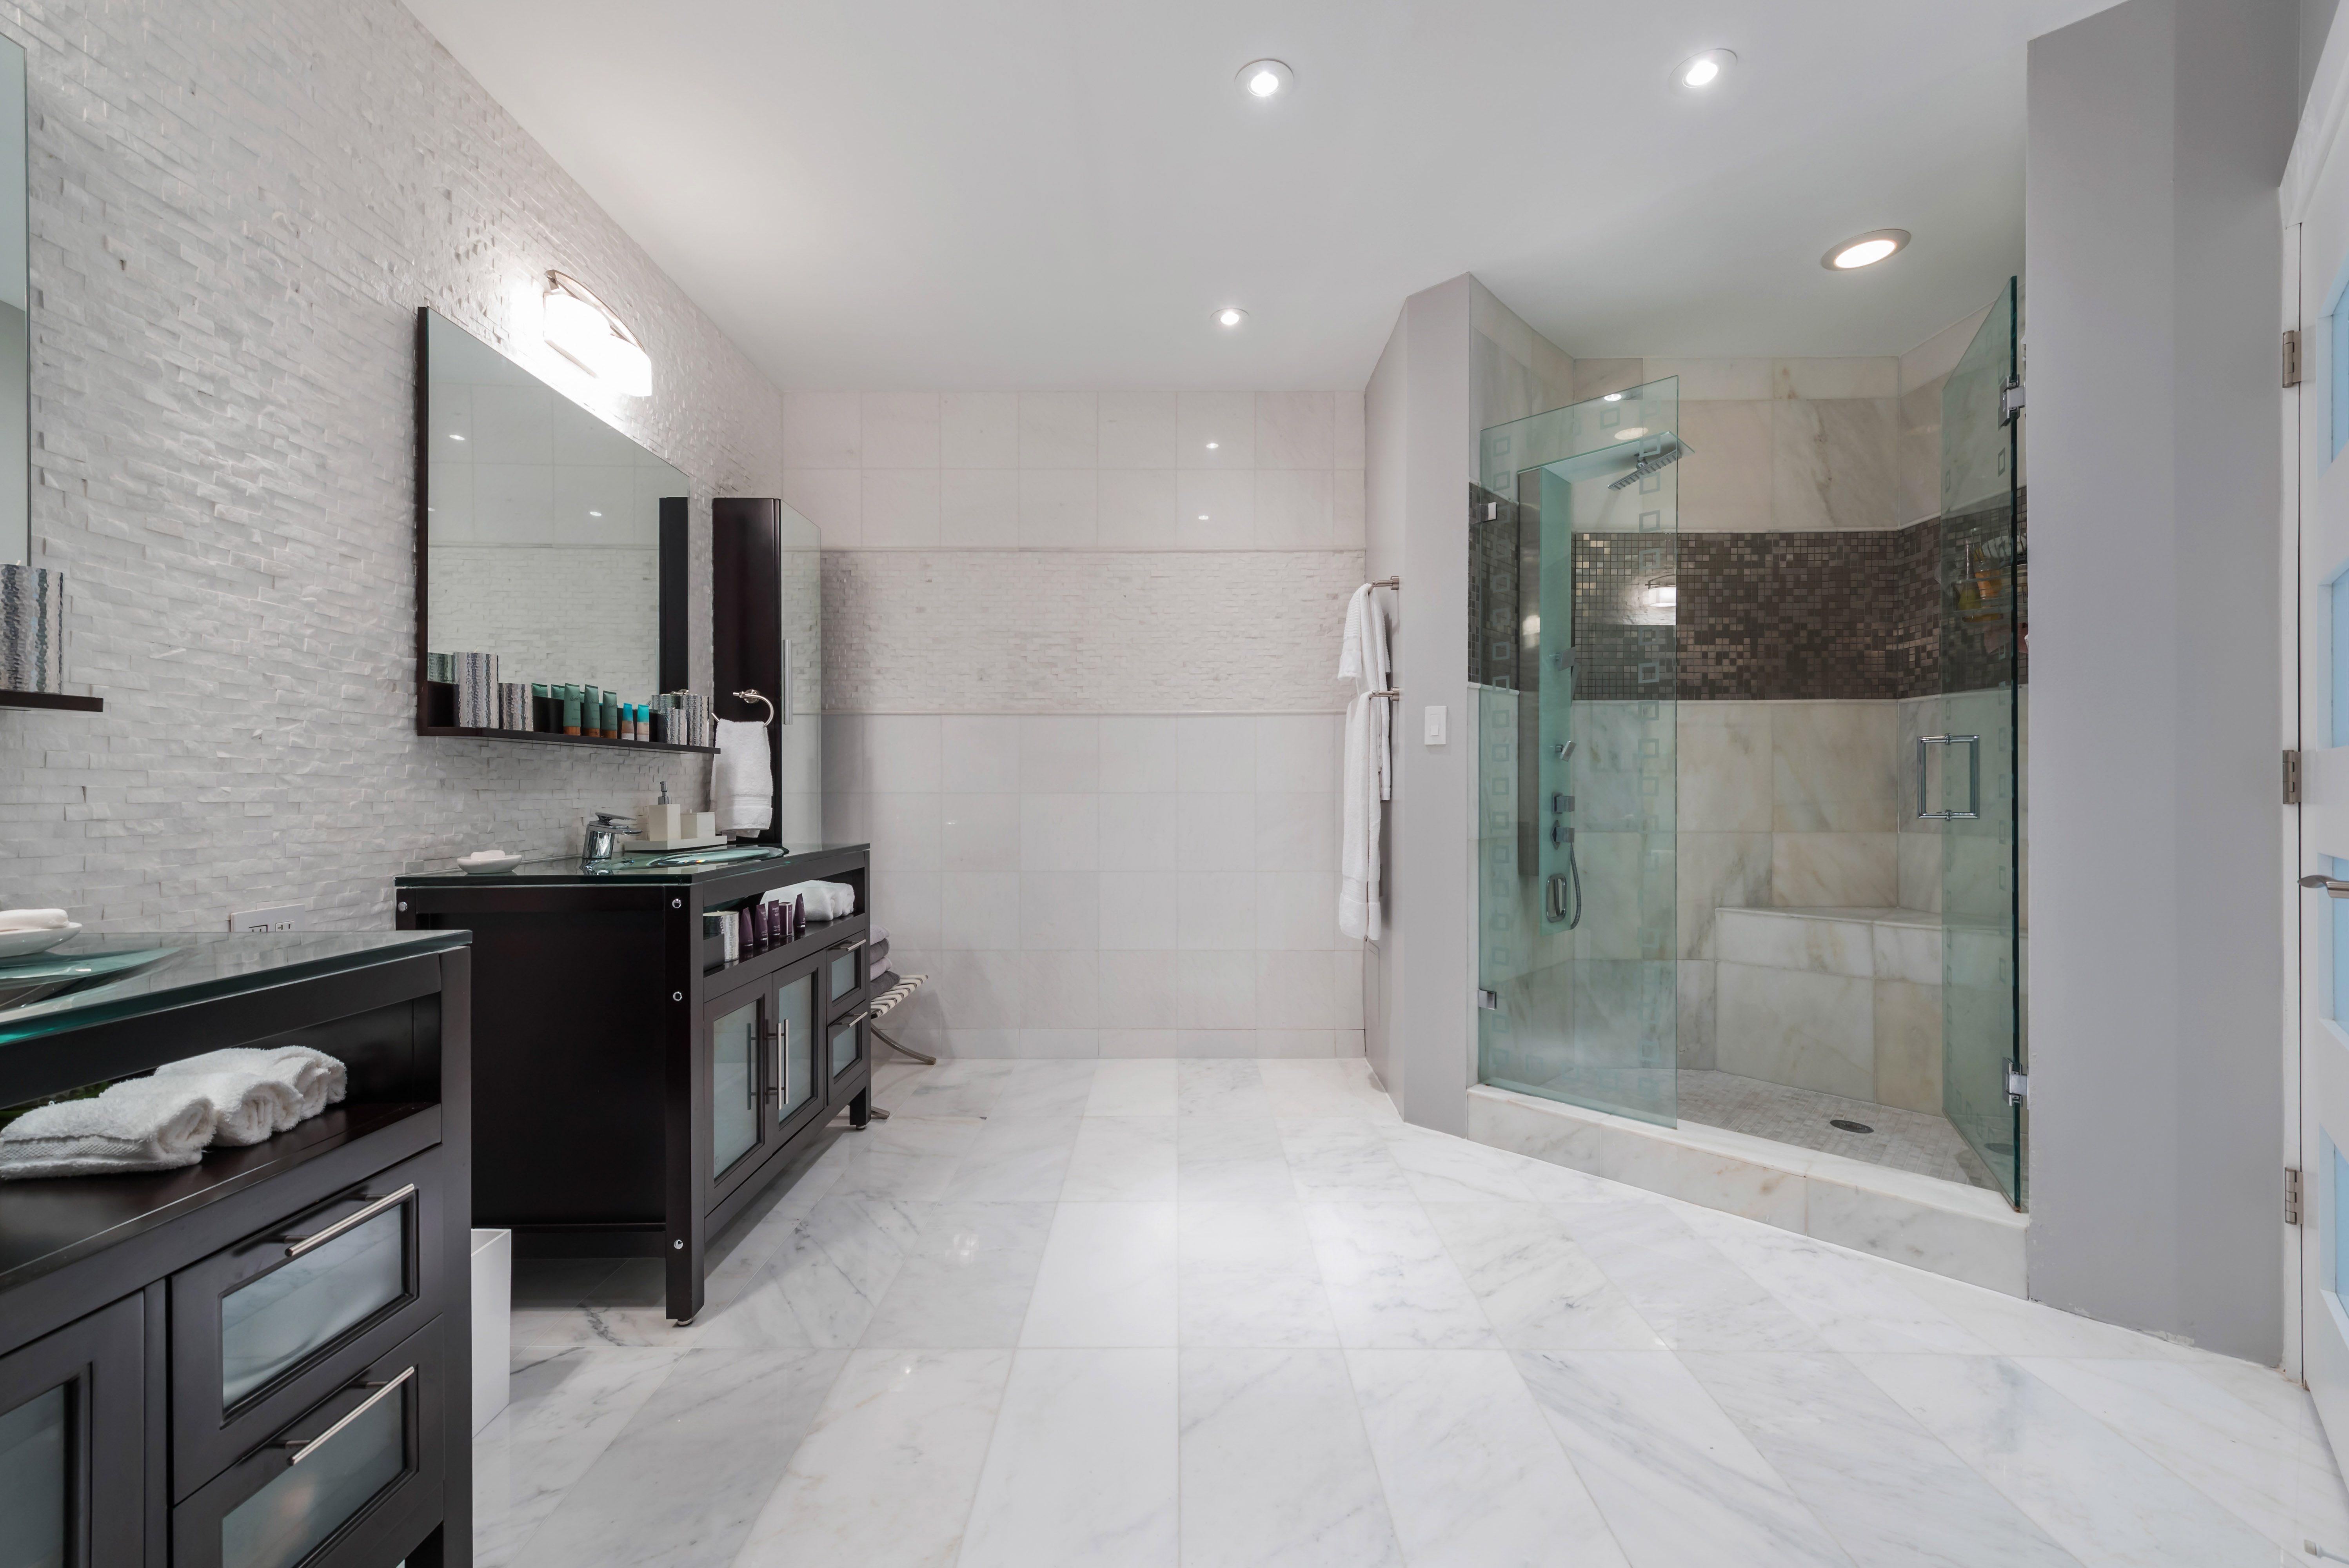
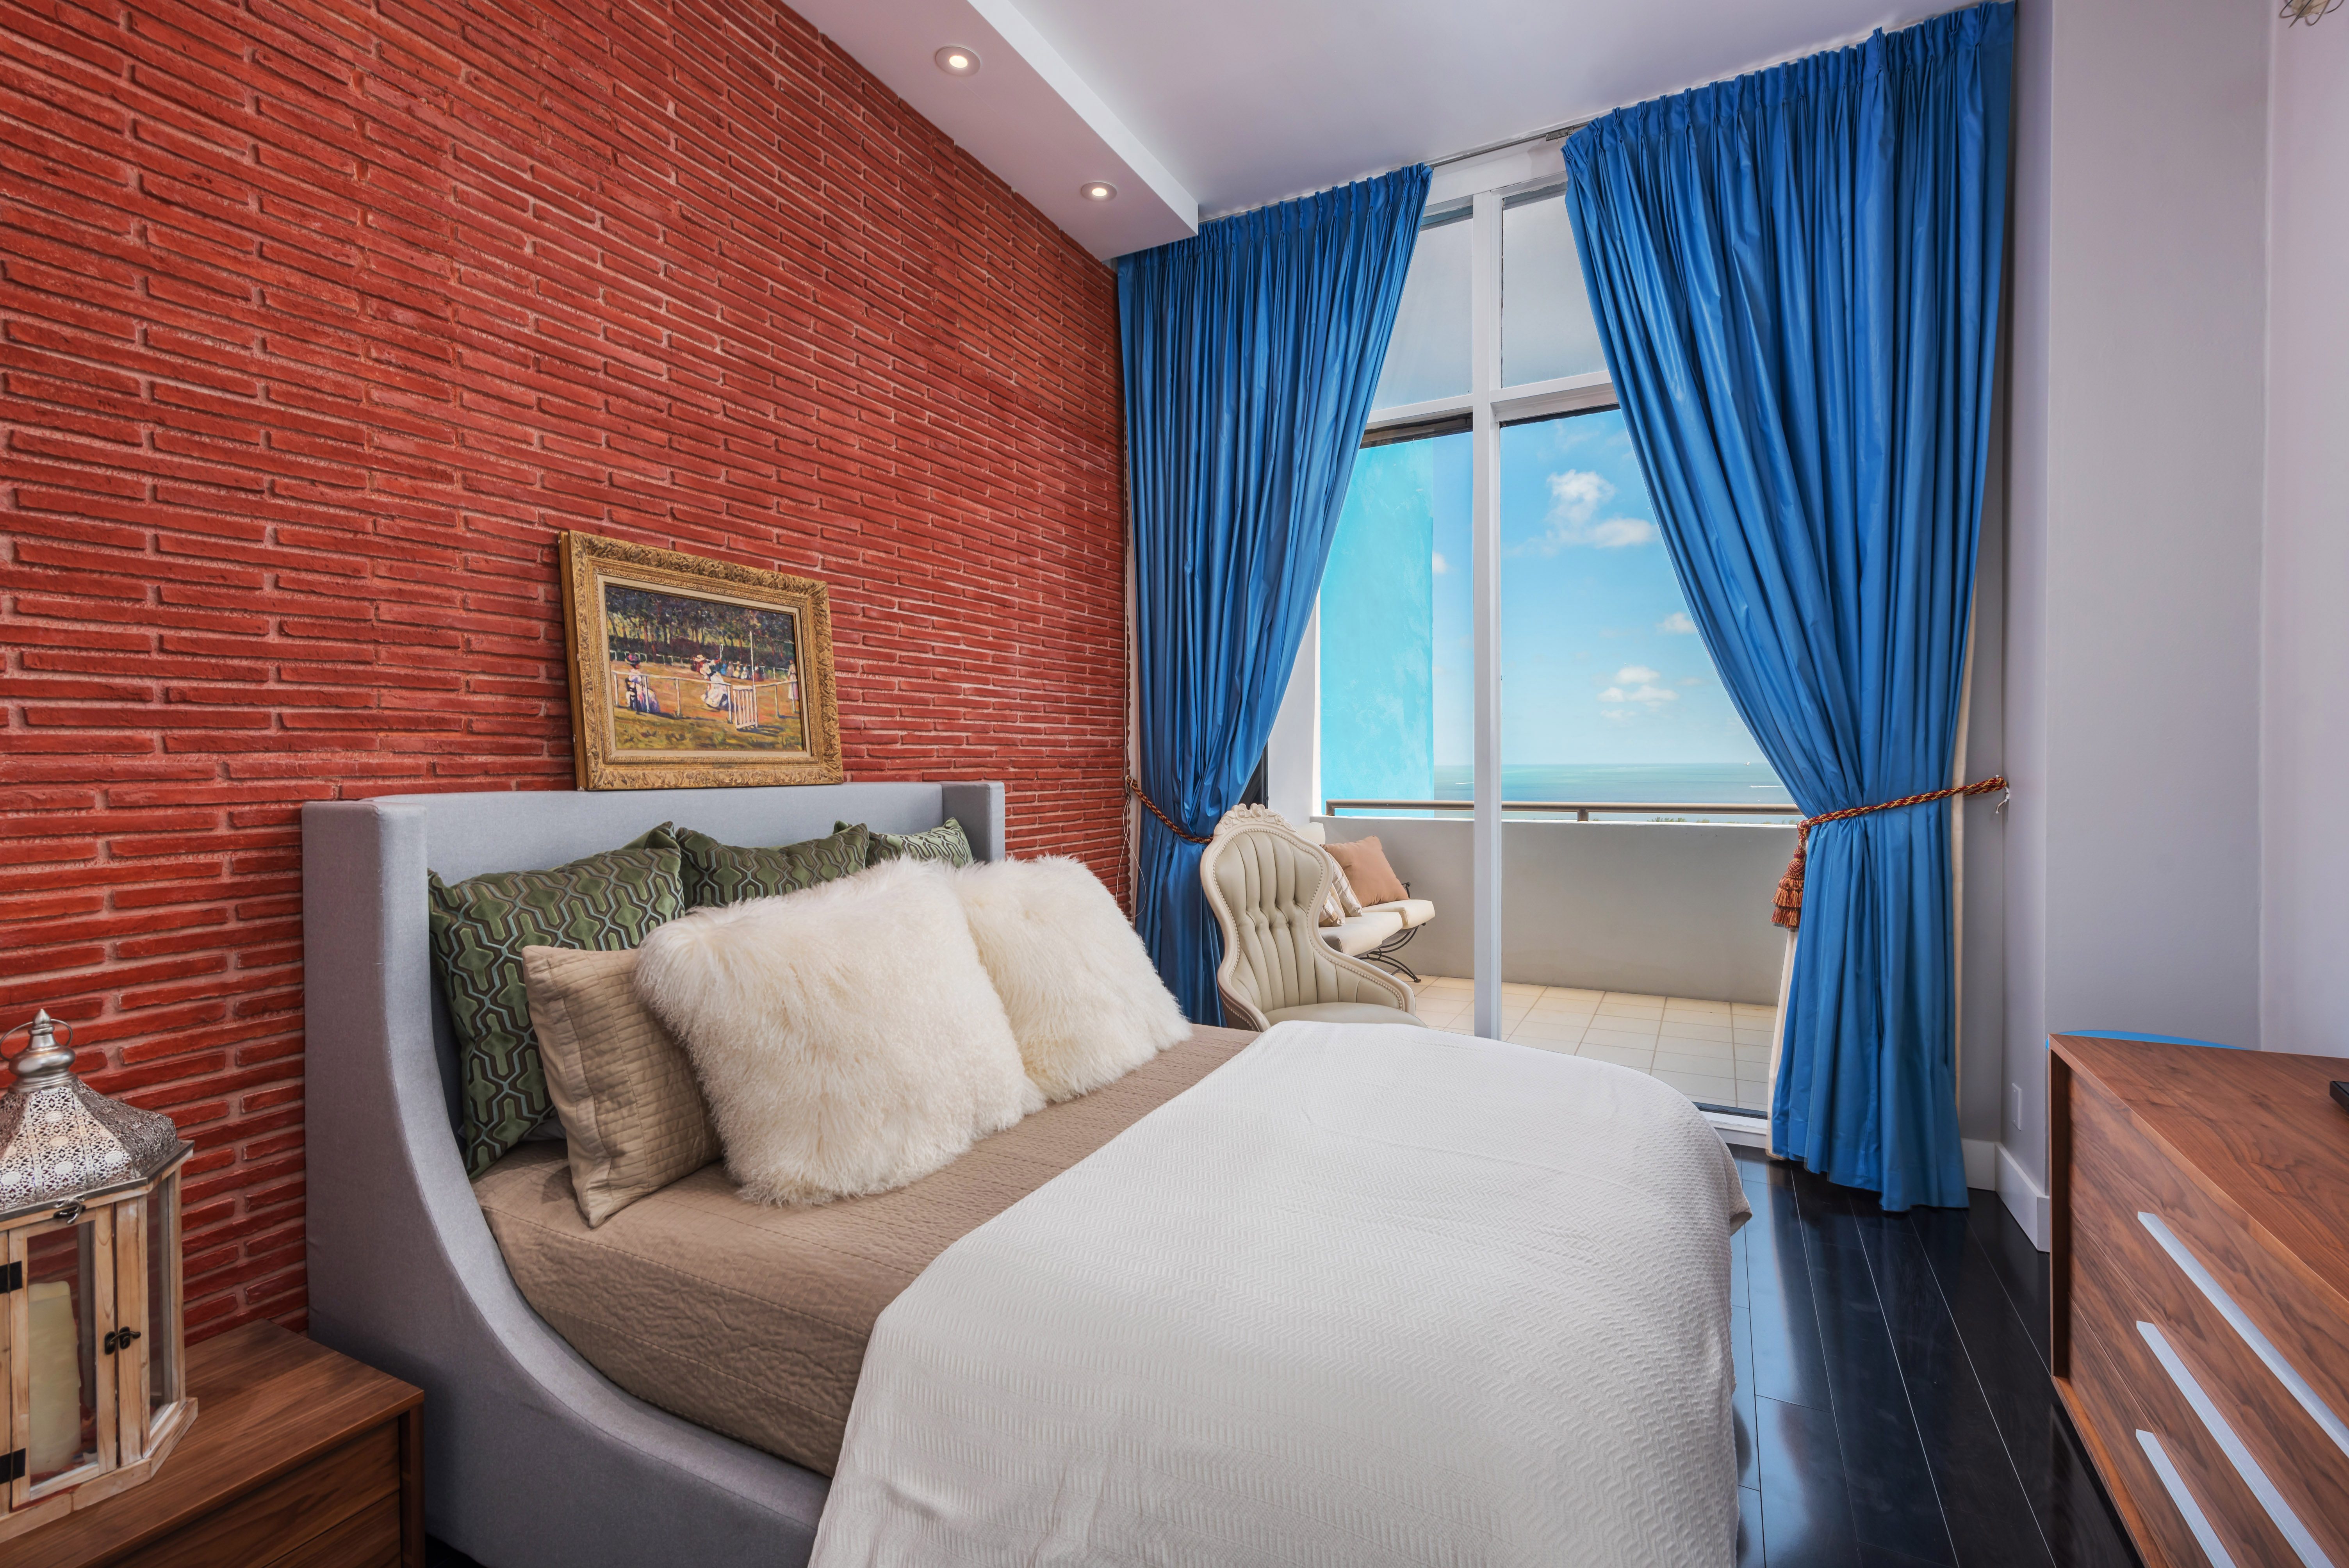
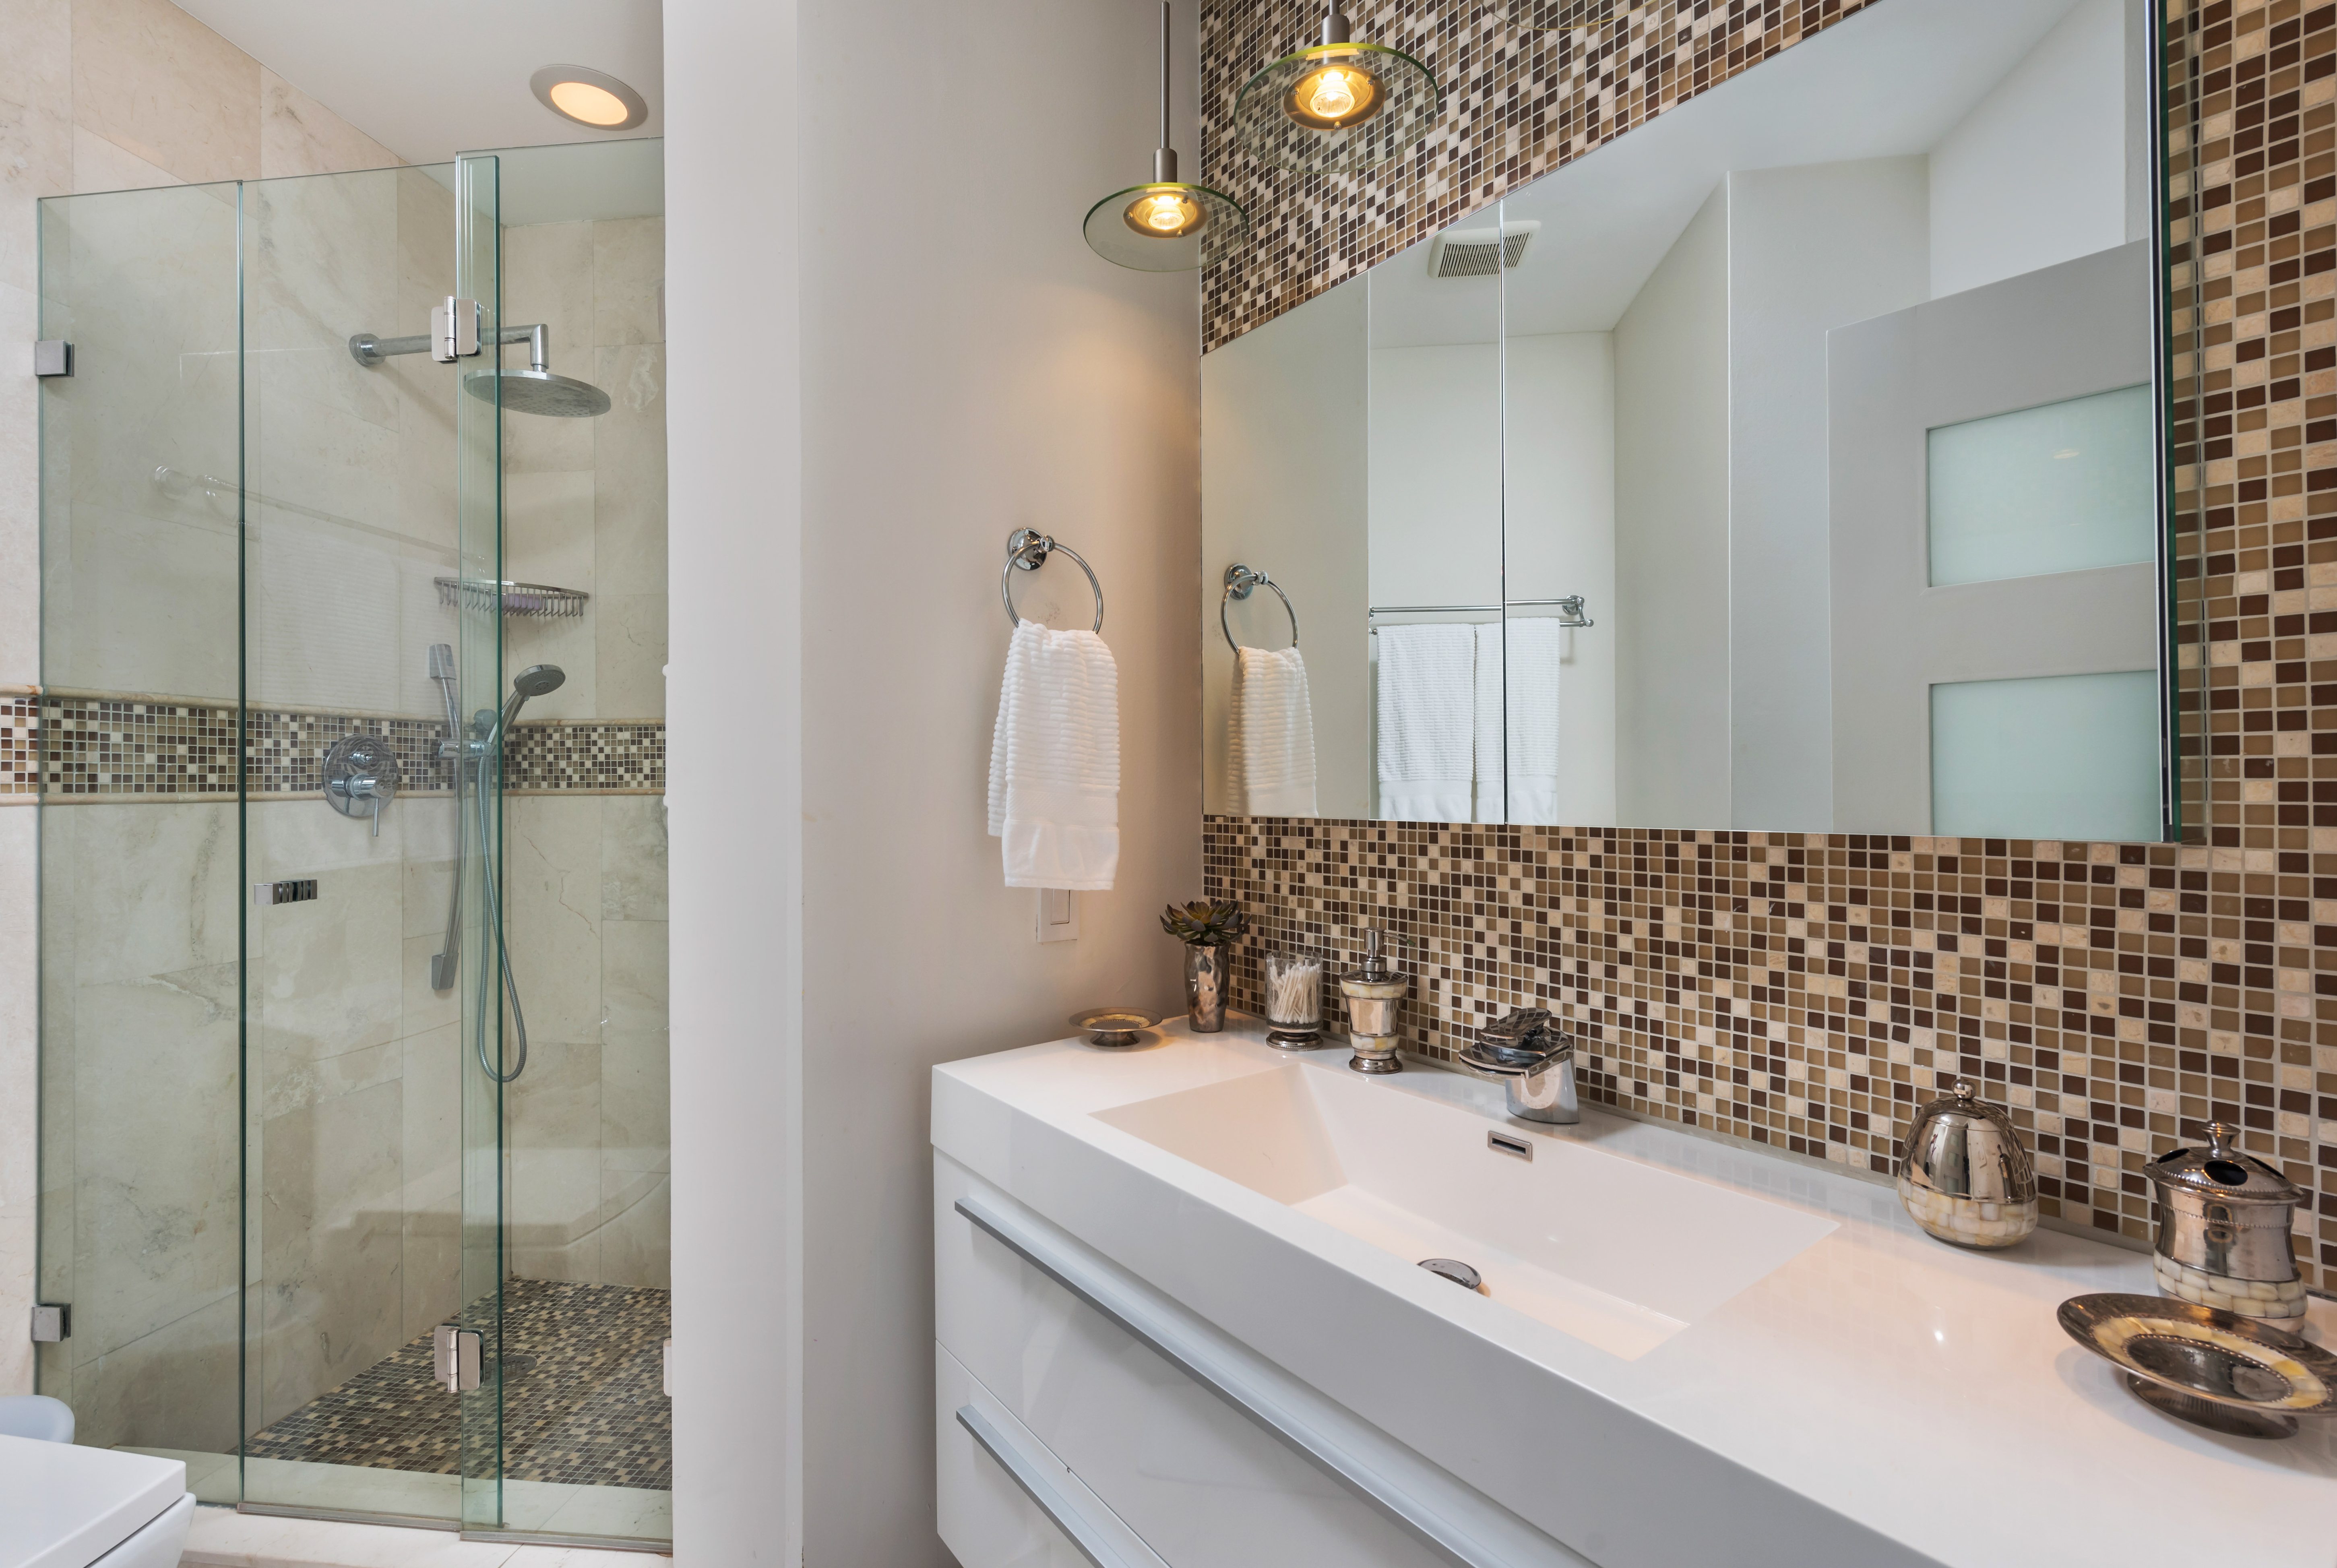
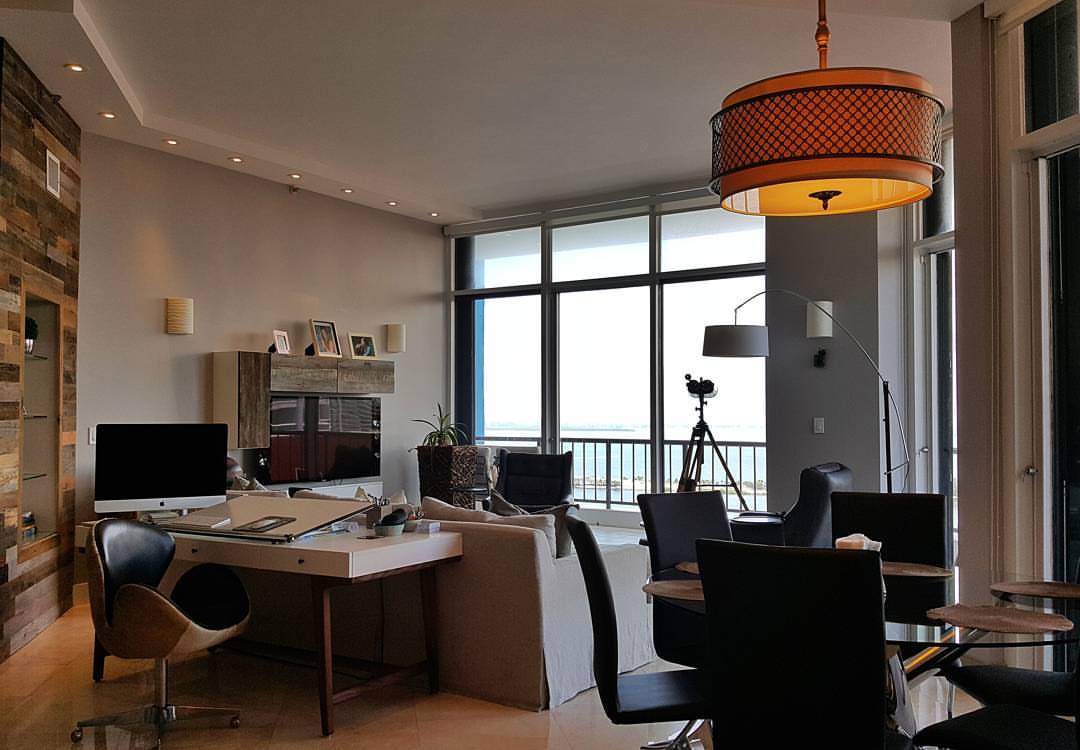
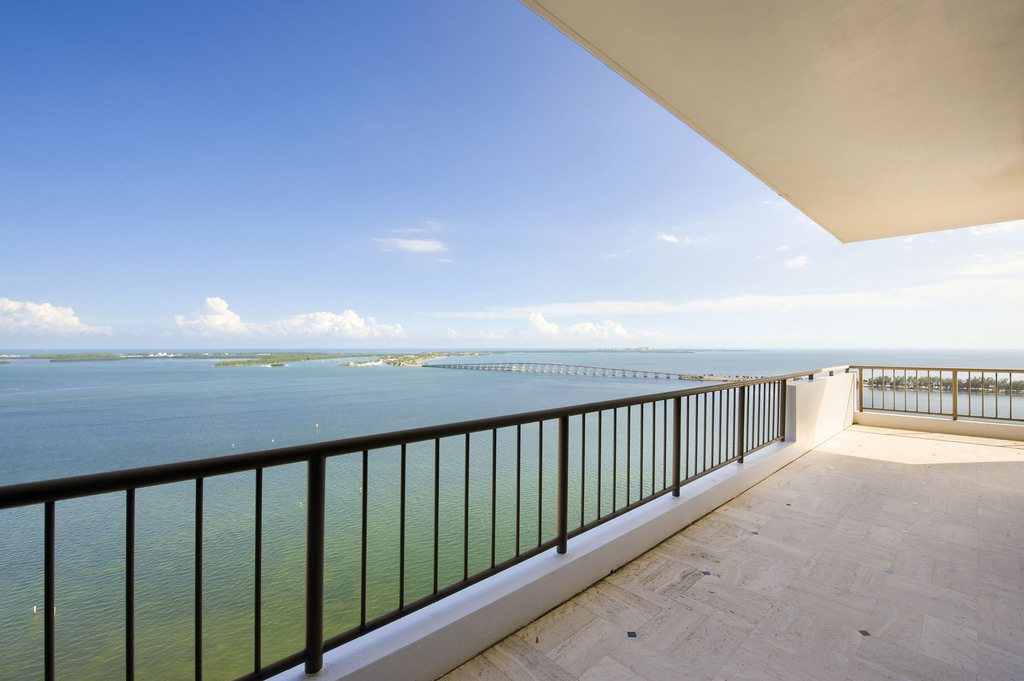
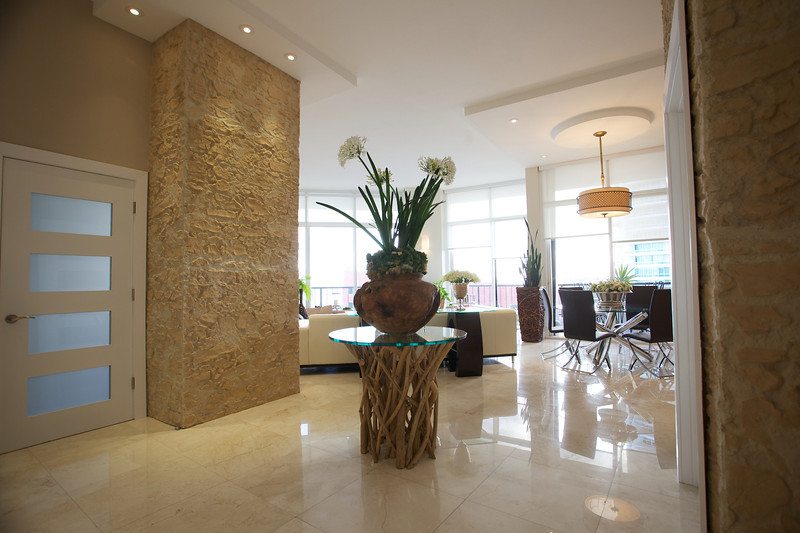
I am pleased to announce that I’ve listed for sale an exceptional and very spacious lower penthouse condo at the iconic Villa Regina located at 1581 Brickell Avenue. It’s a fully furnished and fully renovated 2 bedroom, 2 bath unit with 1,895 interior square feet, 400 square feet of balcony, lots of closet space, and 11-foot high ceilings with floor-to-ceiling glass windows. It has marble floors in the living room and bathrooms, wood floors in the bedrooms, custom millwork, custom lighting, custom doors, front-loading washer and dryer, stainless steel appliances, and Nest Thermostat. It also offers tons of natural light along with breathtaking water and sunset views. This exquisitely designed residence is a true “home” in every sense of the word!
The master bedroom suite is exceptionally roomy with over 500 square feet including its own private balcony; large, walk-in closet; linen closet; and fully renovated bathroom with white marble floors, double vanities, and tiled stone walls.
The second bedroom has balcony access, built-in closets, and its own fully renovated bathroom.
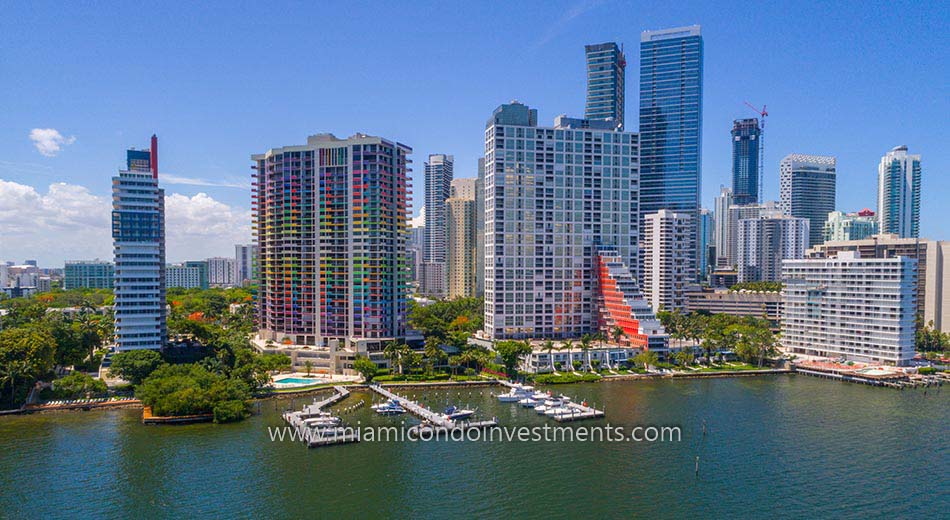
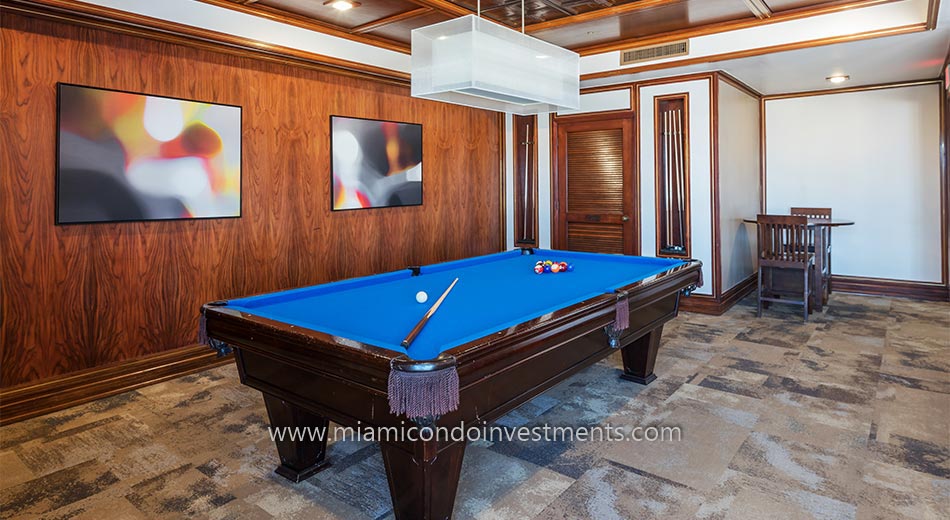
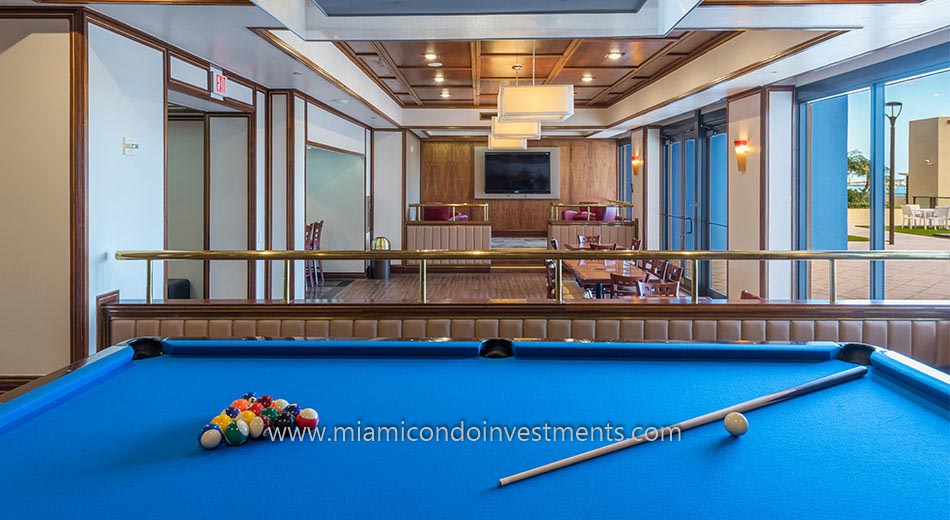
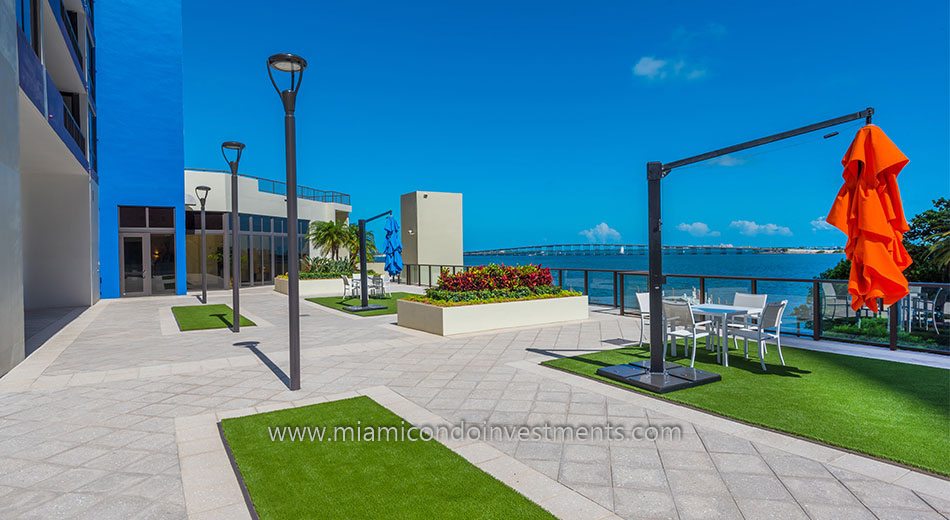
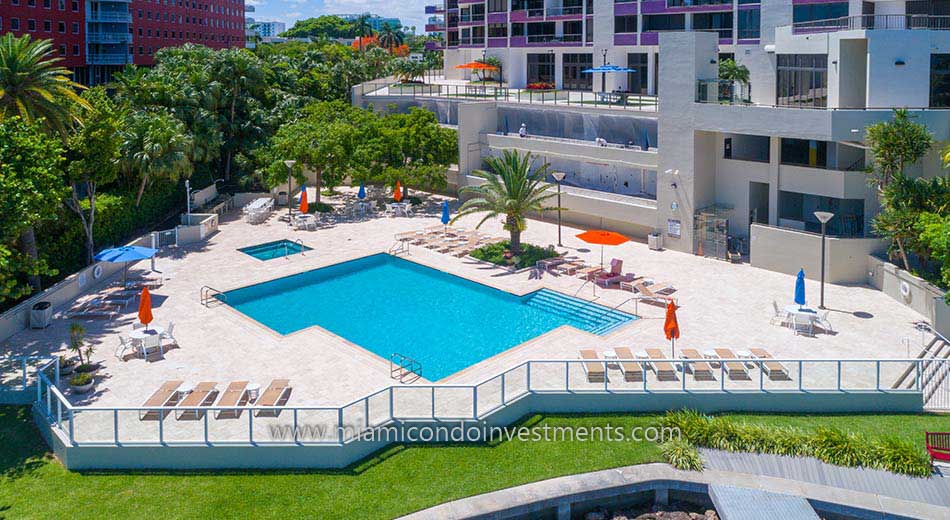
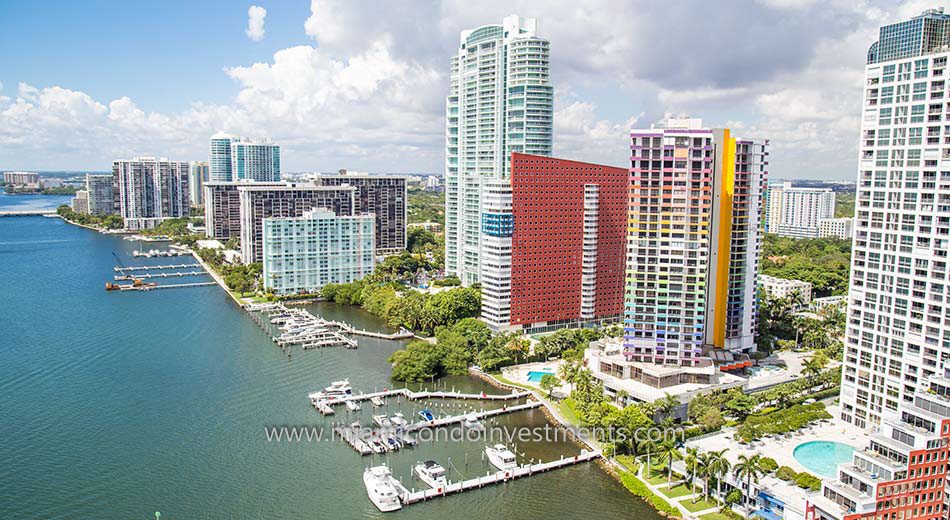
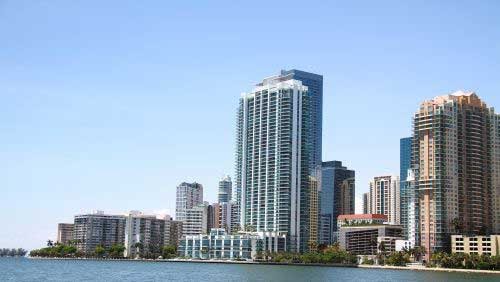
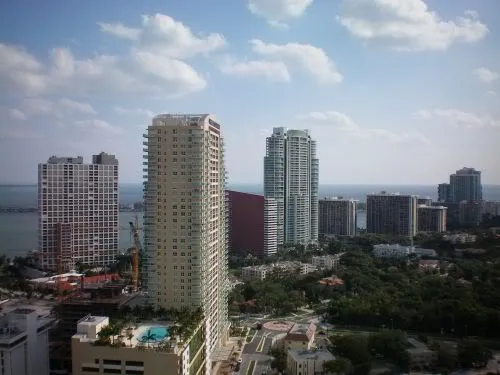
Below is an HD video of the property including aerial footage of Villa Regina. The building was completed in 1982 but recently underwent a number of renovation projects. For example, the lobby, fitness center, and spa, which are nearly completed, are currently under renovation; the building was freshly painted within the past two years; and the “Queen’s Room” was remodeled into a children’s playroom. Additionally, a project to rebuild the seawall is expected to begin “very soon” according to management.
The unit includes hurricane shutters plus 1 assigned parking space. The monthly condo dues are $1,447 per month. The asking price is $875,000, making it THE best priced 2 bedroom unit in the entire building. The last time that this property hit the market, which was in 2013, it received 3 offers and went under contract in 2 weeks. Since listing the property this past Sunday night, I’ve gotten a lot of interest and expect that it won’t last long.
Five Things You May Not Know About Villa Regina
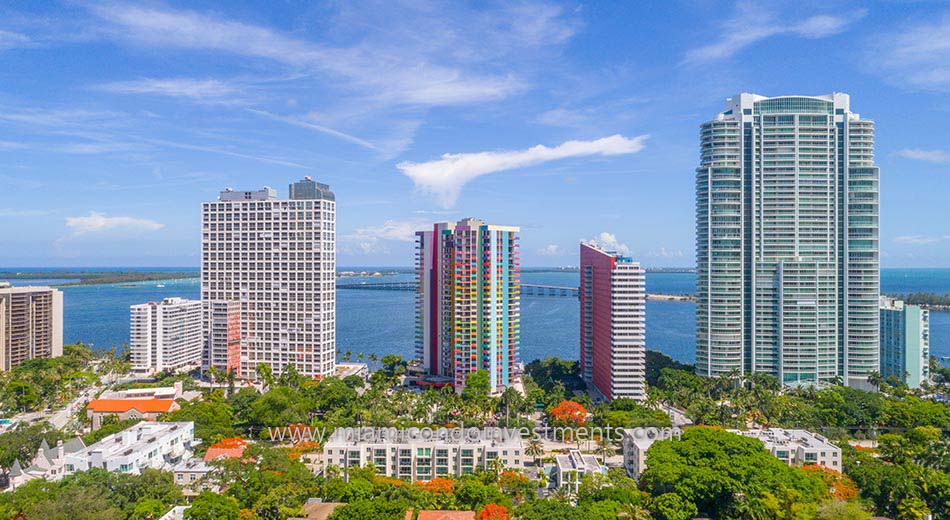
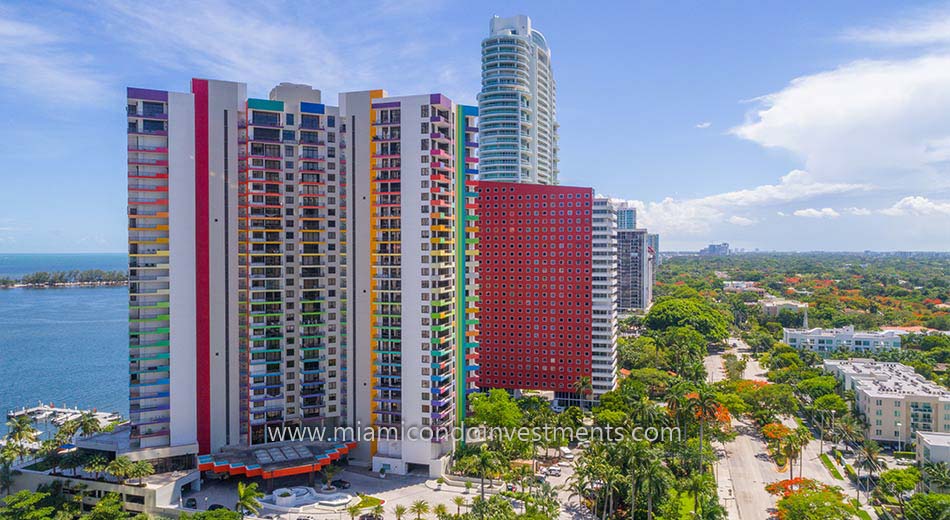
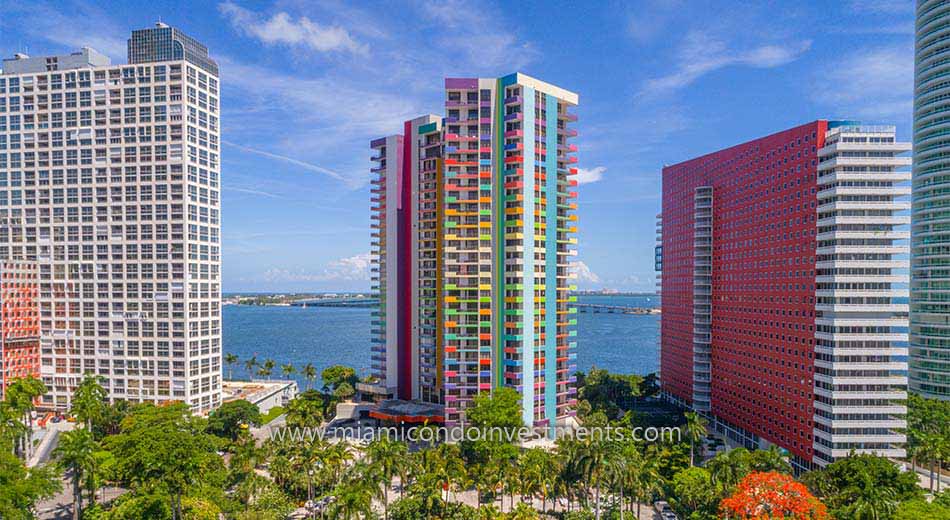
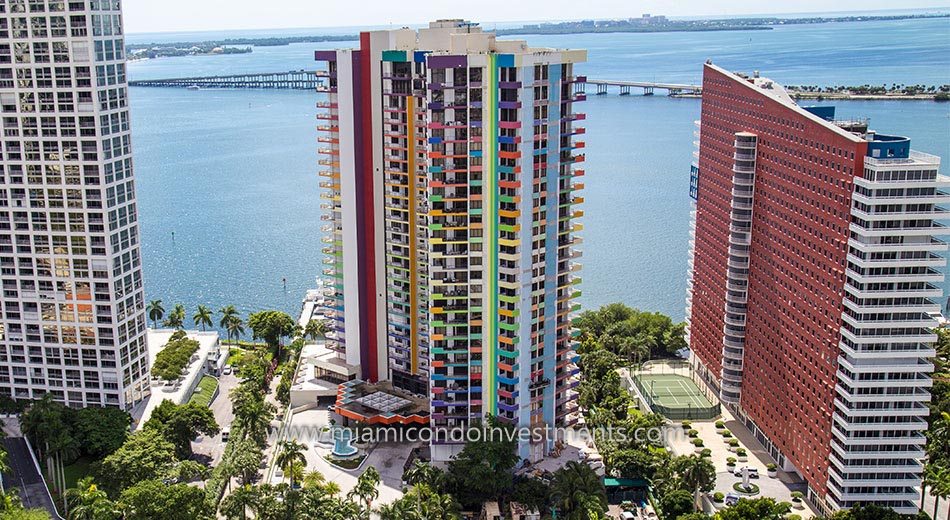
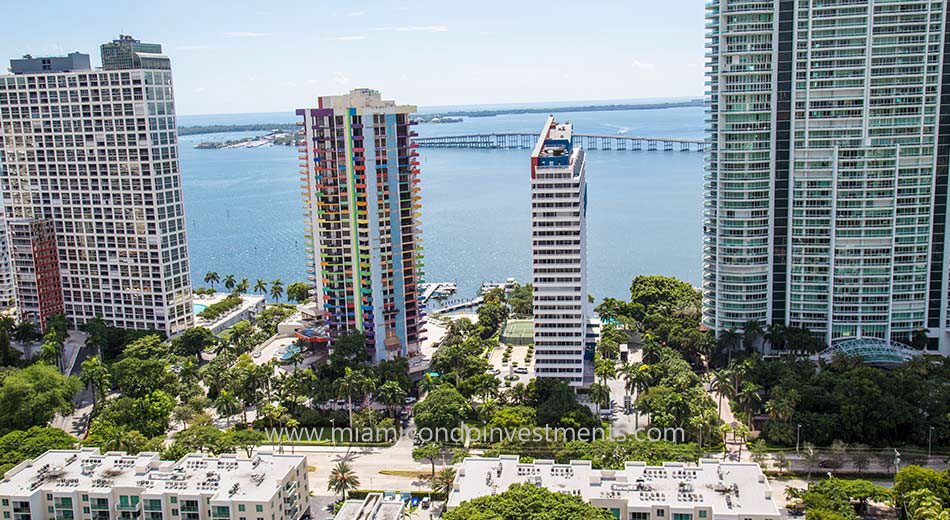
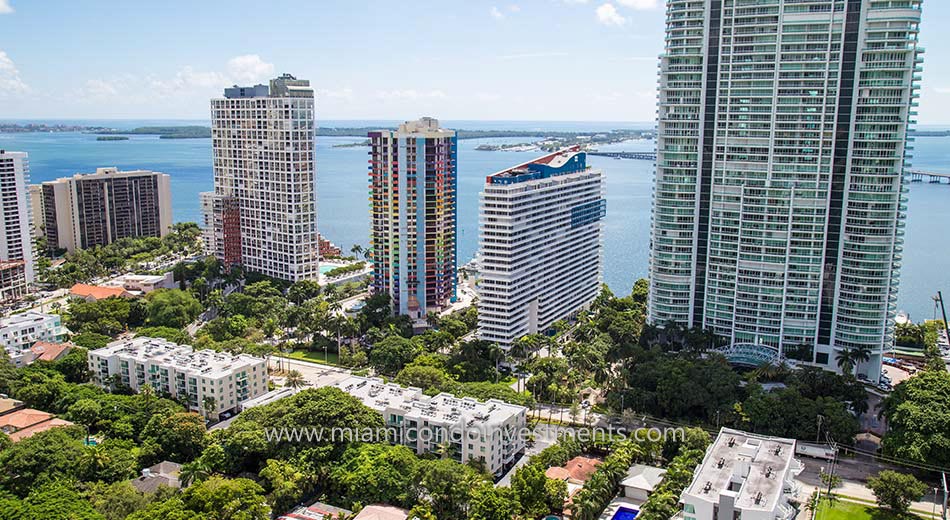
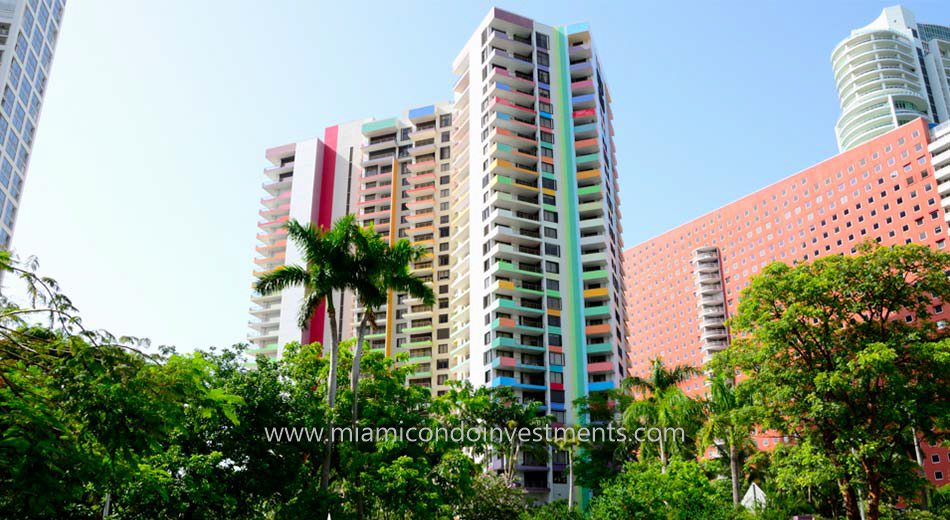
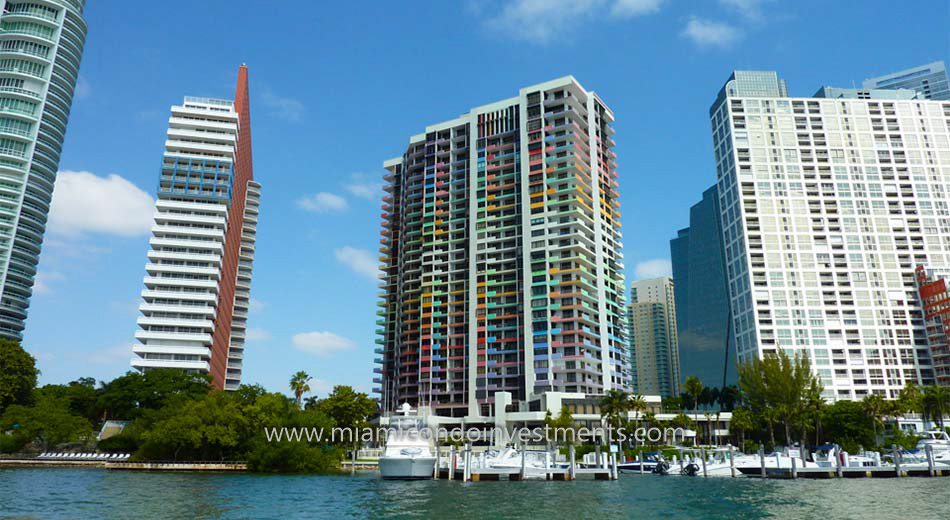
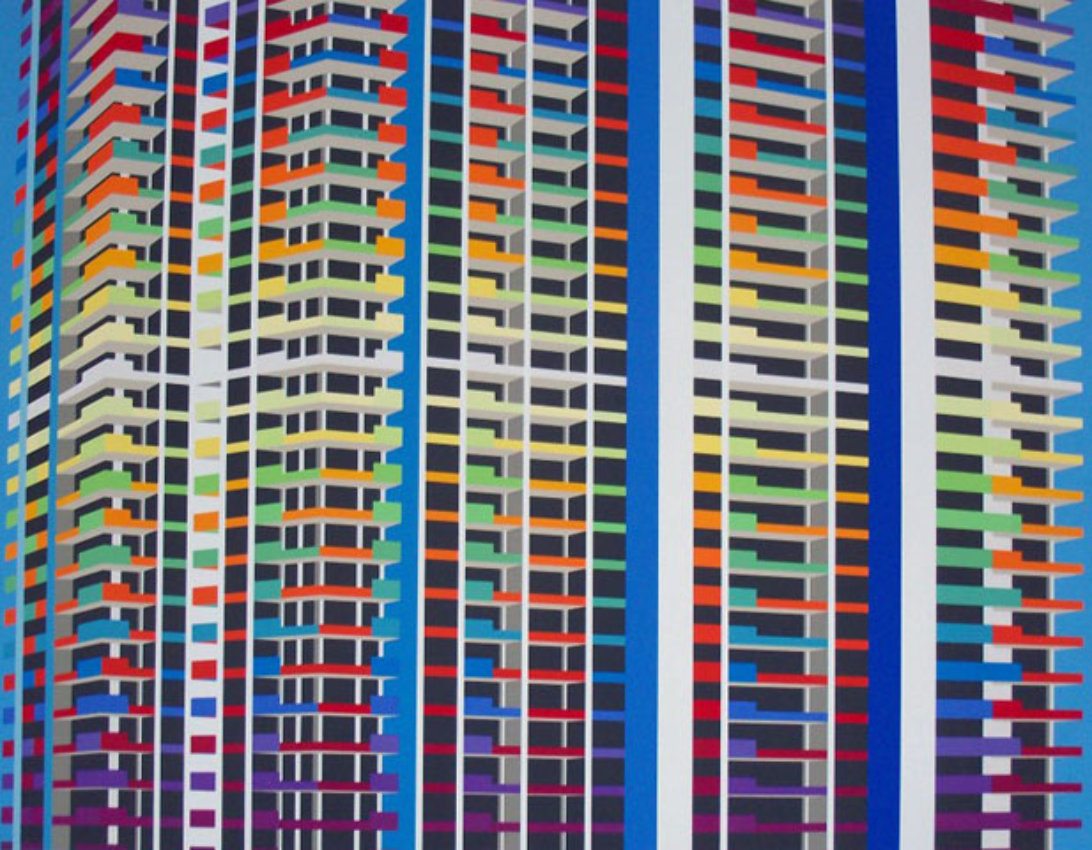
Most people know it as the “Rainbow Building” because of its signature paint scheme, but here are a few things that you may not have known about South Brickell’s Villa Regina.
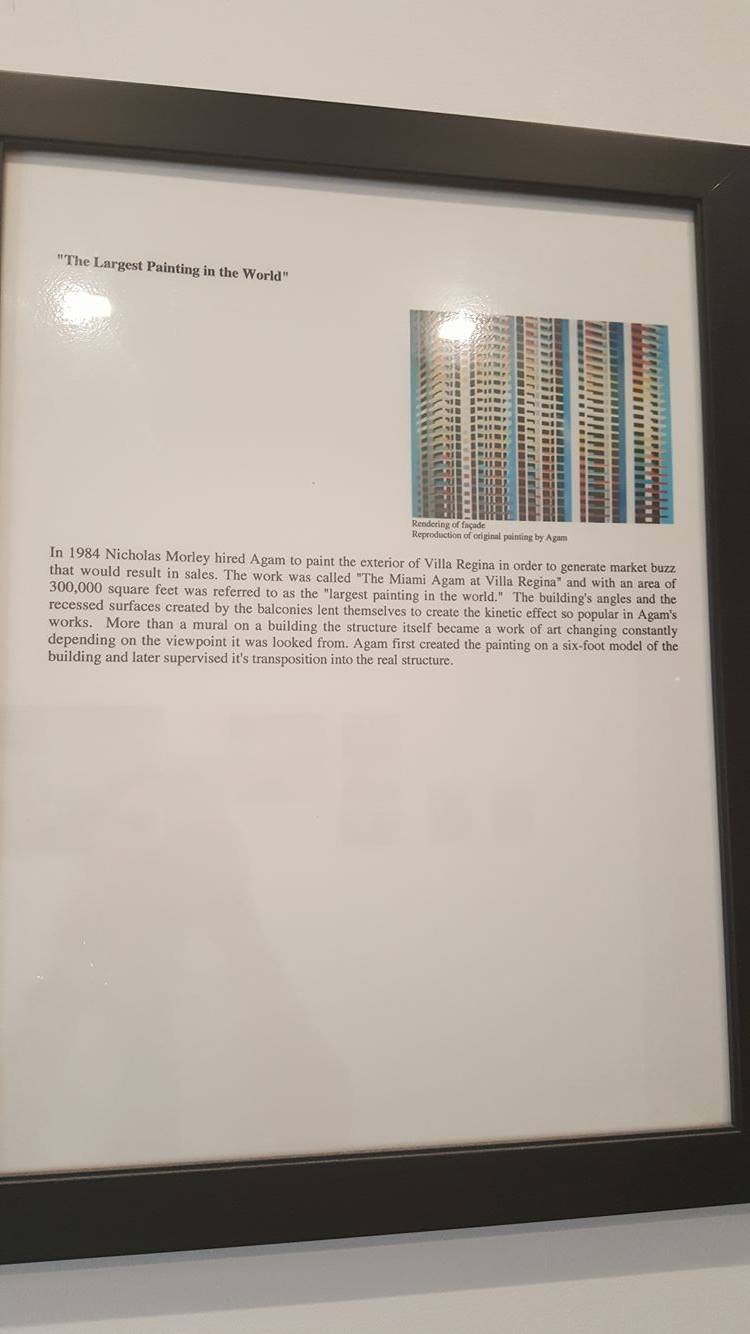
1- The paint scheme is actually “The Largest Painting in the World”
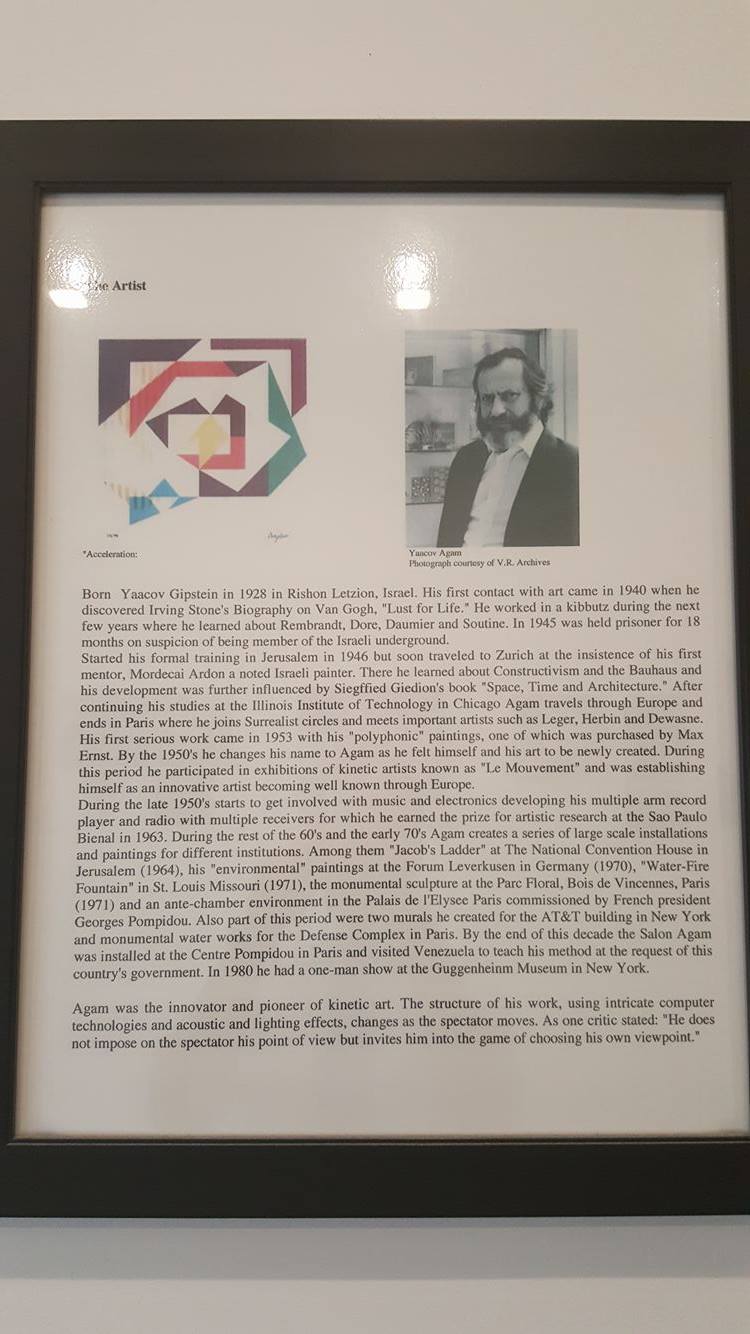
When the building was constructed in 1980, Miami was in the midst of a sales slump. The developer was having a difficult time choosing the paint color for the exterior, so consulted Israeli artist, Yaacov Agam. He commissioned Agam to design something cheerful and generate market buzz. Here is a quote from Agam regarding the commission, from an article in the New York Times back in 1984:
”The middle of the building will be white. From there the color scale goes up and down, so that the building will seem to be glowing, radiating color and energy out of itself.”
”The colors are the colors of the rainbow; they will create almost an enormous arc of Noah,” he said, referring to the rainbow that marked the covenant between God and every living creature. ”Today, when the world could be destroyed at any moment, it will be a sign of hope. The colors will also make you happy. That’s what Miami stands for.”
There is also a theme of the number 13 in the mural, a number that represents good fortune in Jewish culture. There are 13 colors used in the spectrum, 13 levels from the center of the building and the job took 13 days to complete.
Since Villa Regina, SLS Brickell and Brickell Heights developments have followed suit with rainbow colored murals of their own.
2 – Villa Regina was one of Ugo Colombo’s first projects.
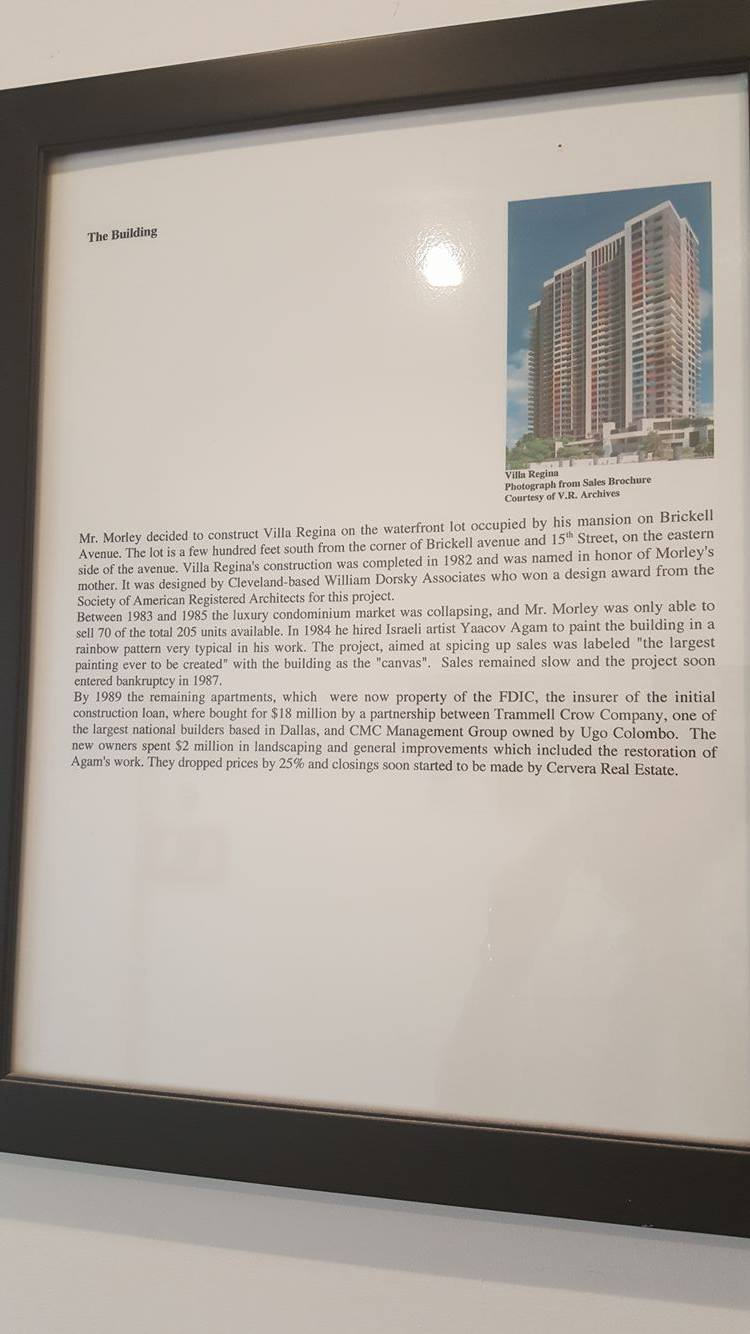
As beautiful and eye-catching as it may be, Agam’s painting was not enough to reignite sales and the project was taken over in 1987 by the FDIC, which had insured the original construction loan that was foreclosed upon.
Mr. Colombo stepped in with Trammell Crow from Dallas and purchased the remaining inventory. They spent $2 million renovating the landscaping, finishes, and restored Agam’s work, reduced prices by 25% and made the project a success. Ugo Colombo’s CMC Group has gone on to develop such projects as Santa Maria, Bristol Tower, Epic Hotel and Residences and the brand-new Brickell Flatiron.
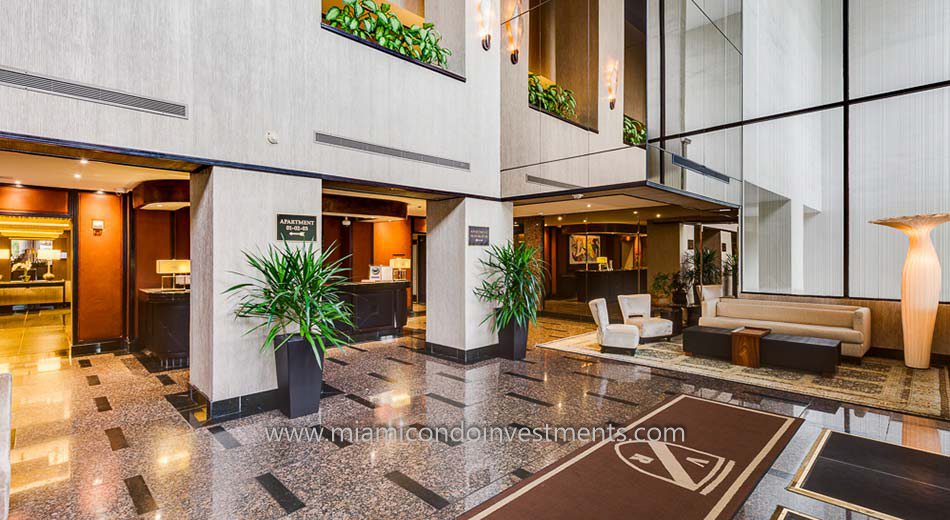
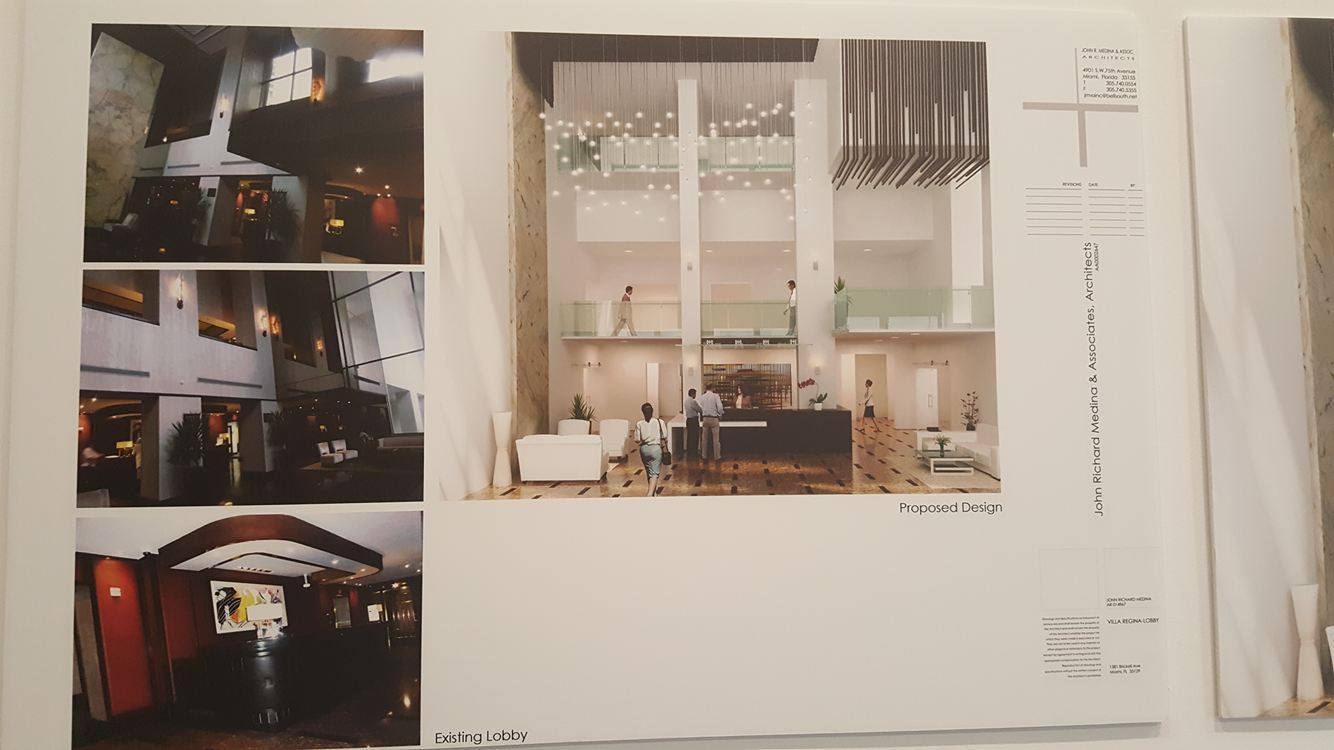
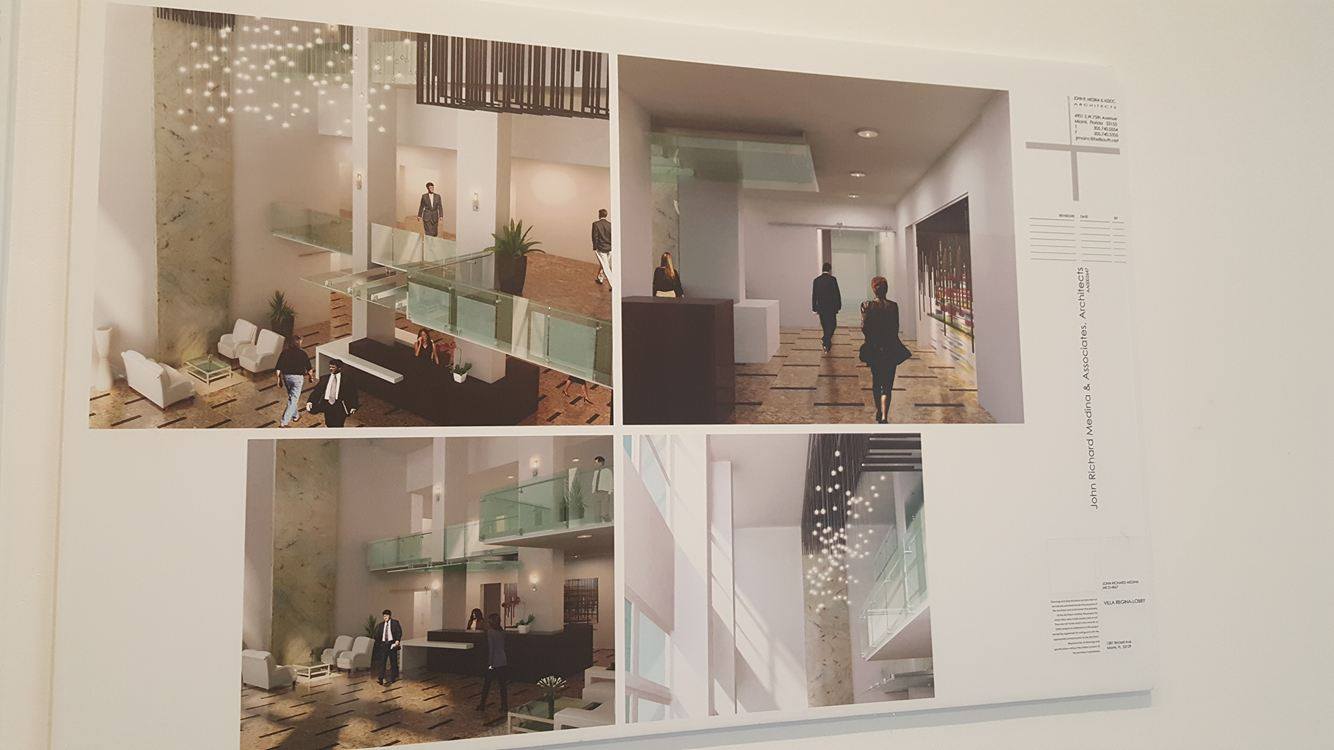
3 – The lobby is currently being renovated, with completion just around the corner.
Although the building just received a new lobby around 2011, it is being renovated again. The previous lobby was too dark and classic, the building needed something bright and contemporary… like Miami.
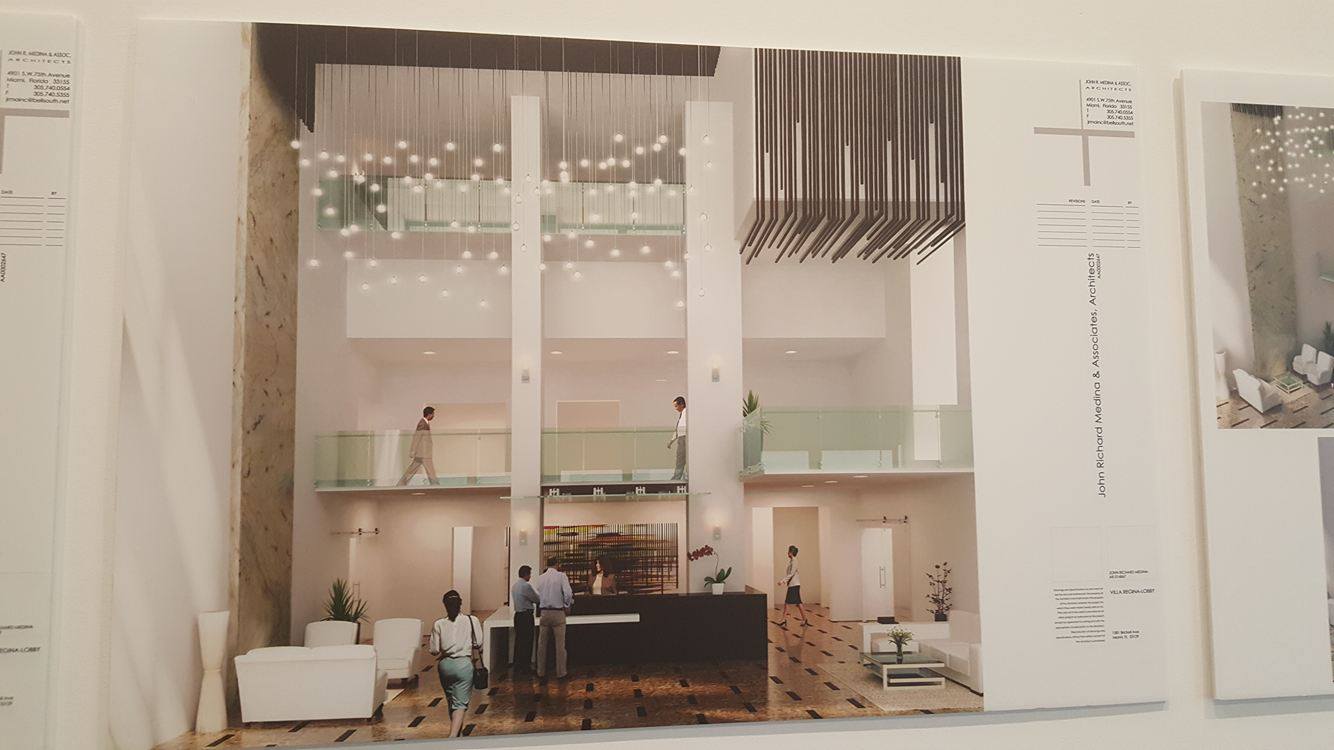
Here is a sneak peek at what it will look like when complete.
The lights are already glittering, they can be seen from buildings blocks away. The front desk is being installed now and we are looking forward to seeing the finished product very soon. In the meantime, look at this “before” pic. It reminds me of a corporate hotel in the 1980’s.
And here is a rendering of the before and after. Much better.
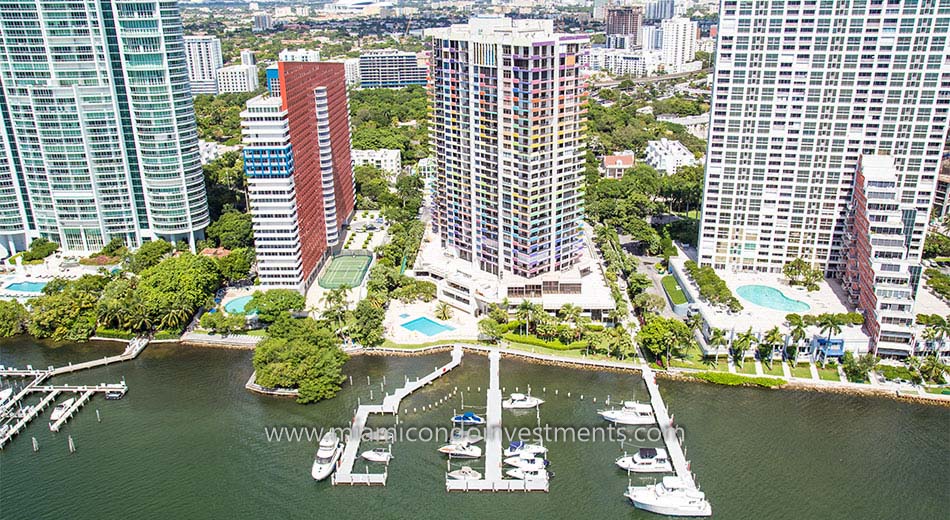
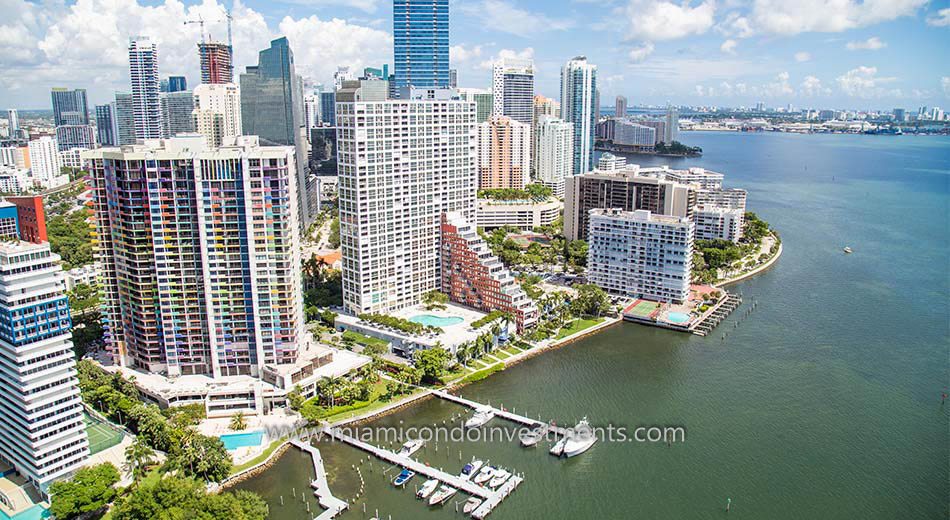
4 – Villa Regina is one of the few buildings in Brickell that has its own marina.
While Miami is often stereotyped as being a glitzy city with high rise buildings you can pull right up to in your yacht, there really aren’t that many buildings that have their own marina. Even if a developer thought to build one, there is so much red tape from environmentalists that it is almost impossible… not that there’s anything wrong with that.
Existing marinas are grandfathered into the building code, so Villa Regina owners are quite fortunate. The slips are individually owned by the owners in the building, although some opt to lease their slips out to tenants or other owners in the building.
5 – There is an exciting new listing coming up.
Weather permitting, we will be listing a beautiful and extremely spacious 2 bedroom unit with a bay view next week. It is fully renovated and furnished with high ceilings and contemporary design. All we need is the weather to cooperate for a photo shoot and everything will be announced. Here is a sneak peek…stay tuned!
Brickell’s Villa Regina, Known for its Yaacov Agam Rainbow Facade, is Redoing its Lobby
Villa Regina, one in a row of iconic and brightly colored 1980s, Miami Vice/Cocaine Cowboys-era condo towers along Brickell Avenue, is redoing its lobby. The building is dominated by its bright rainbow facade created by the artist Yaacov Agam, an Israeli sculptor and experimental artist best known for his contributions to optical and kinetic art (according to Wikipedia) and for colorful facades that captured a certain architectural moment in the 1980s. Originally developed by Nicholas Morley, Villa Regina was also one of developer Ugo Colombo’s earliest projects (see below).
The facade was recently restored and is staying put luckily. Apparently the building’s owners did away with the original lobby 5-6 years ago, and have now decided to do away with it again, with a new, much lighter, design by John Richard Medina & Associates Architects. Considering how radical of a change the new lobby appears to be in renderings, let’s hope it coordinates with the rest of the facade.
7,400 Square Foot Penthouse at Villa Regina Sells for $1,925,000
Last week, a 7,400 square foot penthouse at Villa Regina traded hands for $1,925,000, or $260 per square foot. The 6 bedroom, 6.5 bath condo also included 1,600 square feet of balcony and a remarkable six assigned parking spaces! The residence has 10-foot high ceilings and offers spectacular views of Biscayne Bay, Key Biscayne and Brickell. There is no doubt that this penthouse was sold at an amazing price but – before anyone gets all worked up about how they missed out on the deal of the century – let it be known that this property needed a lot of work. I had the opportunity to tour the penthouse about a month ago. Conservatively, I felt that it would require at least $100 per square foot to turn it into a penthouse-quality residence by today’s standards. Regardless, even after forking over close to three-quarters of a million dollars (or more) in renovations alone, it would be well worth it. A condo this large, and at this price point, just doesn’t exist in Brickell.
The Best 2 Bedroom Condo in Brickell for Under $800K
Update: This condo received three offers this past week and is now pending sale.
I know value when I see it and I recently saw it when I had the opportunity to show a stunning tower suite condo at Villa Regina. In my opinion, it represents the best 2 bedroom condo in Brickell that money can buy for under $800K. The spacious floor plan has 1,895 interior square feet, 400 square feet of balcony and soaring 11-foot ceilings. Every inch of this condo has been tastefully remodeled including both bathrooms and kitchen. The split floor plan has 24×24 marble flooring in the living room, wide-plank wood flooring in the master bedroom and bath, a private balcony off the master bedroom, front-loading washer and dryer, induction cooktop, recessed lighting throughout the condo and a very large walk-in closet off the master bedroom. It also offers an amazing view of Biscayne Bay. The best time to tour this condo though is around 6:10pm as the sun is setting. Pure beauty! The asking price is $799,000, or $422 per square foot, without the furniture. The owners, however, are open to selling the furniture separately. I highly recommend that because the furniture compliments the unit incredibly well.
This unit is located on the second highest floor in the building. At Villa Regina, the ordering of the floors is as follows, from the lowest to highest: Penthouse 1, Penthouse 2, Tower Suite 1, Tower Suite 2. This 2 bedroom condo is located on the Tower Suite 1 level.
I want to note that this is not my listing and am in no way affiliated with the office which has it listed. I also haven’t received any type of fee from the listing agent for promoting this condo. I just truly feel that the property represents a great value and whoever buys it will love coming home to it each day. That actually describes this property perfectly – it doesn’t feel like a condo; it feels like a home. Obviously, my hope is to represent the person(s) who buy this residence so please contact me if you have any questions or if you would like to schedule an appointment to see this unit in person. I also have a video which I can forward to you via email. You can reach me on my cell at 786-247-6332 or email at [email protected].
The Brickell Rental Market Under a Microscope
The rental market is a very interesting segment of the real estate market, not only for potential tenants on the prowl for a new pad but also current landlords and would-be investors trying to assess the demand for rentals across various neighborhoods and, more specifically, across various condo developments. Only a few years ago, the supply of rentals in Miami far outpaced demand. As a result, rental prices plunged and renters ruled the day. Fast forward to the present and an entirely different rental market is upon us in Miami. Nowadays, rental inventory is being absorbed quickly and overall rental prices are on the rise. For those living in Miami, I’m sure this a message that you have not only read in the local paper but have also heard directly from friends and family who have experienced it firsthand.
Obviously, not all neighborhoods and condo developments are created equal. Factors such as price, location, views, quality and recommendations from peers help determine rental demand. As a result, one would assume that demand can vary greatly from building to building and even neighborhood to neighborhood. Which condo developments are the leaders when it comes to rental demand and which are the laggards? More importantly, which buildings should we expect to see prices climb in the near future?
In this first segment, I decided to analyze the Brickell rental market to answer the above questions. Below, you will find a spreadsheet containing rental data for various condo developments in Brickell. Click the link below the spreadsheet to view it in its entirety.
Brickell Rental Market as of March 01, 2011
Columns C through G show the number of available rentals pertaining to each condo development grouped by number of bedrooms. Column I displays the total number of rentals available in each condo development while column J shows the total number of units within that development. I debated whether or not to include column K, the number of available rentals over the total number of units in the development expressed as a percentage, because the figure can be deceiving in buildings where developer inventory remains which has neither been sold nor rented. This is the case in buildings such as Icon Brickell and Infinity at Brickell. Regardless, I decided to include the figure because it can provide additional insight in buildings where this is not the case.
The main objective in creating this spreadsheet was to calculate months of inventory for each condo development. This can be seen in column M. Months of inventory was calculated by dividing total units available for rent by the monthly average number of units rented over a 3-month period from November 16, 2010 to February 15, 2011. You may be wondering why I did not include closed rental data from the past two weeks in determining the monthly average. I have noticed that it can take real estate agents days, and even weeks, to change the status of a rental in the MLS from pending to rented. As a result, I felt that the average would be skewed to the downside and not be an accurate representation of the Brickell rental market. Furthermore, if I had to venture a guess, I would also say that it is highly likely that around 10 percent of the total number of units available for rent are in fact no longer available. In this case, the listing agent has yet to change the status from available to pending.
Regardless, a lot can be ascertained from the spreadsheet above. In my opinion, any building with 1.5 months of inventory or less has a solid rental market. 1060 Brickell, The Plaza on Brickell and Vue at Brickell are standouts with absorption rates hovering around one month. I expect rentals prices in these developments to continue to rise in the near future. For those in the market to lease a condo in one of these developments, I advise that you act quickly and put your best foot forward when making an offer.
According to the spreadsheet, there is currently 2.29 months of rental inventory available in Brickell. Some may expect this number to increase as more units from Icon Brickell and Infinity at Brickell hit the rental market. Of course, this will all depend on how quickly the units become available and at what pace demand absorbs them. Only time will tell, but I plan to watch Brickell rental market closely and post updates on a monthly basis.
I would love to hear your thoughts and comments.
Brickell Condo Index – August 2010
The Brickell Condo Index is back! It has been a year and a half since I last published the Brickell Condo Index. Fortunately, eighteen months is a good reference point and definitely enough time where one would expect a lot to have changed with the condo market. For those of you who haven’t followed this blog that long, the Brickell Condo Index is an in-depth look at the various condo buildings in Brickell with various statistics included to illustrate the health or weakness of each building.
I hate to be the bearer of bad news but this will be the last Brickell Condo Index to appear on this blog. From here on out, the Brickell Condo Index, as well as other neighborhood indexes, will only be made available via email. Early next week, I will unveil a new version of the Miami Condo Investments website. The new website will be much easier to navigate, have a lot more content, load considerably faster and, most importantly, allow you to register to our Miami Condo Investments weekly newsletter. The weekly newsletter will contain the best condo deals of the week, relevant news stories and exclusive market data such as the neighborhood condo indexes. The neighborhood condo indexes will be emailed the Sunday following the 15th of each month, the day that I have chosen to collect and compile the data. Each neighborhood will be represented every six months as follows: Brickell this month, Brickell Key next month, Downtown Miami in October, the Edgewater in November, South Beach in December and the Miami River area in January. The cycle will then start all over so a neighborhood update is provided twice per year. In the meantime, if you’d like to be included on the newsletter list then simply send us an email at [email protected] and convey your interest to be placed on the list. The blog will not change and will continue to be updated but the market data reports will only be made available via our newsletter.
Before we get into this month’s numbers, let me discuss a few changes that I made to the Brickell Condo Index since the last update in February 2009. First, I excluded One Miami from the index. One Miami will be included in the Downtown Miami Condo Index in October. Second, Latitude on the River and Neo Vertika were also excluded. Both will appear in the Miami River Condo Index in January 2010. Third, I decided to include 1060 Brickell, 500 Brickell, Brickell on the River South and The Plaza on Brickell. Each has had enough closed resales to warrant their inclusion in the Brickell Condo Index. Fourth, I decided to bring back The Sail on Brickell. As of late, I’ve seen much more interest in the building due to its price point and it is much healthier than it was in October 2007 when I dropped it from the index. I guess you can say that it’s officially off the pink sheets. There are now a total of twenty buildings in the Brickell Condo Index whereas before there were eighteen. Last, but not least, I decided to round the price per square foot calculations. I think it makes everything easier to read and I honestly don’t think excluding the two decimal points makes the figures any less insightful.
As per the MLS, the average of the asking prices of the twenty condo buildings that now represent the Brickell Condo Index is $376 per square foot. The average asking price per square foot for each Brickell condo building individually can be found below:
1060 Brickell – 1050 & 1060 Brickell Ave – $375
500 Brickell – 500 Brickell Ave & 55 SE 6 St – $362
Atlantis on Brickell – 2025 Brickell Ave – $255
Brickell on the River North – 31 SE 5 St – $268
Brickell on the River South – 41 SE 5 St – $276
Bristol Tower – 2127 Brickell Ave – $471
Emerald at Brickell – 218 SE 14 St – $348
Four Seasons Residences – 1425 Brickell Ave – $954
Imperial at Brickell – 1627 Brickell Ave – $285
Jade Brickell – 1331 Brickell Bay Dr – $532
Santa Maria – 1643 Brickell Ave – $691
Skyline on Brickell – 2101 Brickell Ave – $352
Solaris at Brickell – 186 SE 12 Ter – $189
The Club at Brickell Bay – 1200 Brickell Bay Dr – $285
The Mark on Brickell – 1155 Brickell Bay Dr – $313
The Palace – 1541 Brickell Ave – $298
The Plaza on Brickell – 951 Brickell Ave & 950 Brickell Bay Dr – $394
The Sail on Brickell – 170 SE 14 St – $299
Villa Regina – 1581 Brickell Ave – $350
Vue at Brickell – 1250 S Miami Ave – $214
At the bottom of this post, I included a chart that shows how each of the above figures compares with those published in February 2009. Solaris at Brickell experienced the largest drop with average asking prices there falling slightly over 40 percent. Three of the buildings saw a slight increase in their average asking price per square foot within the past eighteen months. These were Bristol Tower, Four Seasons Residences and Villa Regina.
Below, you’ll find the average price per square foot for Brickell condos sold in the MLS within the six month period from February 1, 2010 to July 31, 2010. I decided to do it this way because I’ve noted that oftentimes it takes agents a few weeks to change the status of a listing in the MLS from pending to closed. The neighborhood as a whole sold at an average price per square foot of $285 during that time period.
The biggest surprise in the figures above when compared to those in February 2009 is Jade Brickell. The average price per square foot for closed sales during the previous six months increased a little over 14 percent when compared to the figures published eighteen months ago. Other buildings that experienced an increase are Skyline on Brickell, The Mark on Brickell, Villa Regina and Vue at Brickell. With the exception of Villa Regina, these buildings were some of the hardest hit in Brickell when the market collapsed mainly due to the large amount of mortgage fraud that took place in these buildings. The Club at Brickell Bay and Solaris at Brickell are two other buildings in Brickell that were heavily victimized by mortgage fraud. The Club at Brickell Bay saw about a 1 percent decrease in average closed sales prices while prices at Solaris at Brickell fell slightly over 9 percent. This actually makes sense since the fallout at Solaris at Brickell didn’t take place until about a year after the others. Also worth mentioning, prices at Santa Maria fell a little over 4 percent within the past eighteen months but the numbers were a bit skewed due to Penthouse 4901 recently selling for $1,100 per square foot. The average for the past six months would have been much lower had it not been for that sale.
Below you will find some additional statistics. Click on the image to enlarge it.
The first column to the right of each condo development name is the difference in the average sales price and list price for this month, expressed as a percentage. A high percentage indicates that there is a large discrepancy between the average asking price for condos currently on the market and what has actually sold within the past six months. In other words, many of the sellers in these buildings are delusional and are in need of a reality check. For example, 1060 Brickell has a very large discrepancy because there are quite a few units asking over $400 per square foot and even some asking over $560 per square foot while closed sales have averaged around $208 per square foot within the past six months.
The second column shows the number of active listings currently in the MLS for each condo development. The third column shows the percentage that these listings represent over the total number of condo units in each development. The cells highlighted in green reveal those condo developments that have active listings that that represent less than 10 percent of the overall units in the building. This is typically one indication of a sound condo building. When I first started doing the Brickell Condo Index in 2007 many of the cells in this column were highlighted in red, indicating that active listings represented over 20 percent of the building. This was always a good indication that prices would fall further in these buildings. For example, in February 2009, active listings at Solaris at Brickell represented slightly over 20 percent of the building. That was the largest percentage of listings at that time and it is not a coincidence that eighteen months later prices fell the most at Solaris at Brickell of all the buildings represented in the Brickell Condo Index.
The fourth column reveals the number of condos currently pending sale in each building. The Club at Brickell Bay has a whopping 42 pending sales at this time and there are a total of 155 pending sales in all of the buildings combined. In February 2009, there were only 81 pending sales although a total of twenty buildings are now present in the Brickell Condo Index rather than eighteen. The fifth column displays the number of closed sales from February 1, 2010 to July 31, 2010. Once again, The Club at Brickell Bay leads the way with a total of 38 closed sales in that time period. It’s interesting to note that there were 20 more closed sales in the six months prior to February 2009 when compared to the current closing numbers even though the index now has two additional buildings.
The sixth column shows the difference in the average list prices from this month’s and February 2009’s, expressed as a percentage. Those highlighted in red reveal those condo developments which had a drop in their average list price while those highlighted in green show those that experienced an increase.
The seventh column reveals the difference in average sales prices from this month’s and February 2009’s, expressed a percentage. Once again, those highlighted in green represent an increase while those highlighted in red represent a decrease.
Well, that’s all for today. Have fun with the numbers. Time for me to get back to work on the new website.
Brickell & Brickell Key Closed Condo Sales – November 2009
Click on the links below to view the condo sales in Brickell and Brickell Key closed in November 2009:
Brickell Closed Condo Sales – November 2009 – There were 30 closed condo sales in Brickell last month. The average sales price of these condos was $243 per square foot. I was surprised to see that a one bedroom condo at Skyline on Brickell sold for $334 per square foot.
Brickell Key Closed Condo Sales – November 2009 – 10 condos in Brickell Key closed last month. These sold at an average sales price per square foot of $258. Here I was shocked to see that someone would be willing to pay $294 per square foot for a unit at Isola, especially one with carpeting.