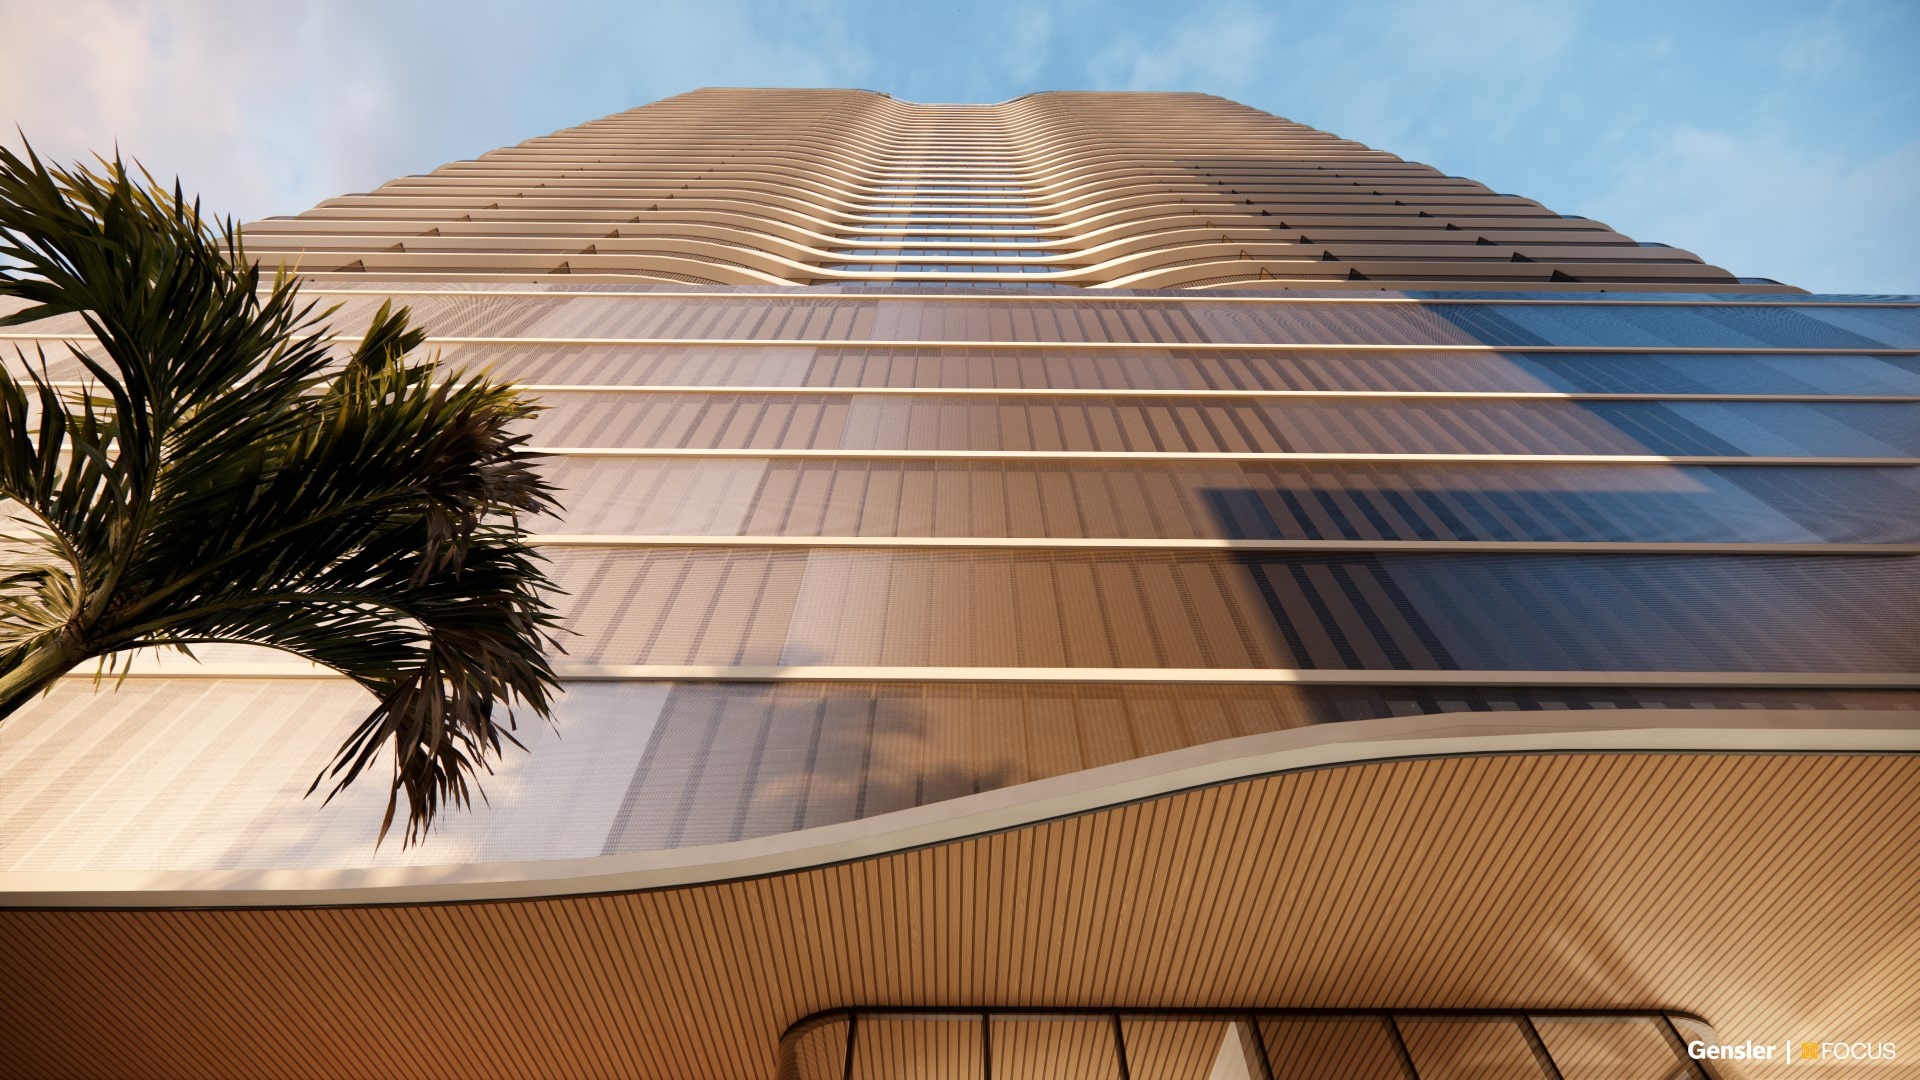
Brickell’s Skyline Set to Evolve with New 39-Story Residential Tower
The transformation of Miami’s Brickell neighborhood continues as plans for a new 39-story residential tower move forward. Located just a block from Brickell City Centre, this development promises to bring both luxury and community enhancements to the area.
The developer, working on the site of the recently demolished Starlite Motel, has officially signed a public benefits agreement to secure the project’s approval. Recorded on December 10, the agreement paves the way for development under Miami-Dade’s Rapid Transit Zoning plan.
As part of the agreement, the developer has committed to a series of public benefits:
$500,000 Contribution: A payment to Miami-Dade County, earmarked for repairs or upgrades to the Brickell Metrorail or Metromover stations.
Workforce Housing: Five percent of the tower’s residential units will be income-restricted for workforce renters, addressing the need for affordable housing options in the area.
Tree Planting Initiative: The developer will plant 40 trees at least 20 feet high either on the property or within the surrounding right-of-way, in addition to the required landscaping.
Pedestrian Connectivity: A cross-block passage will provide pedestrian access between SW 7th Street and SW 8th Street, enhancing walkability.
Utility Line Upgrades: Telecom wires on the property will be buried at the developer’s expense, improving the aesthetic and infrastructure.
The planned development includes:
517 Apartments: Offering a range of residential options to accommodate Brickell’s growing population.
Restaurant Space: 9,700 square feet dedicated to dining establishments.
Parking Facilities: A six-level garage with 506 parking spaces.
A construction permit for the tower was filed in August, with Suffolk Construction serving as the contractor. The estimated construction value stands at $190 million, highlighting the significant investment in the project. Chicago-based Focus is leading the development, with the world-renowned architectural firm Gensler at the helm of the design.
As approval for the project hinges on the fulfillment of public benefit commitments, the developer’s proactive approach signals a win-win for both the community and investors. This 39-story tower is set to redefine the local skyline while contributing to the enhancement of Brickell’s urban environment.
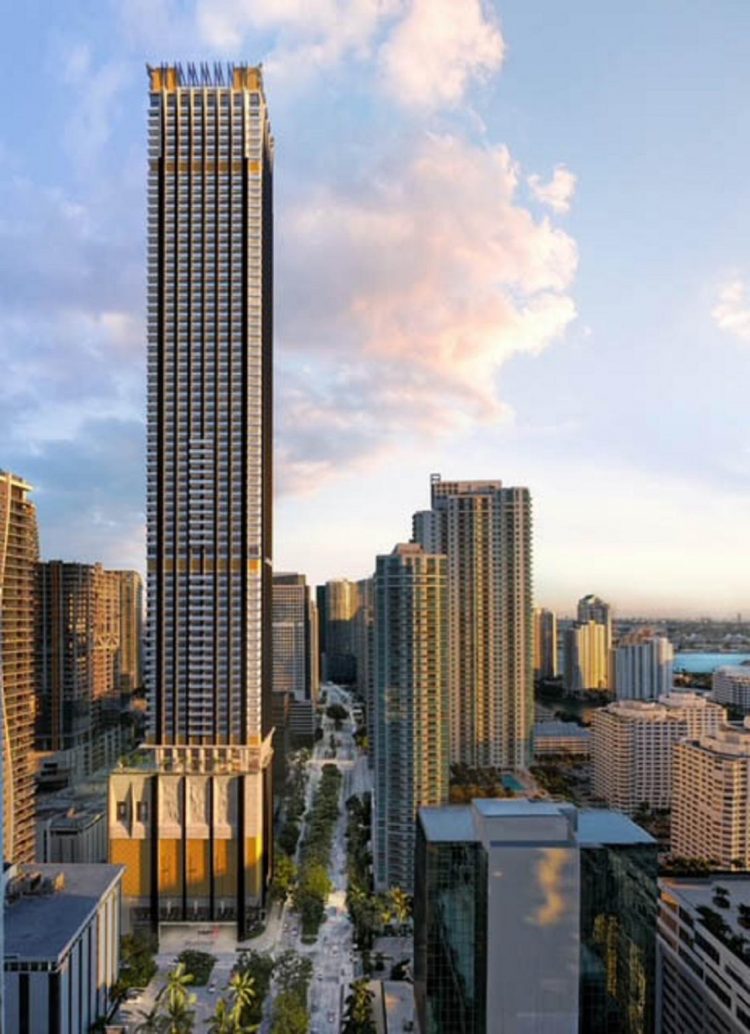
First Rendering Revealed of New Supertall Tower by Major Food Group-Major Residences
JDS Development Group has partnered with Major Food Group to build one of the tallest residential towers in Brickell. Today, the developer has released the first official rendering along with some construction updates.
The project (now renamed 888 Brickell by Dolce & Gabbana) will be located at 888 Brickell Avenue with 259 branded units. Rising 82 stories or 1,049 feet tall and just over 1 million square feet in, this will be Major Food Groups’ first residential project.
Studio Sofield is the architect designing the tower, lobby, and units. Ken Fulk Inc. will be responsible for the club, food, and beverage spaces.
With Major Food Group expansion in South Florida with Carbone, ZZ’s, and many more, you can expect to have 2 to 3 Major Food Group restaurants and bars.
Major Food Group has more than 30 restaurants, clubs, and hotels in the United States and overseas. This project is currently being reviewed by Miami-Dade planners for approval.
There are currently 8 supertall towers planned for Miami including:
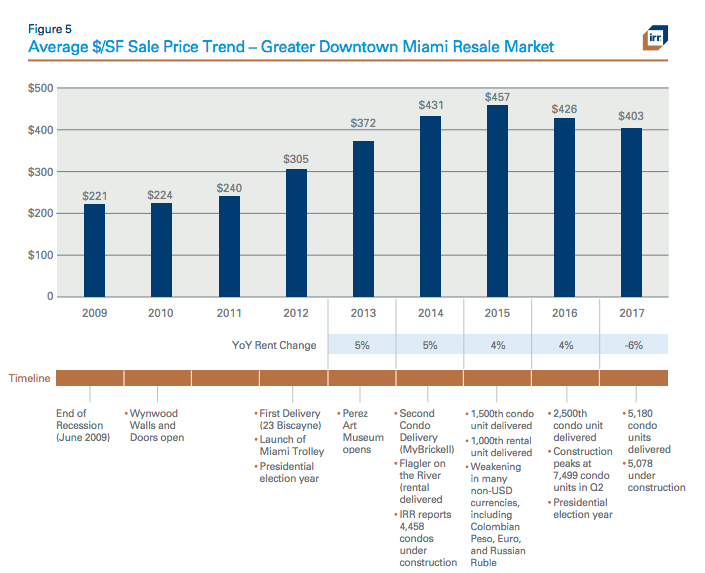
The Ultimate Market Stat Monday: Downtown Development Authority’s Mid-Year Report
Despite the fact that many media outlets and whispers in the marketplace would leave you to believe that the cards are stacked against us in the Miami condo market, things really aren’t so bad according to the Downtown Development Authority (DDA) Mid-Year 2017 Report. As they state in the report, “2017 has not been the best of times, but it hasn’t been the worst of times either.”
I have included the full 28 page report below, but also a synopsis…
RENTALS
The report separates the rental market into two sub-categories. Conventional rentals are the rental-only buildings that are all managed by one company. 2017 has brought 969 new rental units to the market, leaving just under 3,600 under construction. The condo rentals are considered shadow inventory since there is no way to tell whether a unit would be a rental, resale, or final sale until after delivery.
Amazingly, despite increased inventory, rental prices have increased slightly in conventional rental communities. I had previously been skeptical about the rental community market with so much inventory going up, but our neighborhood is very attractive and people are flocking in.
The segments of the rental market showing the biggest price gains are 1 bedrooms and 3 bedrooms, showing 3.4% and 3.6% growth since last year respectively. Studios are showing a slight decrease in price, but I suspect that this is due to the fact that tenants who would typically take a studio are now taking one bedrooms. Three bedrooms are less plentiful in the neighborhood, so are almost always a good investment opportunity.
PRE-CONSTRUCTION
The market in new developments is also hanging on. The researchers report that 2016 and 2017 YTD have garnered about 50% of the sales experienced in 2015, which experienced 25%-50% less than 2014. It’s undeniable that things have changed, but we will survive and the projects will be sold.
While the market has slowed markedly, projects that are currently under construction and 55%-60% sold do not seem to be in distress, according to the researchers.
One submarket that could flourish in the upcoming 18 months is the smaller-scale boutique project market. According to the report and our experience, these developments tend to capitalize on infill lots between the larger developments and do very well when the larger buildings slow down.
RESALES
Our resales are facing a tremendous amount of inventory with a 6% decline in overall pricing since last year. From July 2016 to June 2017 there were an average of 99 resales sold. That rate needs to be raised by an additional 500-700 listings sold per month to reach pricing equilibrium.
The conclusion of the report is that because so many new construction projects continue to be delivered and fewer projects are announced, we could see some stability in 2018 if nothing crazy happens.
Market Stat Monday: Almost $50 Million In Contracts Signed Post-Irma
It has been a few weeks now since the skies have cleared in Greater Downtown Miami after Hurricane Irma’s brush, and despite a little bit of flooding and debris, we were very lucky. Now that cleanup is under way, how have the condo sales fared?
Not too bad, if I must say. Despite having only two functional weeks in September, nearly $50 million in resale contracts were signed on 79 total units.
The least expensive listing to find a buyer was at the Loft II Downtown, where a 770 square foot one bedroom was listed for $175,000. Of the 79 units that went to contract, 50 of them were listed for under $500,000. We will find out the final sales prices once they close.
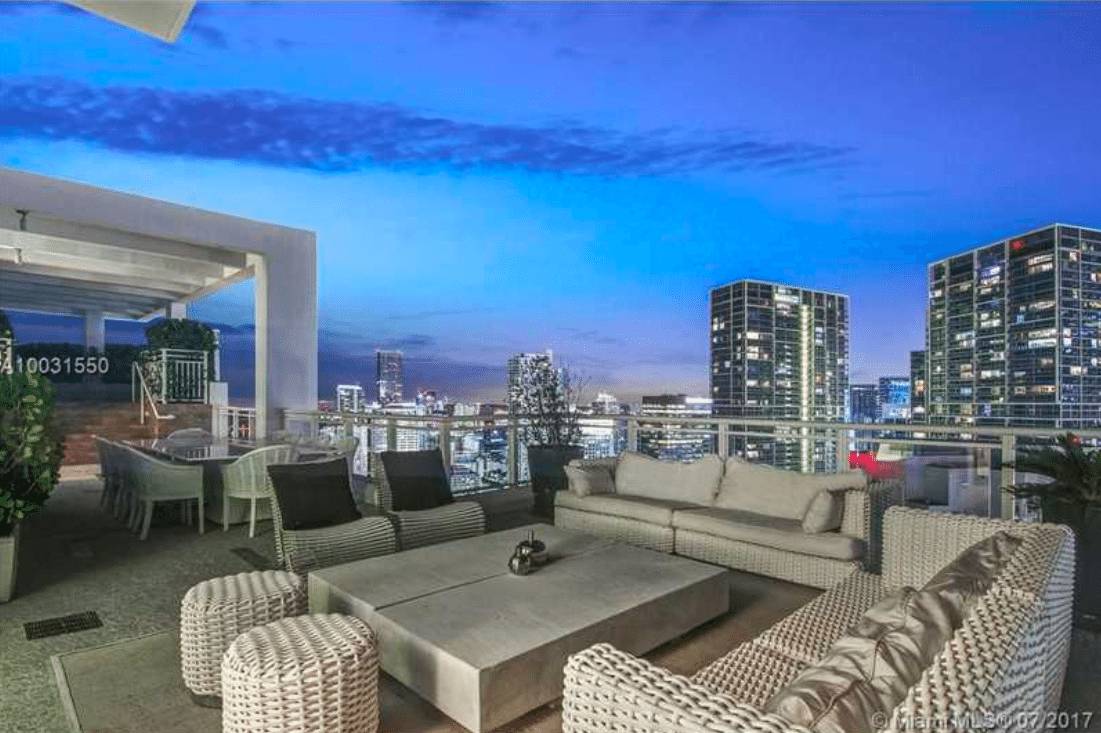
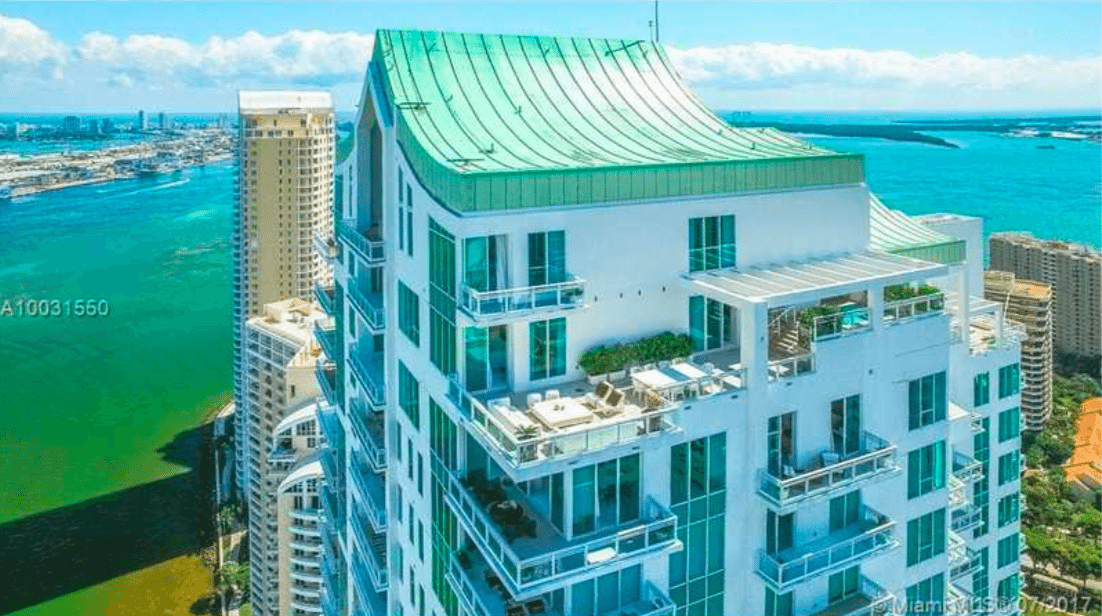
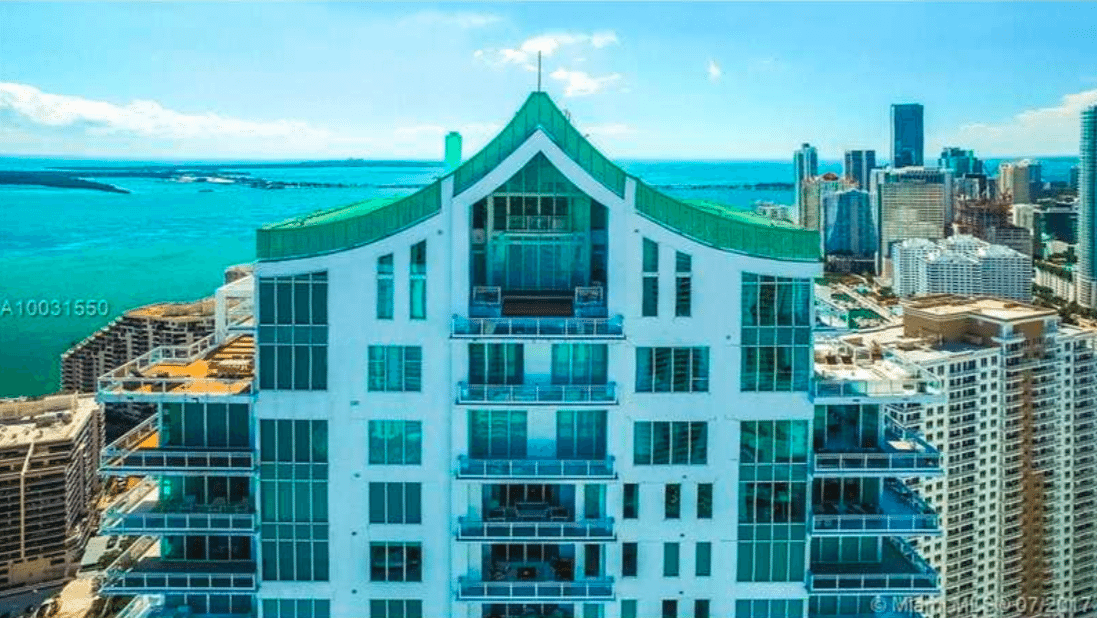
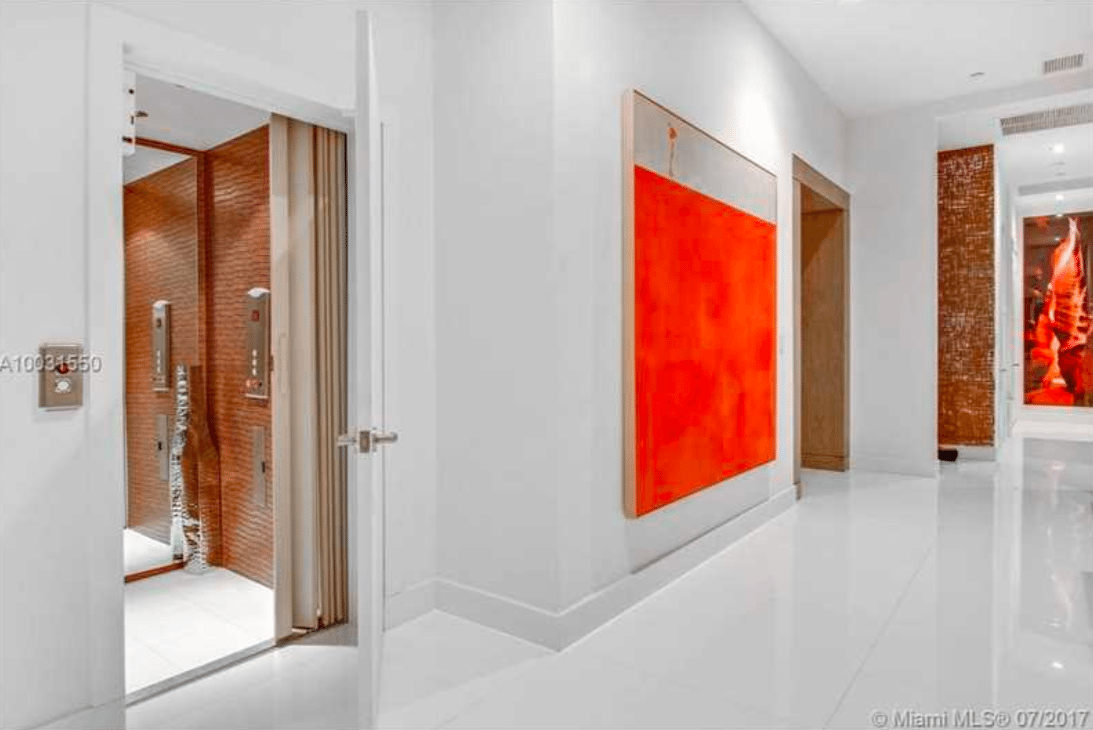
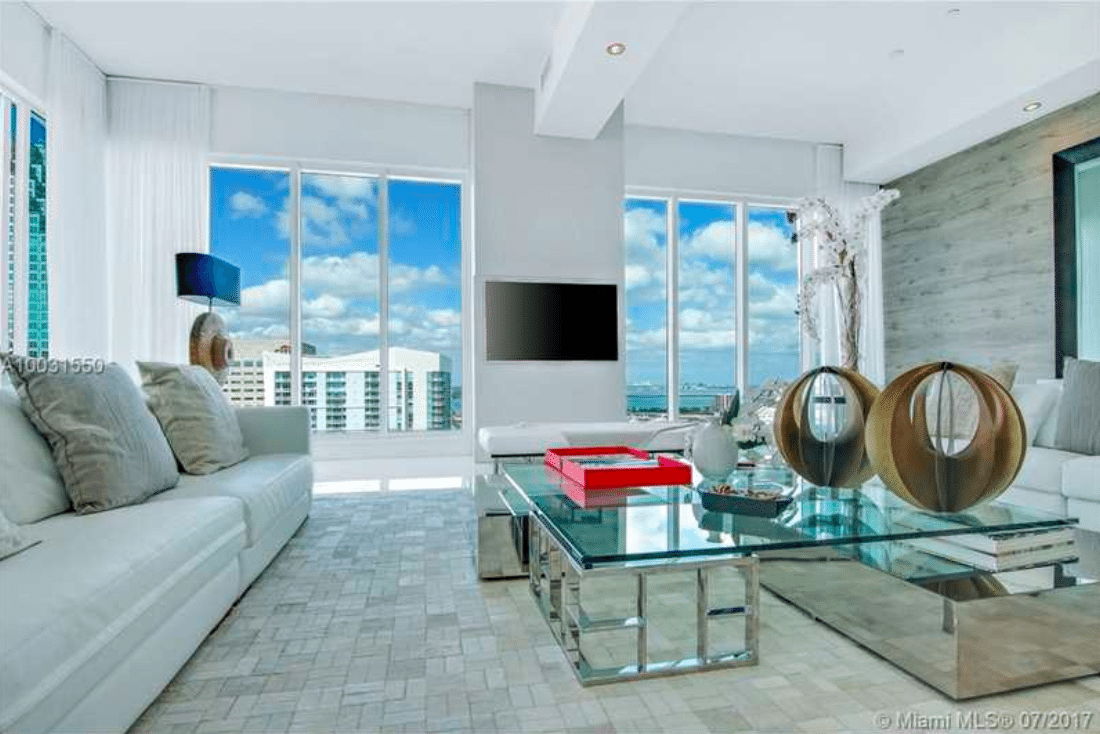
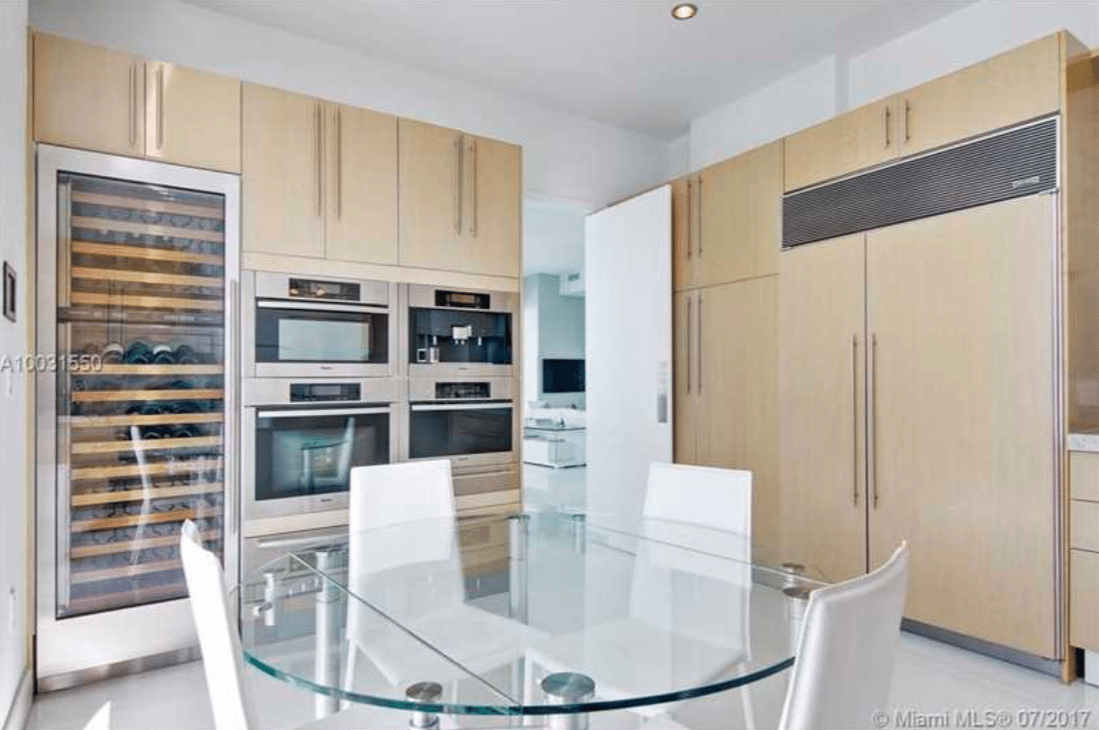
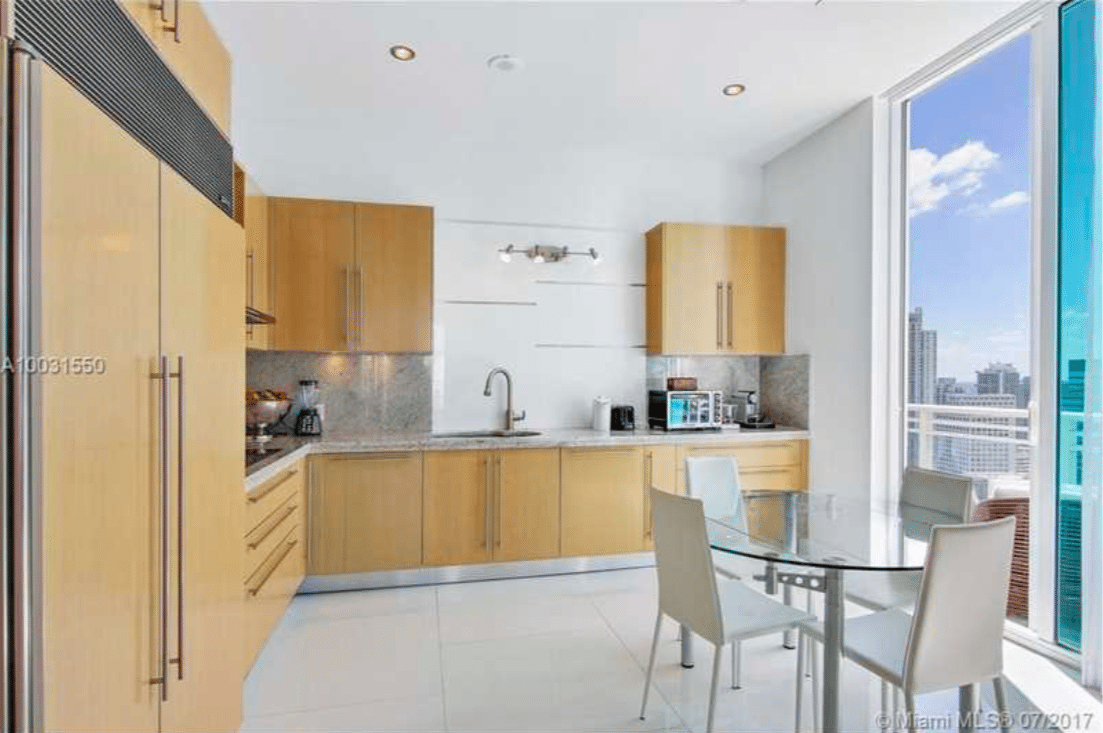
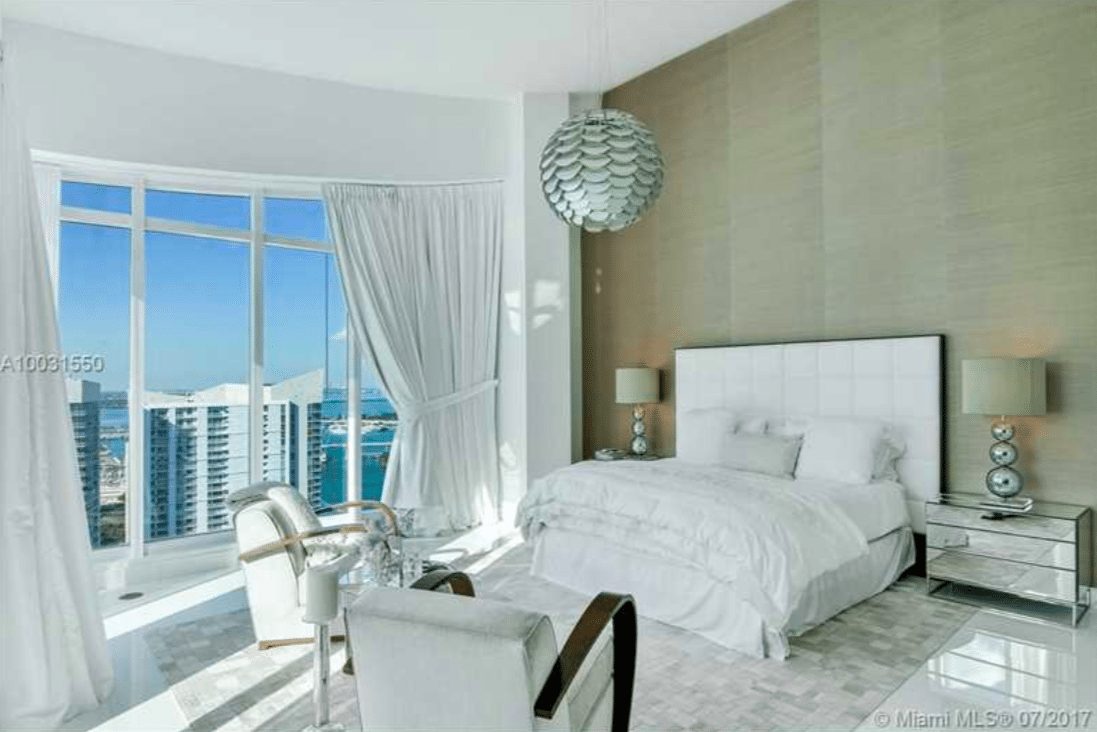
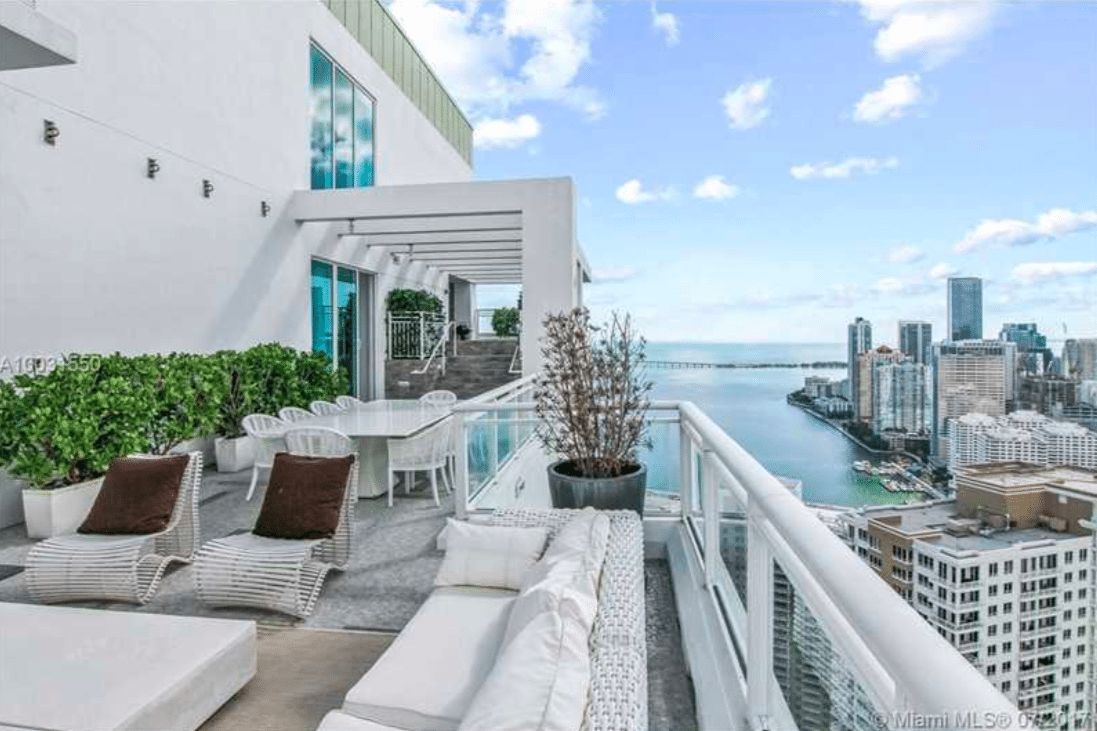
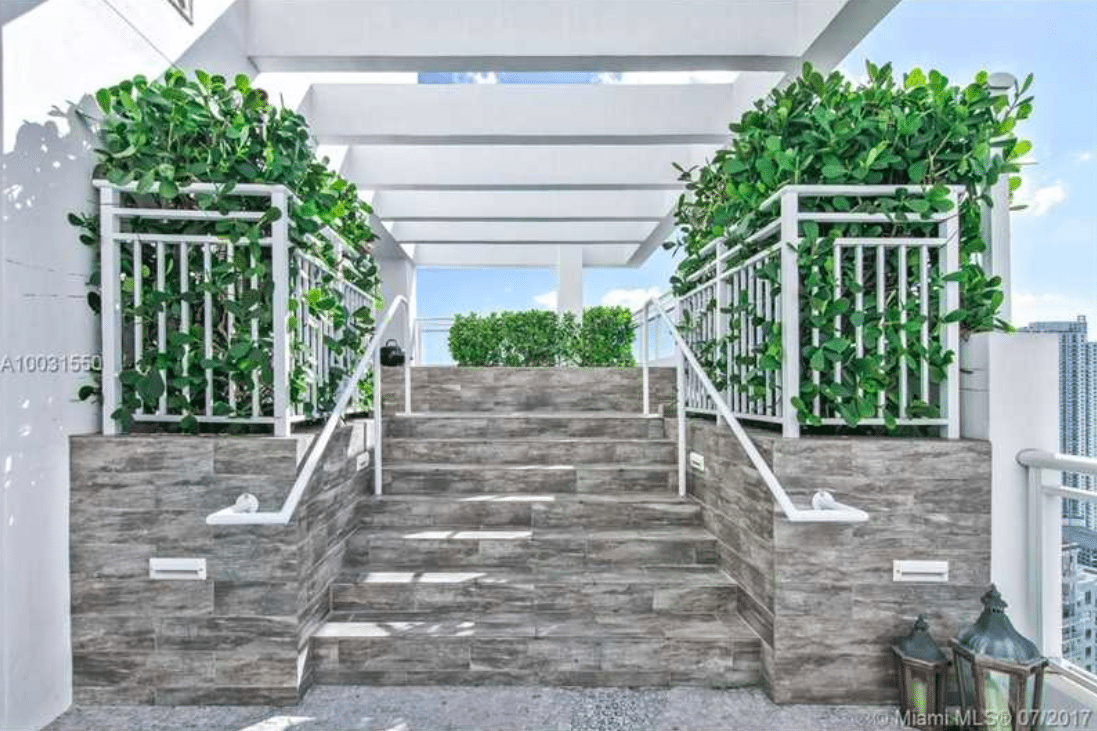
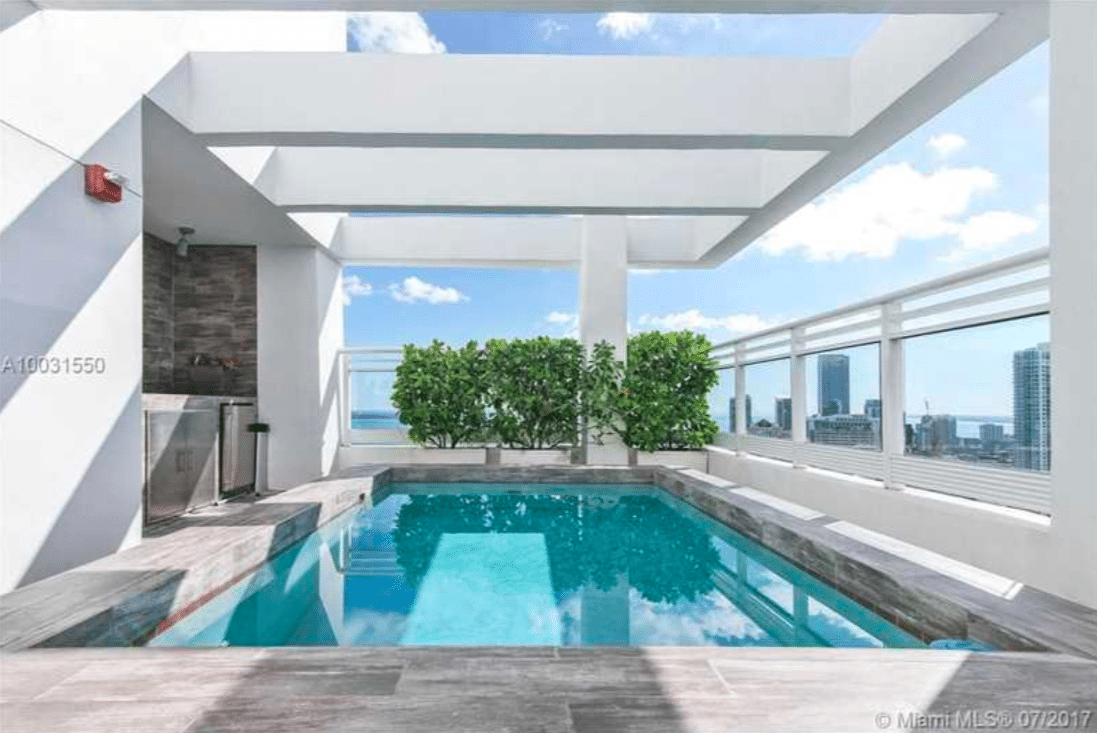
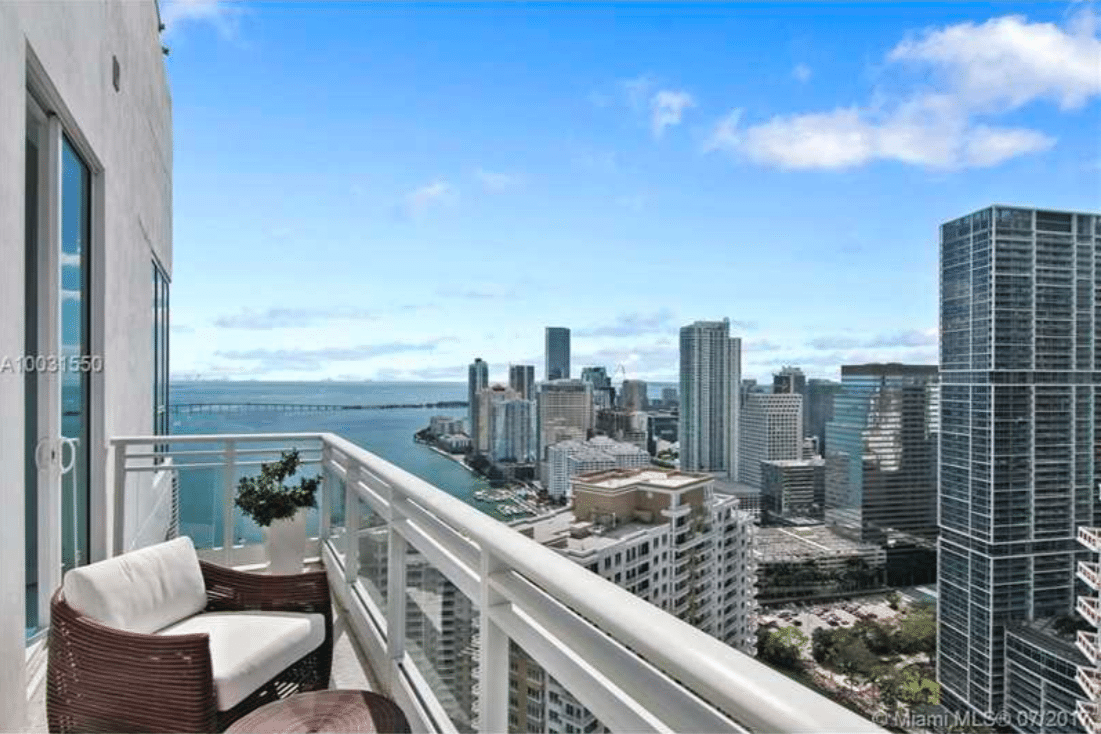
In the luxury segment, there were a total of 6 properties listed over $1 million that found buyers. Among them was the crown jewel penthouse #1 at Asia on Brickell Key. With nearly 5,000 interior square feet through three levels including a dramatic rooftop terrace with a private pool, the sellers had asked $8.5 million, or $1,715/square foot.
Comparing September of 2017 to September of 2016, you will see that 2016 brought both a higher number of transactions as well as a higher volume of listings sold, but not enough to make it an overall better month considering that September 2017 was short due to people being distracted by the hurricane and Hurricane Matthew didn’t brush South Florida until October of last year. September of 2016 brought just over $60 million of listings sold, with 119 total transactions.
To celebrate the end of a successful yet stressful September, let’s check out some photos of that Asia Penthouse!
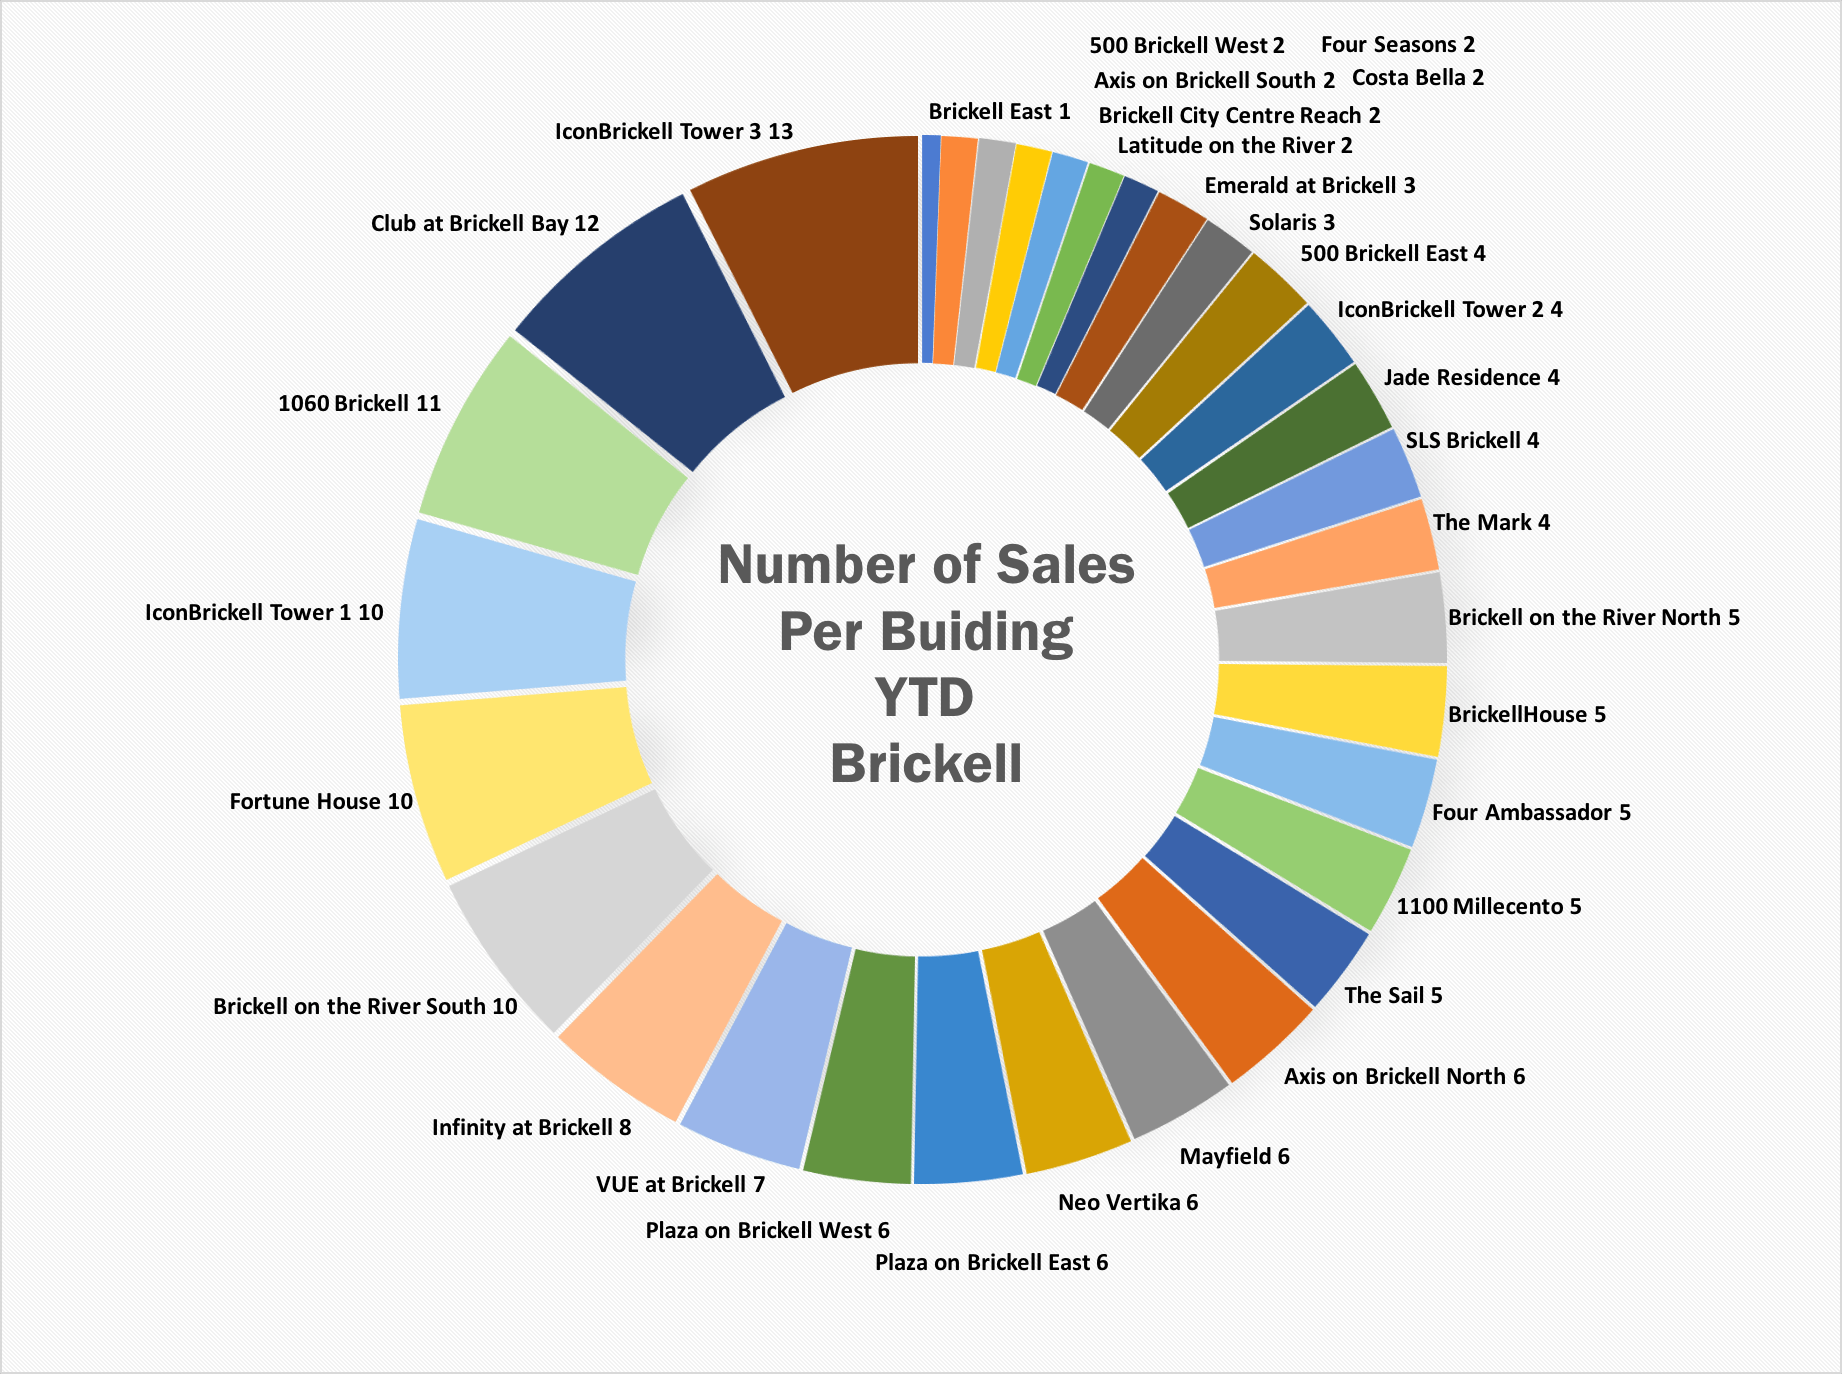
Market Stat Monday: Which Brickell Buildings Are The Most Popular For Buyers?
During our Market Stat Monday series, I’ve started to notice a trend that there is an increasing amount of competition between condo listings for a smaller amount of buyers in the market. This led me to become curious if there are any buildings in the that are more popular among the active buyers, and some of the results are surprising!
First, we have to acknowledge the harsh reality that we have seen only 175 closed sales in the neighborhood this year. With 1,413 active listings, that amounts to over 40 months of inventory on the market JUST in the Brickell resale market. When pulling my data, I only looked at resales, not developer inventory. If you add in the developer inventory, there will be even more months of inventory.
The sellers who were able to sell did so for a neighborhood average of $389/square foot.
I was pleasantly surprised to see that IconBrickell’s Tower 3 has been a stand-out so far this year. They have seen 13 closed sales despite losing their hotel program (which I think creates an opportunity for owners). Seven of those sales took place in April, telling me that the investors agree.
Another popular option has been The Club at Brickell Bay, who saw 12 closings with an average price per square foot of $299/square foot. I am not aware of anything out of the ordinary that would cause The Club to be such a good buy right now, aside from the fact that the layouts and location are good and the price is right.
1060 Brickell has also had a good year. There have been 11 total closed sales at a rate of $346/square foot. Our statistics page only reports 9 sales, but that is because we have separated the project into the east and west tower.
I was not surprised to see Icon Brickell’s Tower 1 on the list. Buyers nearly always ask about IconBrickell, despite fears regarding their pool construction. Also, Tower 1 is one of the densest towers in town, with 712 total apartments, so it makes sense that there should be more transactions.
Brickell on the River’s South tower made the list with 10 sales, and that sort of makes sense to me. The building is well-run and the loft-layouts are unique. I typically advise investors to purchase a 1 bedroom in the South tower, but if they are looking for a 2 bedroom, to buy in the North tower. This is because the 1 bedroom plans rent far easier in the South tower because of their loft layout, but the 2 bedroom loft layouts lose a lot of potential tenants because of the lack of privacy from the bedrooms. Since there is competition from newer buildings these days for tenants, you want your investment to appeal to as many people as possible and the 2 bedroom lofts don’t work well for roommate situations or families. The price is also right, averaging $297/square foot.
Speaking of loft layouts, Infinity at Brickell is also on the list with 8 sales at an average of $319/square foot. I remember back in the day when people would complain about the developer selling apartments at Infinity for $255/square foot. Those were the days. A lot of people are under the misconception that Infinity no longer has views because of the construction of SLS Brickell next door. While it is true that SLS blocked some views, most of the units still have at least some bay views and the 00 and 02 lines still have a lot of bay views. Infinity is still one of my favorite buildings, the staff is very friendly and professional, the layouts are nice and since the building is so well-maintained, it does not look like it is about to be 10 years old. At $319/square foot, that is a great bargain for what you get.
One building that really surprised me was BrickellHouse. It didn’t make it into the top 10, but there were 5 sales this year averaging $474/square foot! That is a lot lower than the $600/foot price the original buyers paid, but is still a great number for a building that is probably about to have a special assessment that will make you do a double take and recount those zeros. On the bright side, they did finally find a solution to their parking debacle, so at least we’re moving forward.
Here is the full top10 list of Brickell buildings by transaction count:
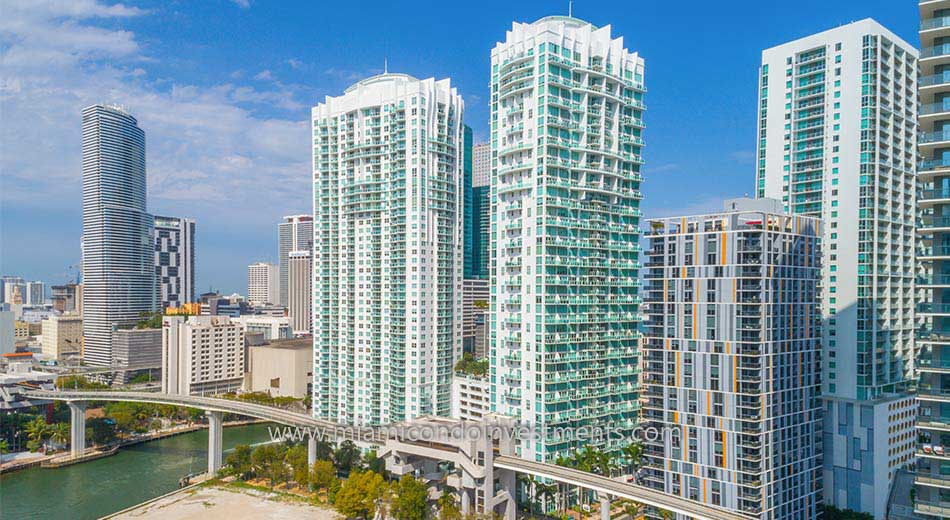
After a few weeks in the Miami Riverfront and Edgewater areas, we’re going to jump back to Brickell for this week’s Market Stat Monday and look into Brickell on the River’s North tower. For the Brickell newbies out there, Brickell on the River was built in 2006 and has 2 towers that share an amenity deck and parking garage, but aside from that are very much different.
The north tower was the first to be built. It has 42 stories and a contemporary feel. The lobby is marble with wooden accents and the condos are all flat, with sizes varying from 1 bedrooms up to 3 bedrooms. The condo association has recently completed a face-lift to the hallways and lobby. I have always viewed this tower as a great option for both end users and investors alike since it has such a great mix of qualities that are attractive to most anyone. Once the north tower was complete, work began on the south tower, that was completed in 2007. The south tower has 46 floors and features a more modern design with duplex lofts rather than the flat apartments with separated bedrooms.
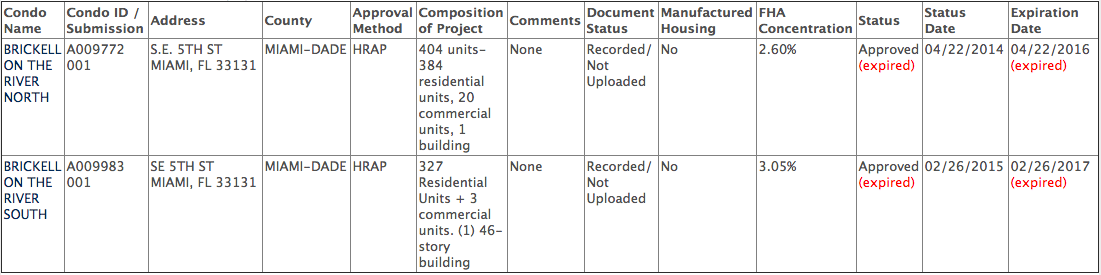
One of the big selling features of Brickell on the River lately has been the fact that it is the only building in Brickell that is approved for FHA financing. Sadly, I have to announce that this approval has expired, but conventional financing is still available.
Even without the FHA approval, the north tower hasn’t been performing to badly lately. There have been 5 closed sales this year with an average price per square foot of $350. One thing that is interesting is the fact that of the 5 recent closings, two have been REO deals (foreclosures). Unit 2503 is a 1 bedroom that closed for a paltry $239,925, which worked out to $309/square foot. Before you go crazy about this ridiculously low-priced sale, you also have to acknowledge that this particular sale seems to have squatters, which are the buyer’s responsibility. The listing noted that the property was occupied and no interior inspections were available… meaning the property cannot be seen in person. That’s pretty hardcore.
In a less dramatic deal, unit 4019 is a two bedroom that closed for $370,000. This one was a Homepath deal, a foreclosure that was taken back by Fannie Mae. I saw this property in person and it was in great shape. It needed only some drapes and was ready to move-in. Someone got a very good deal. That unit would rent for $2,450/month by my estimates.
As for non-distressed sales, we saw a 1 bedroom trade for $330,000 ($365/square foot), and then a two bedroom corner unit that sold for $407,500 ($367/ft). On the 39th floor, a 2 bedroom with 2 parking spaces closed for $415,000.
Overall, the sellers who closed their units accepted 93% of their desired price, staying in line with the rates of negotiation we are seeing in other buildings.
There are currently 3 contracts pending in the building. One is a short sale that was listed for $360,000 for a two bedroom. This one has to be considered an outlier because who knows whether it will get approved and the buyer has to pay the seller’s closing and legal costs. There’s no telling how much that will amount to!
Units 1603 and 2403 are both one bedroom plans and are asking $299,900 and $299,000 respectively. We have also just listed apartment 803 for $283,000, so expect to see an offer come through very quickly!
Aside from apartment 803, there are 33 total active sales in the building. While that does work out to 33 months of inventory at the rate that closings are coming, it is also only 9% of the total units. That is a far better situation than some of the other buildings in the area.
One bedrooms start at $255,000 up to $325,000. Two bedrooms are between $384,000 to $485,000 aside from one two bedroom listing that is a short sale offered for $308,000. I can’t believe we’re talking about short sales again! Even with the short sales and foreclosures that are being marketed, since financing is still possible, I would still consider Brickell on the River North to be a relatively healthy building in this market.
On the rental side, we have seen 24 rented apartments in the last months with an average price of $2.33/square foot. One bedrooms range from $1,850-$2,100, two bedrooms from $2,300-$2,750 and 3 bedrooms around $3,400/month. The average marketing time is 46 days and owners are garnering 96% of their asking price. It is also important to make note that most of the rentals are transacting for the asking price, especially in the lower price points. Furnished rentals tend to be a bit more flexible since they are more challenging to fill, but the unfurnished units are not budging in price.
Current rental availability ranges from $2,150/month-$2,375/month for one bedrooms, $2,500/month-$2,850/month for two bedrooms and $3,200/month-$3,500/month for three bedrooms.
Investing In Condos For AirBnb Income Is A Risky Idea
Despite Miami Beach’s crackdown on AirBnb properties, we receive regular calls from hopeful investors who want to buy properties in order to lease them out on the short term rental website. It is important to understand the risks involved in breaking the rules with hopes of high returns.
Miami Beach Crackdown
Because AirBnb rentals do not contribute to the hotel taxes that largely fund Miami Beach and they take away from the bookings at hotels, they are strictly outlawed. The government is in the midst of a strict crackdown of the policy, levying $20,000 fines on investors who break the rules. That’s $20,000 PER OFFENSE. Unless you’re leasing a $25 million waterfront mansion for $8,000/night to Kylie Jenner, the risk is just not worth the reward.
Many condo associations prohibit rentals of less than 30 days, or even less than 6 months. Some older buildings require owners to wait 1 to 2 years before leasing their condos. It is important to be clear about the rental policies of buildings prior to investing, because your bottom line will be affected if the policies don’t line up with your investment goals.
But what happens if you ignore the condo association rules and continue to lease your property on AirBnb? According to our contact at the management office at Infinity at Brickell, where the minimum lease term is 6 months, fines of $100 per infraction are issued to the owners of the apartments that get caught. He said that it is also not uncommon for visitors to be given violations for failure to obey conduct and noise rules in addition to giving themselves up for being nightly renters by treating the front desk like a front desk at a hotel. Eventually, the fines add up to make the investment not profitable enough to continue.
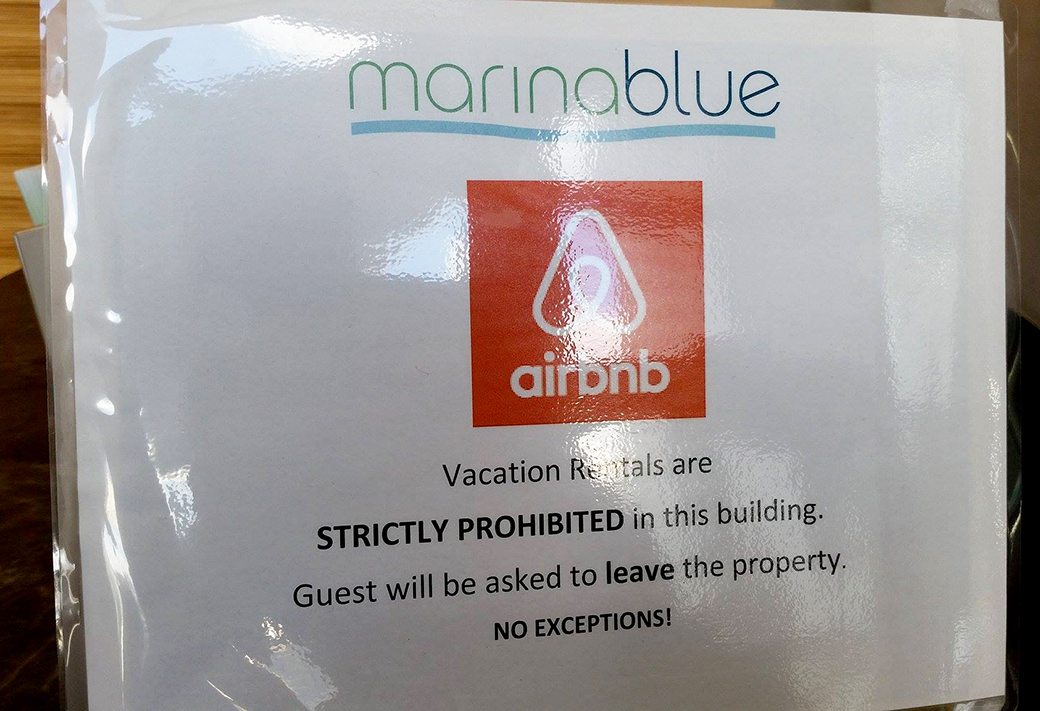
Some other buildings are taking enforcement a step further. Mint at Riverfront requires each applicant to sign an acknowledgment of the rules pertaining to short term rentals. MarinaBlue has posted a sign at the front desk alerting visitors that short term rentals are prohibited and violators will be removed from the premises.
With condo buildings, the issue is about security rather than the hotel tax. Each resident in a condo building must undergo a background check to ensure the safety of all residents. If one condo owner (or tenant) sublets their unit to vacationers, this security measure is compromised.
Renting A Condo To Use As AirBnb Rental Investment
The investors we’ve seen are not only buyers who purchase with the intention to run a short term rental business. We have also seen entrepreneurial tenants inquiring about a strategy of leasing a furnished condo and then subletting it online. This is not only a violation of the City (if the property is in Miami Beach) and condo association policies, but it is a violation of the lease terms. Most Florida leases do not allow subletting, putting the tenant at risk of eviction and penalties.
Landlords who keep yearly tenants have already picked up on this strategy and have begun to screen potential tenants for risk of violation of the subletting section of the lease, but I anticipate more buildings will follow suit with Mint and MarinaBlue over the coming months even if the City of Miami fails to pass their ordinance outlawing short term rentals.
******Update: One Miami East and West have both jumped on the bandwagon with the following stern message to residents, sent today.
February 16, 2017
Dear One Miami Residents,
As the Associations have previously notified you, short term rentals are not permitted in One Miami for periods of less than thirty (30) days. Despite such prior notifications, we have received numerous complaints that certain owners and tenants are in fact renting their units for short term stays in direct violation of the Associations’ governing documents, whether through websites like Airbnb or on their own. The Associations’ have sent (and will continue to send) violation letters to such owners and tenants who are committing these short-term rental violations instructing them to cease and desist from such actions immediately. The next step will likely be for the Associations to file lawsuit(s) against such owner(s) or tenant(s) without further notice. The Associations also reserve the right to deny access to any such unauthorized parties who may be renting from owners on a short-term basis.
We again remind all Members that the Associations’ take such issue very seriously. Therefore, if you are engaging in such improper conduct, please cease and desist from the same immediately. Additionally, if you are aware of a short-term rental violation that is occurring in the building, please report the same to management. Thank you for your assistance.
Sincerely,
Board of Directors of:
One Miami East Condominium Association, Inc.
One Miami West Condominium Association, Inc.
One Miami Master Association, Inc.
January 2017 Brickell Real Estate Market Update
This is a very interesting time in Miami’s real estate market and we are going to start doing more regular market updates of the various neighborhoods and even individual buildings. We’ll start with Brickell, but don’t hesitate to reach out and make a request if there is a specific neighborhood or building that you are curious about.
SALES MARKET
January 2017 brought 41 closed sales in Brickell, according to MLS data, down from 66 in January of 2016. These were seller to buyer transactions, not developer to buyer transactions, since developer to buyer transactions are not reported in the MLS. We will do a separate post with developer-buyer transactions for each building as they open and the sales are recorded.
Although the number of transactions fell, the average price rose to $514,000 for those 41 closed sales. 2016’s average price was $500,000. The average price per square foot also rose to $412/square foot, up from $401/square foot last year. The condos that found buyers had an average time on the market of 163 days, last year was 114 days. It seems the longer marketing time and increasing inventory choices for buyers has made the sellers more eager to sell. The buyers who transacted were able to negotiate down to 92% of the asking price this January, down from 97% of the buyers who bought last January.
The most expensive listing that sold this month was Tower Suite 3801 in Reach at Brickell City Centre. It sold for $1.95M and was offered at $2.1M and the buyer was represented by our very own Lucas Lechuga. We did an in-depth look at the numbers from that transaction last week. The least expensive sale of the month was a $168,000 studio at Brickell’s original condo building, the Four Ambassador.
As of today, there are 1,888 active listings in Brickell (300 of which are new listings in January), averaging $725,000 and $508/square foot. If we continue selling at this rate, we have enough inventory for 46 months of business. With this amount of available alternatives for the buyers, the sellers who are eager to move on from their units need to not only price them aggressively but also hire an agent with strong marketing power so that you stand out from the crowd.
RENTAL MARKET There were 306 new leases signed in January of this year, up from 264 in 2016. The average rental price is $2,466/month, basically the same as last year’s $2,440. The 306 landlords who found new tenants beat out the competition of 1,442 alternative active listings, 465 of which were new listings.
Although the number of transactions is up and the prices are holding firm, the marketing time is increased this year to an average of 79 days on the market. Last year it took an average of 65 days to find a new tenant and move them in.
Tenants should not smell blood in the water yet though. The 306 leases that were signed garnered 96% of the asking price, so lowballing isn’t a thing just yet. The landlords who are not into 2+ months of vacancy are pricing their units well and finding a tenant quickly.
The most expensive rental of the month was the Four Seasons Residences Unit 44C. That one rented for $9,750/month. The least expensive was a studio at The Club at Brickell Bay for $1,400. It is important to note that the entry-level apartments in the neighborhood are less likely to negotiate price. Brickell is increasingly a hot neighborhood, so the entry point options are very much in demand.
What trends do you anticipate for Brickell? Weigh in and we’ll follow back up next month!
Market Update: Brickell Condo Sales
Penthouse view from Nine at Mary Brickell Village – PH08
Many people have been debating recently on the state of Miami’s condo market, and sometimes it is difficult to tell whether they are overly optimistic, pessimistic, in denial or leading us on. Is the market declining? Are we in a bubble? Are we in for a crash? Here are a few notes that we have made about the Brickell condo market that will be of use to residents, buyers and sellers alike.
The statistics listed below are accurate at the time of publishing. For statistics updated daily, visit the building and neighborhood pages linked in this post.
Brickell Statistics
Average sales price/square foot (over previous 6 months): $554
Average marketing time for listings that ultimately sell (over previous 6 months): 134 days
Buildings that currently have the most available sales
Lowest Priced Sale: 540 Brickell Key Drive #1509
This apartment is a 470 square foot studio in Brickell Key II with partial bay & city views. It was originally built in 1991 and was listed for $219,900 then sold for $177,510 cash after 101 days on the market.
Highest Priced Sale: 1643 Brickell Avenue #4401
For $6,550,000 the new owners of Santa Maria 4401 will enjoy direct bay and city views from this flow-through residence on the 44th floor. The apartment has 4 bedrooms, 6 1/2 baths, private elevator, his/hers master suite and staff quarters. Santa Maria was built in 1997 and this apartment was originally listed for $7,000,000 then sold for cash after 21 days on the market.
Living room with bay view in Santa Maria #4401 Photo credit: MLS
Stay tuned for our update of the preconstruction market!