New Miami Condo Buildings With Tennis Courts
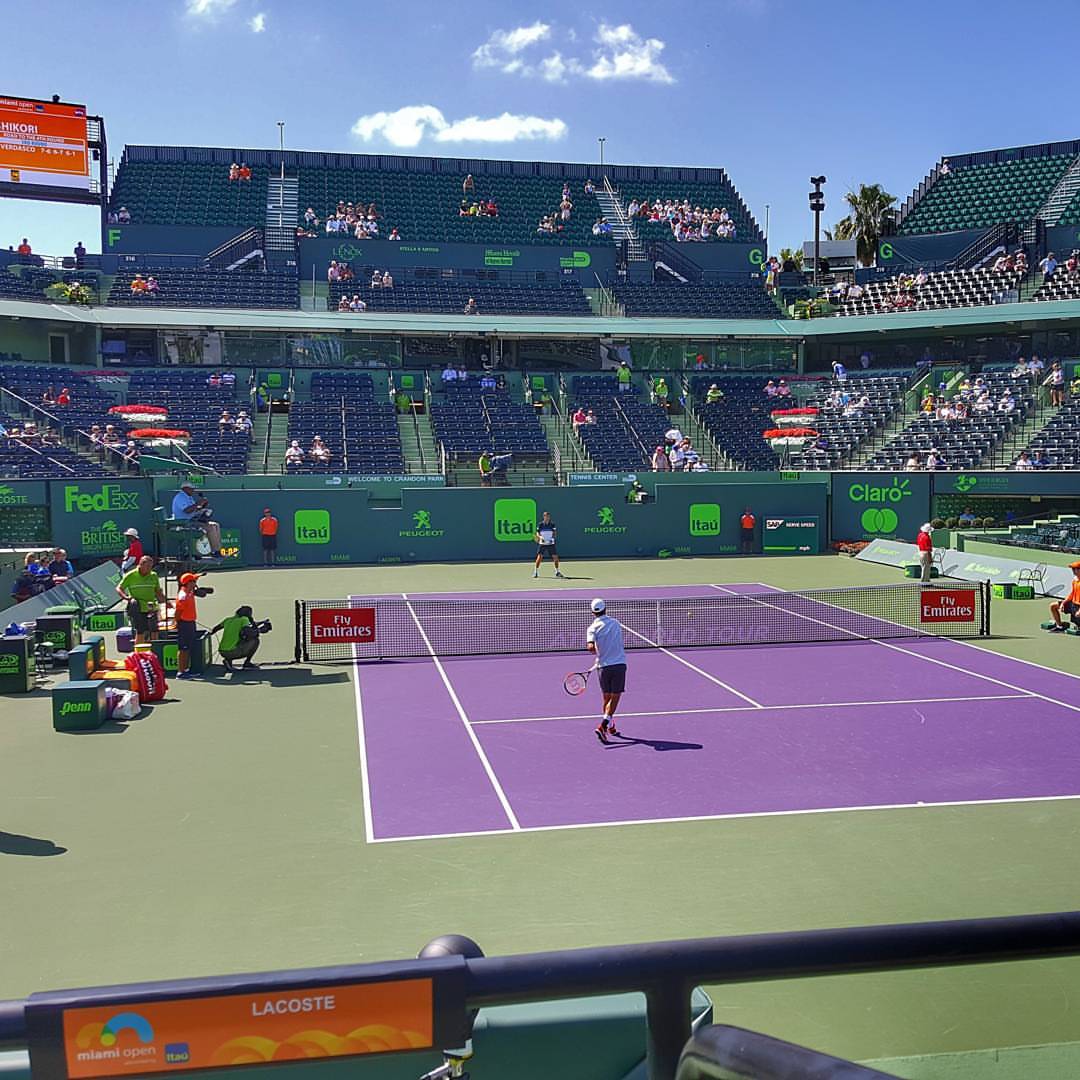
This time of year brings one of our favorite events to Miami. The Miami Open runs from March 19-April 1 this year, and to commemorate it, let’s have a look at our favorite buildings in the greater downtown area that have tennis courts!
If living in a brand-new condo is important to you, there are several in the pipeline. Key International’s 1010 Brickell is slated to open within a few weeks. They have an indoor tennis court and 3 remaining presales starting at $950,000. All are 3 bedroom layouts. There is one resale unit on the market so far. SLS Lux is also on track for completion this fall/winter. They have only four penthouses remaining that have recently been repriced.
In Downtown, Paramount Miami Worldcenter is going to bring every amenity imaginable to their mega-project. They are about 60% sold and have residences priced at an average of $750/square foot. Because of their strong sales figures, they were recently able to secure the second largest construction loan in this build cycle. They are currently in vertical construction and should deliver keys at the end of 2018.
If you’re looking for something sooner, you could head up to Edgewater and check out Biscayne Beach. They have 2 tennis courts over their parking deck and a bayfront beach club. They have 5 remaining presale opportunities, and we will be listing an amazing high floor 3 bedroom on the southeast corner.
For people who are looking for an integrated community, I would suggest the waterfront Paraiso complex. There are five residential sections to the complex, totaling 1400 units. Paraiso Bayviews is the most affordable section, with remaining inventory starting at $470k (as of today). They just passed the 42nd floor of construction and should be ready by the end of this year. Paraiso Bay was the first of the towers to open sales. They are currently all sold out and on track to open this summer. GranParaiso is the most luxurious of the towers. It will be finished in Spring of 2018 and has 2 bedroom residences starting at $1 million. One Paraiso is the sister building to Paraiso Bay. They have 3 remaining penthouses, starting at $1.9 million. Aside from the towers, there is also a small enclave of bayfront beach homes. There are only 8 in total and 1 remains at $2 million.
Hyde Midtown is going to be the first project in Midtown to offer a tennis court for residents. They recently topped off at 80% sold. Their prices start in the mid $400,000’s and the rooftop penthouses start at just $735,000! The penthouses have rooftop terraces as well.
Come back tomorrow and we can take a look at the existing buildings who also offer tennis courts!
The Mark on Brickell 3 Bedroom – $365,000
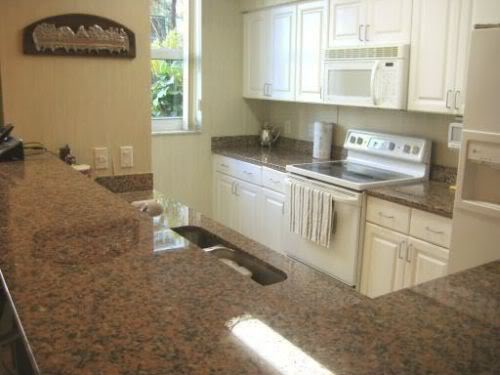

If you are in the market for a 3 bedroom condo in Brickell but on a limited budget, you might want to consider this property at The Mark on Brickell. I came across it while conducting a search on the MLS on behalf of a client and was surprised at the price. It’s a 3 bedroom/2 bath condo with 1,470 interior square feet and travertine and wood flooring throughout. The asking price is $365,000, or $248 per square foot, which is an exceptional value to be in a waterfront building in Brickell. The unit does not have a water view but one should not be expected at this price point. Expect to pay at least $100,000 more for a 3 bedroom in Brickell if you require a water view. This condo is located on the 6th floor with direct access to the pool deck which does offer panoramic views of Biscayne Bay. The unit is currently tenant-occupied but the lease ends next month.


The Brickell Rental Market Under a Microscope
The rental market is a very interesting segment of the real estate market, not only for potential tenants on the prowl for a new pad but also current landlords and would-be investors trying to assess the demand for rentals across various neighborhoods and, more specifically, across various condo developments. Only a few years ago, the supply of rentals in Miami far outpaced demand. As a result, rental prices plunged and renters ruled the day. Fast forward to the present and an entirely different rental market is upon us in Miami. Nowadays, rental inventory is being absorbed quickly and overall rental prices are on the rise. For those living in Miami, I’m sure this a message that you have not only read in the local paper but have also heard directly from friends and family who have experienced it firsthand.
Obviously, not all neighborhoods and condo developments are created equal. Factors such as price, location, views, quality and recommendations from peers help determine rental demand. As a result, one would assume that demand can vary greatly from building to building and even neighborhood to neighborhood. Which condo developments are the leaders when it comes to rental demand and which are the laggards? More importantly, which buildings should we expect to see prices climb in the near future?
In this first segment, I decided to analyze the Brickell rental market to answer the above questions. Below, you will find a spreadsheet containing rental data for various condo developments in Brickell. Click the link below the spreadsheet to view it in its entirety.
Brickell Rental Market as of March 01, 2011
Columns C through G show the number of available rentals pertaining to each condo development grouped by number of bedrooms. Column I displays the total number of rentals available in each condo development while column J shows the total number of units within that development. I debated whether or not to include column K, the number of available rentals over the total number of units in the development expressed as a percentage, because the figure can be deceiving in buildings where developer inventory remains which has neither been sold nor rented. This is the case in buildings such as Icon Brickell and Infinity at Brickell. Regardless, I decided to include the figure because it can provide additional insight in buildings where this is not the case.
The main objective in creating this spreadsheet was to calculate months of inventory for each condo development. This can be seen in column M. Months of inventory was calculated by dividing total units available for rent by the monthly average number of units rented over a 3-month period from November 16, 2010 to February 15, 2011. You may be wondering why I did not include closed rental data from the past two weeks in determining the monthly average. I have noticed that it can take real estate agents days, and even weeks, to change the status of a rental in the MLS from pending to rented. As a result, I felt that the average would be skewed to the downside and not be an accurate representation of the Brickell rental market. Furthermore, if I had to venture a guess, I would also say that it is highly likely that around 10 percent of the total number of units available for rent are in fact no longer available. In this case, the listing agent has yet to change the status from available to pending.
Regardless, a lot can be ascertained from the spreadsheet above. In my opinion, any building with 1.5 months of inventory or less has a solid rental market. 1060 Brickell, The Plaza on Brickell and Vue at Brickell are standouts with absorption rates hovering around one month. I expect rentals prices in these developments to continue to rise in the near future. For those in the market to lease a condo in one of these developments, I advise that you act quickly and put your best foot forward when making an offer.
According to the spreadsheet, there is currently 2.29 months of rental inventory available in Brickell. Some may expect this number to increase as more units from Icon Brickell and Infinity at Brickell hit the rental market. Of course, this will all depend on how quickly the units become available and at what pace demand absorbs them. Only time will tell, but I plan to watch Brickell rental market closely and post updates on a monthly basis.
I would love to hear your thoughts and comments.
Brickell Condo Index – August 2010

The Brickell Condo Index is back! It has been a year and a half since I last published the Brickell Condo Index. Fortunately, eighteen months is a good reference point and definitely enough time where one would expect a lot to have changed with the condo market. For those of you who haven’t followed this blog that long, the Brickell Condo Index is an in-depth look at the various condo buildings in Brickell with various statistics included to illustrate the health or weakness of each building.
I hate to be the bearer of bad news but this will be the last Brickell Condo Index to appear on this blog. From here on out, the Brickell Condo Index, as well as other neighborhood indexes, will only be made available via email. Early next week, I will unveil a new version of the Miami Condo Investments website. The new website will be much easier to navigate, have a lot more content, load considerably faster and, most importantly, allow you to register to our Miami Condo Investments weekly newsletter. The weekly newsletter will contain the best condo deals of the week, relevant news stories and exclusive market data such as the neighborhood condo indexes. The neighborhood condo indexes will be emailed the Sunday following the 15th of each month, the day that I have chosen to collect and compile the data. Each neighborhood will be represented every six months as follows: Brickell this month, Brickell Key next month, Downtown Miami in October, the Edgewater in November, South Beach in December and the Miami River area in January. The cycle will then start all over so a neighborhood update is provided twice per year. In the meantime, if you’d like to be included on the newsletter list then simply send us an email at [email protected] and convey your interest to be placed on the list. The blog will not change and will continue to be updated but the market data reports will only be made available via our newsletter.
Before we get into this month’s numbers, let me discuss a few changes that I made to the Brickell Condo Index since the last update in February 2009. First, I excluded One Miami from the index. One Miami will be included in the Downtown Miami Condo Index in October. Second, Latitude on the River and Neo Vertika were also excluded. Both will appear in the Miami River Condo Index in January 2010. Third, I decided to include 1060 Brickell, 500 Brickell, Brickell on the River South and The Plaza on Brickell. Each has had enough closed resales to warrant their inclusion in the Brickell Condo Index. Fourth, I decided to bring back The Sail on Brickell. As of late, I’ve seen much more interest in the building due to its price point and it is much healthier than it was in October 2007 when I dropped it from the index. I guess you can say that it’s officially off the pink sheets. There are now a total of twenty buildings in the Brickell Condo Index whereas before there were eighteen. Last, but not least, I decided to round the price per square foot calculations. I think it makes everything easier to read and I honestly don’t think excluding the two decimal points makes the figures any less insightful.
As per the MLS, the average of the asking prices of the twenty condo buildings that now represent the Brickell Condo Index is $376 per square foot. The average asking price per square foot for each Brickell condo building individually can be found below:
- 1060 Brickell – 1050 & 1060 Brickell Ave – $375
- 500 Brickell – 500 Brickell Ave & 55 SE 6 St – $362
- Atlantis on Brickell – 2025 Brickell Ave – $255
- Brickell on the River North – 31 SE 5 St – $268
- Brickell on the River South – 41 SE 5 St – $276
- Bristol Tower – 2127 Brickell Ave – $471
- Emerald at Brickell – 218 SE 14 St – $348
- Four Seasons Residences – 1425 Brickell Ave – $954
- Imperial at Brickell – 1627 Brickell Ave – $285
- Jade Brickell – 1331 Brickell Bay Dr – $532
- Santa Maria – 1643 Brickell Ave – $691
- Skyline on Brickell – 2101 Brickell Ave – $352
- Solaris at Brickell – 186 SE 12 Ter – $189
- The Club at Brickell Bay – 1200 Brickell Bay Dr – $285
- The Mark on Brickell – 1155 Brickell Bay Dr – $313
- The Palace – 1541 Brickell Ave – $298
- The Plaza on Brickell – 951 Brickell Ave & 950 Brickell Bay Dr – $394
- The Sail on Brickell – 170 SE 14 St – $299
- Villa Regina – 1581 Brickell Ave – $350
- Vue at Brickell – 1250 S Miami Ave – $214
At the bottom of this post, I included a chart that shows how each of the above figures compares with those published in February 2009. Solaris at Brickell experienced the largest drop with average asking prices there falling slightly over 40 percent. Three of the buildings saw a slight increase in their average asking price per square foot within the past eighteen months. These were Bristol Tower, Four Seasons Residences and Villa Regina.

Below, you’ll find the average price per square foot for Brickell condos sold in the MLS within the six month period from February 1, 2010 to July 31, 2010. I decided to do it this way because I’ve noted that oftentimes it takes agents a few weeks to change the status of a listing in the MLS from pending to closed. The neighborhood as a whole sold at an average price per square foot of $285 during that time period.
The biggest surprise in the figures above when compared to those in February 2009 is Jade Brickell. The average price per square foot for closed sales during the previous six months increased a little over 14 percent when compared to the figures published eighteen months ago. Other buildings that experienced an increase are Skyline on Brickell, The Mark on Brickell, Villa Regina and Vue at Brickell. With the exception of Villa Regina, these buildings were some of the hardest hit in Brickell when the market collapsed mainly due to the large amount of mortgage fraud that took place in these buildings. The Club at Brickell Bay and Solaris at Brickell are two other buildings in Brickell that were heavily victimized by mortgage fraud. The Club at Brickell Bay saw about a 1 percent decrease in average closed sales prices while prices at Solaris at Brickell fell slightly over 9 percent. This actually makes sense since the fallout at Solaris at Brickell didn’t take place until about a year after the others. Also worth mentioning, prices at Santa Maria fell a little over 4 percent within the past eighteen months but the numbers were a bit skewed due to Penthouse 4901 recently selling for $1,100 per square foot. The average for the past six months would have been much lower had it not been for that sale.
Below you will find some additional statistics. Click on the image to enlarge it.

The first column to the right of each condo development name is the difference in the average sales price and list price for this month, expressed as a percentage. A high percentage indicates that there is a large discrepancy between the average asking price for condos currently on the market and what has actually sold within the past six months. In other words, many of the sellers in these buildings are delusional and are in need of a reality check. For example, 1060 Brickell has a very large discrepancy because there are quite a few units asking over $400 per square foot and even some asking over $560 per square foot while closed sales have averaged around $208 per square foot within the past six months.
The second column shows the number of active listings currently in the MLS for each condo development. The third column shows the percentage that these listings represent over the total number of condo units in each development. The cells highlighted in green reveal those condo developments that have active listings that that represent less than 10 percent of the overall units in the building. This is typically one indication of a sound condo building. When I first started doing the Brickell Condo Index in 2007 many of the cells in this column were highlighted in red, indicating that active listings represented over 20 percent of the building. This was always a good indication that prices would fall further in these buildings. For example, in February 2009, active listings at Solaris at Brickell represented slightly over 20 percent of the building. That was the largest percentage of listings at that time and it is not a coincidence that eighteen months later prices fell the most at Solaris at Brickell of all the buildings represented in the Brickell Condo Index.
The fourth column reveals the number of condos currently pending sale in each building. The Club at Brickell Bay has a whopping 42 pending sales at this time and there are a total of 155 pending sales in all of the buildings combined. In February 2009, there were only 81 pending sales although a total of twenty buildings are now present in the Brickell Condo Index rather than eighteen. The fifth column displays the number of closed sales from February 1, 2010 to July 31, 2010. Once again, The Club at Brickell Bay leads the way with a total of 38 closed sales in that time period. It’s interesting to note that there were 20 more closed sales in the six months prior to February 2009 when compared to the current closing numbers even though the index now has two additional buildings.
The sixth column shows the difference in the average list prices from this month’s and February 2009’s, expressed as a percentage. Those highlighted in red reveal those condo developments which had a drop in their average list price while those highlighted in green show those that experienced an increase.
The seventh column reveals the difference in average sales prices from this month’s and February 2009’s, expressed a percentage. Once again, those highlighted in green represent an increase while those highlighted in red represent a decrease.
Well, that’s all for today. Have fun with the numbers. Time for me to get back to work on the new website.

The Mark on Brickell Granted Special Approval Designation by Fannie Mae


I was notified earlier this week that The Mark on Brickell was granted the Special Approval Designation by Fannie Mae. This news hasn’t been disclosed on the Fannie Mae website yet but the information has been confirmed. It should appear on the site this upcoming Monday when their next update is released. It will now be possible for qualified buyers to obtain a conventional loan for condos at The Mark on Brickell.
The Mark on Brickell recently completed the installation of a seawall between the building and the bay that cost nearly $500,000. This expense, however, is expected to save the association hundreds of thousands of dollars in insurance every year.
Currently, inventory at The Mark on Brickell is rather light. The 22 listings for sale in the MLS represent just slightly over 6 percent of the total number of units in the building. 11 total units have closed at The Mark on Brickell within the past six months. Furthermore, there are currently 10 pending sales in the MLS. These sales figures should only get better now that the building is Fannie Mae approved. For those who are curious, there are currently just 10 units available for rent at The Mark on Brickell in the MLS. That represents slightly less than 3 percent of the total number of units in the building.
I plan to release overall inventory figures for Miami-Dade County next week. I fully expect the data to show a significant improvement since the last time I provided an update in July 2009.
Brickell & Brickell Key Closed Condo Sales – November 2009
Click on the links below to view the condo sales in Brickell and Brickell Key closed in November 2009:

Brickell Closed Condo Sales – November 2009 – There were 30 closed condo sales in Brickell last month. The average sales price of these condos was $243 per square foot. I was surprised to see that a one bedroom condo at Skyline on Brickell sold for $334 per square foot.

Brickell Key Closed Condo Sales – November 2009 – 10 condos in Brickell Key closed last month. These sold at an average sales price per square foot of $258. Here I was shocked to see that someone would be willing to pay $294 per square foot for a unit at Isola, especially one with carpeting.
Top 5 Distressed Condo Sales Closed in September 2009
Below, you will find what I believe to be the five best condo deals of the 53 distressed sales that closed in the month of September in the MLS located in Brickell, Brickell Key, Downtown Miami and the Arts District. It was tough to decide between the first two for the number one spot but The Mark on Brickell #1608 took it based on location and view.
- The Mark on Brickell #1608 – 2 bedroom/2 bath (1,140 square feet) – This unit sold for $210,000, or $184 per square foot, on September 18, 2009. Short Sale
- Blue Condominium #1701 – 2 bedroom/2.5 bath (1,449 square feet) – This unit sold for $210,000, or $145 per square foot, on September 10, 2009. Foreclosure
- Brickell on the River North #3715 – 3 bedroom/2.5 bath (1,512 square feet) – This unit sold for $287,000, or $190 per square foot, on September 4, 2009. Short Sale
- Jade Brickell #1201 – 2 bedroom/2.5 bath (1,878 square feet) – This unit sold for $675,000, or $359 per square foot, on September 30, 2009. Foreclosure
- Marina Blue #2302 – 1 bedroom/1.5 bath (843 square feet) – This unit sold for $190,000 or $225 per square foot, on September 30, 2009. Short Sale
As a side note, bidding on foreclosures has become extremely competitive. I noticed that the majority of the condo REOs that closed in September closed at a price that was above the asking price. This was the case in 19 of the 26 REO listings that closed last month located in the aforementioned neighborhoods of Miami. It has become more important than ever to know the comparable sales in the neighborhood. The mentality of automatically going in with a bid 10-15 percent below asking price doesn’t fly anymore. With season right around the corner, I’m confident that the worst is well behind us.
Top 5 Distressed Condo Sales Closed in May 2009
Below, you will find what I believe to be the five best condo deals of the 46 distressed sales that closed in the month of May in the MLS located in Brickell, Brickell Key, Downtown Miami and the Arts District. I think the distressed condos that closed in the month of May were better deals than what we have seen in previous months.
- Jade Brickell – unit 1002 – 2 bedroom/2 bath (1,529 square feet) – This unit sold for $375,000, or $245 per square foot, on May 15, 2009. Short Sale
- Courts Brickell Key – unit 1909 – 3 bedroom/3 bath (1,488 square feet) – This unit sold for $350,000, or $235 per square foot, on May 20, 2009. Short Sale
- Skyline on Brickell – unit 306 – 2 bedroom/2 bath (1,367 square feet) – This unit sold for $349,000, or $255 per square foot, on May 8, 2009. Foreclosure
- Skyline on Brickell – unit 1512 – 2 bedroom/2 bath (1,367 square feet) – This unit sold for $305,000, or $223 per square foot, on May 18, 2009. Short Sale
- One Miami – unit 3916 – 1 bedroom/1 bath (846 square feet) – This unit sold for $150,000 or $177 per square foot, on May 27, 2009. Foreclosure
Runner-ups:
- The Mark on Brickell – unit 1001 – 2 bedroom/2 bath (1,200 square feet) – This unit sold for $205,000, or $171 per square foot, on May 22, 2009. Foreclosure
- 1800 Biscayne Plaza – unit 203 – 2 bedroom/2 bath (1,057 square feet) – This unit sold for $120,000, or $114 per square foot, on May 01, 2009. Short Sale
- Cite on the Bay – unit 2213 – 1 bedroom/1 bath (795 square feet) – This unit sold for $100,000, or $126 per square foot, on May 13, 2009. Foreclosure
Top 5 Miami Distressed Condo Sales Closed in March 2009
Below, you will find what I believe to be the five best condo deals of the 47 distressed sales that closed in the month of March in the MLS located in Brickell, Brickell Key, Downtown Miami, and the Arts District.
- The Mark on Brickell – unit 2702 – 3 bedroom/2 bath (1,470 square feet) – This unit sold for $251,000, or $171 per square foot, on March 20, 2009. Short Sale
- Brickell on the River – unit 3305 – 1 bedroom/1 bath (757 square feet) – This unit sold for $125,000, or $165 per square foot, on March 17, 2009. Foreclosure
- Vue at Brickell – unit 812 – 1 bedroom/1.5 bath (860 square feet) – This unit sold for $90,000, or $105 per square foot, on March 9, 2009. Foreclosure
- Neo Vertika – unit 1525 – 0 bedroom/1 bath (638 square feet) – This unit sold for $98,500 or $154 per square foot, on March 19, 2009. Foreclosure
- Uptown Lofts – unit 1003 – 1 bedroom/2 bath (1,065 square feet) – This unit sold for $100,000, or $94 per square foot, on March 19, 2009. Foreclosure
Runner-up – 1800 Biscayne Plaza – unit 1107 – 3 bedroom/2 bath (1,318 square feet) – This unit sold for $200,000, or $152 per square foot, on March 11, 2009. Short Sale


