Brickell Condo Tour and Construction Update [VIDEO] – February 14, 2015
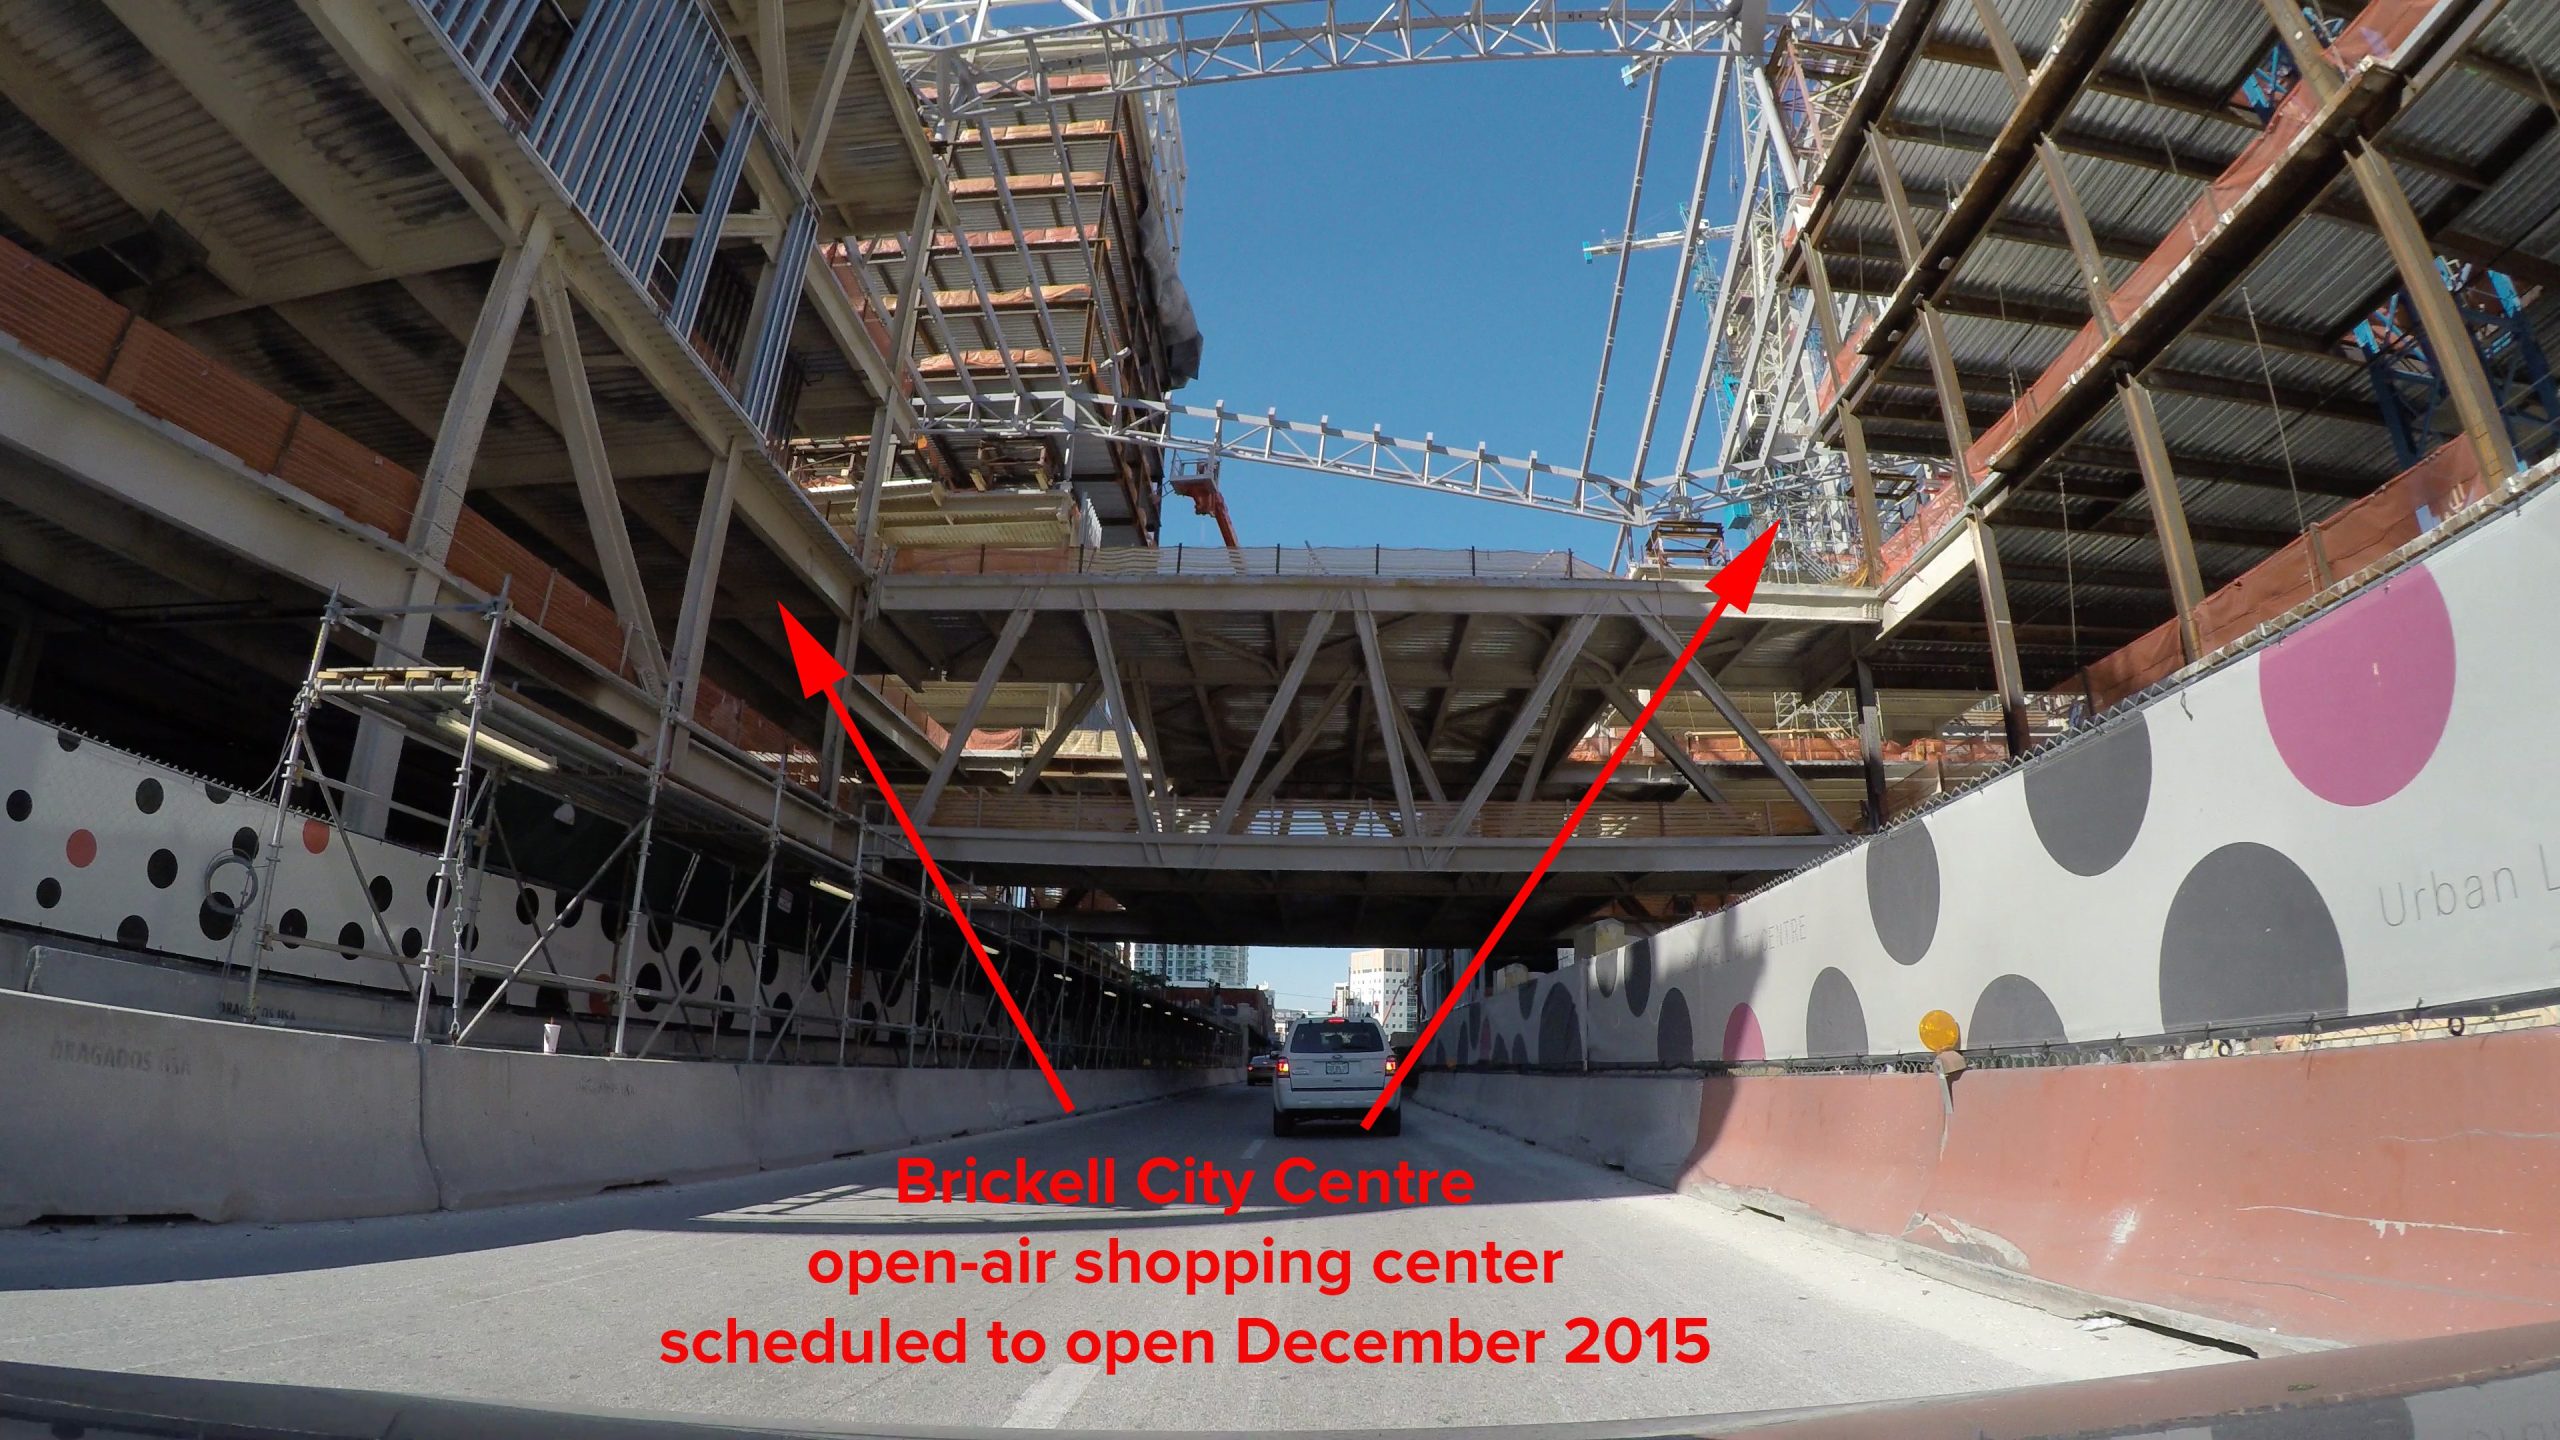
It has been about four months since my last video tour covering the fast paced development taking place in Brickell Since then a lot has happened so I figured it was time to get back out on the road and provide everyone with another update As you will see this video is much more comprehensive covering not only current and future construction but also existing condo developments for those who may be unfamiliar or newly acquainted with the Brickell condo market In the video I even highlighted two large commercial properties in Brickell which recently traded hands the SunTrust building located at 777 Brickell Avenue which sold earlier this week for $140M and the former Capital at Brickell site located at 1420 South Miami Avenue which was acquired this past December for $7474M by CCCC International USA LLC a subsidiary of Beijings China City Construction and American Da Tang Group of New York
Below are five recent luxury sales that have closed in Miami within the past 30 days. The unit at 900 Biscayne Bay marks the highest priced condo sale in the building for a non-penthouse unit.
Four Seasons Residences 49F – 3 bedroom/3.5 bath (3,795 square feet) – This condo sold for $3,025,000, or $797 per square foot, on February 17, 2011.
Four Seasons Residences 46B – 2 bedroom/2.5 bath (2,309 square feet) – This condo sold for $1,500,000, or $650 per square foot, on February 28, 2011.
Asia Brickell Key 1002 – 2 bedroom/2.5 bath (1,781 square feet) – This condo sold for $1,200,000, or $674 per square foot, on March 8, 2011.
900 Biscayne Bay 4006 – 3 bedroom/4 bath (2,335 square feet) – This condo sold for $1,100,000, or $471 per square foot, on February 28, 2011.
Bristol Tower 2101 – 3 bedroom/3.5 bath (3,065 square feet) – This condo sold for $419 per square foot, on March 11, 2011.
The Brickell Rental Market Under a Microscope
The rental market is a very interesting segment of the real estate market, not only for potential tenants on the prowl for a new pad but also current landlords and would-be investors trying to assess the demand for rentals across various neighborhoods and, more specifically, across various condo developments. Only a few years ago, the supply of rentals in Miami far outpaced demand. As a result, rental prices plunged and renters ruled the day. Fast forward to the present and an entirely different rental market is upon us in Miami. Nowadays, rental inventory is being absorbed quickly and overall rental prices are on the rise. For those living in Miami, I’m sure this a message that you have not only read in the local paper but have also heard directly from friends and family who have experienced it firsthand.
Obviously, not all neighborhoods and condo developments are created equal. Factors such as price, location, views, quality and recommendations from peers help determine rental demand. As a result, one would assume that demand can vary greatly from building to building and even neighborhood to neighborhood. Which condo developments are the leaders when it comes to rental demand and which are the laggards? More importantly, which buildings should we expect to see prices climb in the near future?
In this first segment, I decided to analyze the Brickell rental market to answer the above questions. Below, you will find a spreadsheet containing rental data for various condo developments in Brickell. Click the link below the spreadsheet to view it in its entirety.
Brickell Rental Market as of March 01, 2011
Columns C through G show the number of available rentals pertaining to each condo development grouped by number of bedrooms. Column I displays the total number of rentals available in each condo development while column J shows the total number of units within that development. I debated whether or not to include column K, the number of available rentals over the total number of units in the development expressed as a percentage, because the figure can be deceiving in buildings where developer inventory remains which has neither been sold nor rented. This is the case in buildings such as Icon Brickell and Infinity at Brickell. Regardless, I decided to include the figure because it can provide additional insight in buildings where this is not the case.
The main objective in creating this spreadsheet was to calculate months of inventory for each condo development. This can be seen in column M. Months of inventory was calculated by dividing total units available for rent by the monthly average number of units rented over a 3-month period from November 16, 2010 to February 15, 2011. You may be wondering why I did not include closed rental data from the past two weeks in determining the monthly average. I have noticed that it can take real estate agents days, and even weeks, to change the status of a rental in the MLS from pending to rented. As a result, I felt that the average would be skewed to the downside and not be an accurate representation of the Brickell rental market. Furthermore, if I had to venture a guess, I would also say that it is highly likely that around 10 percent of the total number of units available for rent are in fact no longer available. In this case, the listing agent has yet to change the status from available to pending.
Regardless, a lot can be ascertained from the spreadsheet above. In my opinion, any building with 1.5 months of inventory or less has a solid rental market. 1060 Brickell, The Plaza on Brickell and Vue at Brickell are standouts with absorption rates hovering around one month. I expect rentals prices in these developments to continue to rise in the near future. For those in the market to lease a condo in one of these developments, I advise that you act quickly and put your best foot forward when making an offer.
According to the spreadsheet, there is currently 2.29 months of rental inventory available in Brickell. Some may expect this number to increase as more units from Icon Brickell and Infinity at Brickell hit the rental market. Of course, this will all depend on how quickly the units become available and at what pace demand absorbs them. Only time will tell, but I plan to watch Brickell rental market closely and post updates on a monthly basis.
I would love to hear your thoughts and comments.
Brickell Condo Index – August 2010
The Brickell Condo Index is back! It has been a year and a half since I last published the Brickell Condo Index. Fortunately, eighteen months is a good reference point and definitely enough time where one would expect a lot to have changed with the condo market. For those of you who haven’t followed this blog that long, the Brickell Condo Index is an in-depth look at the various condo buildings in Brickell with various statistics included to illustrate the health or weakness of each building.
I hate to be the bearer of bad news but this will be the last Brickell Condo Index to appear on this blog. From here on out, the Brickell Condo Index, as well as other neighborhood indexes, will only be made available via email. Early next week, I will unveil a new version of the Miami Condo Investments website. The new website will be much easier to navigate, have a lot more content, load considerably faster and, most importantly, allow you to register to our Miami Condo Investments weekly newsletter. The weekly newsletter will contain the best condo deals of the week, relevant news stories and exclusive market data such as the neighborhood condo indexes. The neighborhood condo indexes will be emailed the Sunday following the 15th of each month, the day that I have chosen to collect and compile the data. Each neighborhood will be represented every six months as follows: Brickell this month, Brickell Key next month, Downtown Miami in October, the Edgewater in November, South Beach in December and the Miami River area in January. The cycle will then start all over so a neighborhood update is provided twice per year. In the meantime, if you’d like to be included on the newsletter list then simply send us an email at [email protected] and convey your interest to be placed on the list. The blog will not change and will continue to be updated but the market data reports will only be made available via our newsletter.
Before we get into this month’s numbers, let me discuss a few changes that I made to the Brickell Condo Index since the last update in February 2009. First, I excluded One Miami from the index. One Miami will be included in the Downtown Miami Condo Index in October. Second, Latitude on the River and Neo Vertika were also excluded. Both will appear in the Miami River Condo Index in January 2010. Third, I decided to include 1060 Brickell, 500 Brickell, Brickell on the River South and The Plaza on Brickell. Each has had enough closed resales to warrant their inclusion in the Brickell Condo Index. Fourth, I decided to bring back The Sail on Brickell. As of late, I’ve seen much more interest in the building due to its price point and it is much healthier than it was in October 2007 when I dropped it from the index. I guess you can say that it’s officially off the pink sheets. There are now a total of twenty buildings in the Brickell Condo Index whereas before there were eighteen. Last, but not least, I decided to round the price per square foot calculations. I think it makes everything easier to read and I honestly don’t think excluding the two decimal points makes the figures any less insightful.
As per the MLS, the average of the asking prices of the twenty condo buildings that now represent the Brickell Condo Index is $376 per square foot. The average asking price per square foot for each Brickell condo building individually can be found below:
1060 Brickell – 1050 & 1060 Brickell Ave – $375
500 Brickell – 500 Brickell Ave & 55 SE 6 St – $362
Atlantis on Brickell – 2025 Brickell Ave – $255
Brickell on the River North – 31 SE 5 St – $268
Brickell on the River South – 41 SE 5 St – $276
Bristol Tower – 2127 Brickell Ave – $471
Emerald at Brickell – 218 SE 14 St – $348
Four Seasons Residences – 1425 Brickell Ave – $954
Imperial at Brickell – 1627 Brickell Ave – $285
Jade Brickell – 1331 Brickell Bay Dr – $532
Santa Maria – 1643 Brickell Ave – $691
Skyline on Brickell – 2101 Brickell Ave – $352
Solaris at Brickell – 186 SE 12 Ter – $189
The Club at Brickell Bay – 1200 Brickell Bay Dr – $285
The Mark on Brickell – 1155 Brickell Bay Dr – $313
The Palace – 1541 Brickell Ave – $298
The Plaza on Brickell – 951 Brickell Ave & 950 Brickell Bay Dr – $394
The Sail on Brickell – 170 SE 14 St – $299
Villa Regina – 1581 Brickell Ave – $350
Vue at Brickell – 1250 S Miami Ave – $214
At the bottom of this post, I included a chart that shows how each of the above figures compares with those published in February 2009. Solaris at Brickell experienced the largest drop with average asking prices there falling slightly over 40 percent. Three of the buildings saw a slight increase in their average asking price per square foot within the past eighteen months. These were Bristol Tower, Four Seasons Residences and Villa Regina.
Below, you’ll find the average price per square foot for Brickell condos sold in the MLS within the six month period from February 1, 2010 to July 31, 2010. I decided to do it this way because I’ve noted that oftentimes it takes agents a few weeks to change the status of a listing in the MLS from pending to closed. The neighborhood as a whole sold at an average price per square foot of $285 during that time period.
The biggest surprise in the figures above when compared to those in February 2009 is Jade Brickell. The average price per square foot for closed sales during the previous six months increased a little over 14 percent when compared to the figures published eighteen months ago. Other buildings that experienced an increase are Skyline on Brickell, The Mark on Brickell, Villa Regina and Vue at Brickell. With the exception of Villa Regina, these buildings were some of the hardest hit in Brickell when the market collapsed mainly due to the large amount of mortgage fraud that took place in these buildings. The Club at Brickell Bay and Solaris at Brickell are two other buildings in Brickell that were heavily victimized by mortgage fraud. The Club at Brickell Bay saw about a 1 percent decrease in average closed sales prices while prices at Solaris at Brickell fell slightly over 9 percent. This actually makes sense since the fallout at Solaris at Brickell didn’t take place until about a year after the others. Also worth mentioning, prices at Santa Maria fell a little over 4 percent within the past eighteen months but the numbers were a bit skewed due to Penthouse 4901 recently selling for $1,100 per square foot. The average for the past six months would have been much lower had it not been for that sale.
Below you will find some additional statistics. Click on the image to enlarge it.
The first column to the right of each condo development name is the difference in the average sales price and list price for this month, expressed as a percentage. A high percentage indicates that there is a large discrepancy between the average asking price for condos currently on the market and what has actually sold within the past six months. In other words, many of the sellers in these buildings are delusional and are in need of a reality check. For example, 1060 Brickell has a very large discrepancy because there are quite a few units asking over $400 per square foot and even some asking over $560 per square foot while closed sales have averaged around $208 per square foot within the past six months.
The second column shows the number of active listings currently in the MLS for each condo development. The third column shows the percentage that these listings represent over the total number of condo units in each development. The cells highlighted in green reveal those condo developments that have active listings that that represent less than 10 percent of the overall units in the building. This is typically one indication of a sound condo building. When I first started doing the Brickell Condo Index in 2007 many of the cells in this column were highlighted in red, indicating that active listings represented over 20 percent of the building. This was always a good indication that prices would fall further in these buildings. For example, in February 2009, active listings at Solaris at Brickell represented slightly over 20 percent of the building. That was the largest percentage of listings at that time and it is not a coincidence that eighteen months later prices fell the most at Solaris at Brickell of all the buildings represented in the Brickell Condo Index.
The fourth column reveals the number of condos currently pending sale in each building. The Club at Brickell Bay has a whopping 42 pending sales at this time and there are a total of 155 pending sales in all of the buildings combined. In February 2009, there were only 81 pending sales although a total of twenty buildings are now present in the Brickell Condo Index rather than eighteen. The fifth column displays the number of closed sales from February 1, 2010 to July 31, 2010. Once again, The Club at Brickell Bay leads the way with a total of 38 closed sales in that time period. It’s interesting to note that there were 20 more closed sales in the six months prior to February 2009 when compared to the current closing numbers even though the index now has two additional buildings.
The sixth column shows the difference in the average list prices from this month’s and February 2009’s, expressed as a percentage. Those highlighted in red reveal those condo developments which had a drop in their average list price while those highlighted in green show those that experienced an increase.
The seventh column reveals the difference in average sales prices from this month’s and February 2009’s, expressed a percentage. Once again, those highlighted in green represent an increase while those highlighted in red represent a decrease.
Well, that’s all for today. Have fun with the numbers. Time for me to get back to work on the new website.
Recently Listed Condo REOs in Miami – August 2009
Earlier this evening, I did a search for condo foreclosures in Miami for a client. 9 condos recently listed caught my attention.
Santa Maria #2506 – 2 bedroom/2.5 bath (2,100 square feet of interior) – Asking $899,900, or $429 per square foot – 24 days on the market
Jade Brickell #1201 – 2 bedroom/2.5 bath (1,878 square feet of interior) – Asking $667,900, or $356 per square foot – less than 2 hours on the market
Carbonell #1805 – 2 bedroom/2.5 bath (1,505 square feet of interior) – Asking $525,000, or $349 per square foot – 8 days on the market
Four Seasons Hotel #3203 – 1 bedroom/1.5 bath (983 square feet of interior) – Asking $460,000, or $468 per square foot – 7 days on the market
Emerald at Brickell #1101 – 2 bedroom/2.5 bath (1,594 square feet of interior) – Asking $364,900, or $229 per square foot – 3 days on the market
Blue Condo #1701 – 2 bedroom/2.5 bath (1,449 square feet of interior) – Asking $208,395, or $144 per square foot – 7 days on the market
50 Biscayne #4705 – 1 bedroom/1 bath (845 square feet of interior) – Asking $179,900, or $213 per square foot – 3 days on the market
The Club at Brickell Bay #4304 – 1 bedroom/1 bath (825 square feet of interior) – Asking $119,900, or $145 per square foot – 8 days on the market
1800 Biscayne Plaza #1203 – 2 bedroom/2 bath (1,040 square feet of interior) – Asking $117,590, or $113 per square foot – 8 days on the market
Brickell Condo Index – February 2009
A lot has changed since I last published the Brickell Condo Index three months ago. Condo foreclosures have continued to hit the market, financing has become extremely difficult to obtain and a few bulk condo deals have closed in that time. As a result, it should come as to no surprise that overall condo prices have continued to drop throughout Brickell within the past 3 months. The data used to compile the statistics below was collected on February 18, 2008 from the MLS. You may want to compare the following figures to those published three months ago in November 2008. Also, be sure to view the charts towards the bottom of this post to see how much Brickell condo prices have changed within the past 15 months.
The average asking prices of the 18 condo developments that comprise the Brickell Condo Index is currently $401.30 per square foot. This represents a 6.57 percent drop in average list prices over the past three months.
Average price per square foot of Brickell condos currently listed on the MLS:
The average price of Brickell condos sold over the past six months has gone up 1.51 percent to $296.00 per square foot from November’s average of $291.59. However, this is due to the fact that Four Seasons Residences had been excluded from the average in November due to no closings occurring within the previous six months. Four Seasons Residences has been reincluded in this month’s index as a result of a condo closing in December 2008. The average for Brickell condos sold over the past six months would have dropped 3.58 percent had it not been re-included. With the exception of Bristol Tower, average sales prices for each of the other Brickell condo developments dropped since the November update.
Average price per square foot of Brickell condos sold in the MLS within the past six months:
Atlantis – 2025 Brickell Ave | 33129 | $228.95
Brickell on the River – 31 SE 5 St | 33131 | $234.18
Solaris at Brickell – 186 SE 12 Ter | 33131 | $201.59
The Club at Brickell Bay – 1200 Brickell Bay Dr | 33131 | $188.28
The Mark on Brickell – 1155 Brickell Bay Dr | 33131 | $228.61
The Palace – 1541 Brickell Ave | 33129 | N/A
Villa Regina – 1581 Brickell Ave | 33129 | $256.71
Vue at Brickell – 1250 S Miami Ave | 33131 | $147.18
Below you will find some additional statistics. Click on the image to enlarge it.
The first column to the right of each condo development’s name is the difference in the average sales price and list price for this month, expressed as a percentage. An “N/A” is found next to Latitude on the River and The Palace since this percentage could not be computed as each building failed to have a closed sale within the past six months through the MLS. A high percentage indicates that there is a large discrepancy between the average asking price for condos currently on the market and what has actually sold within the past six months.
The second column is the number of active listings in each condo development currently in the MLS. The third column shows the percentage that these listings represent over the total number of condo units in each development. The cells highlighted in green reveal those condo developments that have active listings that represent less than 10 percent of the the overall units in the building. This is typically one indication of a sound condo building. Bristol Tower, Four Seasons Residences, Imperial at Brickell, Latitude on the River, The Palace and Villa Regina are the condo buildings highlighted in green. However, I think it’s too soon to use this rule of thumb for Latitude on the River. It’s too new of a development. Short-sales and foreclosures have just started to hit the market there. The ones highlighted in red reveal those condo developments that have active listings that represent over 20 percent of the overall units. There’s definitely underlying risk in buying in these condo developments and I’d only advise buying in one of these if the price justifies the risk. As in the November update, Solaris at Brickell is the only condo developments highlighted in red. This is usually a good indication that prices will fall further in future months.
The fourth column shows the number of condos currently pending sale. There are currently a total of 81 pending sales in the 18 condo buildings represented in the Brickell Condo Index. I did not include pending sales that went pending before November 1, 2008. The fifth column displays the number of closed condo sales within the past six months. The 18 Brickell condo developments have had a total of 198 condos close within that time frame. The vast majority of these closings occurred in just a handful of the condo developments. Latitude on the River and The Palace were the only two condo buildings that haven’t had a condo close within the past six months.
The sixth column shows the difference in the average list prices from this month’s and November’s, expressed as a percentage. Those highlighted in red reveal those condo developments which had a drop in their average list price while those highlighted in green show those that showed an increase. Bristol Tower was the only condo development that had an increase in asking prices since November. In just three month’s time, average asking prices fell about 15 percent at Imperial at Brickell and Solaris at Brickell, 14 percent at Vue at Brickell and 10 percent at Brickell on the River.
The seventh column reveals the difference in average sales prices from this month’s and November’s, expressed as a percentage. The Mark on Brickell saw the largest drop with a 20.95 percent decline. Brickell on the River, Emerald at Brickell, Imperial at Brickell and One Miami also had double digits drops. Average sales prices at Santa Maria increased about 14 percent but it should be noted that only one closed sale occurred within the past six months.
I thought it would be interesting to see how prices compare now to those we saw a year ago. Unfortunately, I didn’t publish a Brickell Condo Index 12 months ago. However, I used data from the November 2007 Brickell Condo Index to create the charts below to compare current prices to those we saw 15 months ago. Click on the images below to enlarge them.
(Below) Percentage Change in Average $/SqFt of List Prices Within 15 Months:
(Below) Percentage Change in Average $/SqFt of Sales Prices Within the Last 15 Months:
Keep in mind that condo prices in Miami peaked around the beginning of 2006. The graphs above would be all the more shocking if we were to cross compare current prices to those we saw at that time. By November 2007, Miami condo prices had already fallen significantly.
One positive thing to note is that the number of condos on the market in the condo buildings comprised in the Brickell Condo Index is down about 26 percent since November 2007. (This excludes Latitude on the River which had not been included in the Brickell Condo Index at that time.) Emerald at Brickell and Santa Maria are the only condo developments in the Brickell Condo Index that now have more condos listed than in November 2007. To put this into perspective, the number of listed condos at Vue at Brickell 15 months ago represented a little over 24 percent of the total condos in the building. Current inventory at Vue at Brickell represents slightly more than 13 percent.
Top 5 Miami Distressed Condo Sales in December 2008
Sorry for the long hiatus. I’m back from my long vacation and ready to get back to work. Below, you will find what I believe to be the five best condo deals of the 36 distressed sales that closed in the month of December in the MLS located in Brickell, Brickell Key, Downtown Miami and the Arts District.
Four Seasons Residences – unit 3305 – 1 bedroom/1 bath (611 square feet) – This unit sold for $285,000, or $466 per square foot, on December 3, 2008. Foreclosure
Carbonell – unit 701 – 1 bedroom/1.5 bath (1,031 square feet) – This unit sold for $215,000, or $209 per square foot, on December 19, 2008. Foreclosure
Three Tequesta Point – unit 1605 – 2 bedroom/2 bath (1,694 square feet) – This unit sold for $465,000, or $275 per square foot, on December 3, 2008. Foreclosure
Blue Condominium – unit 2310 – 2 bedroom/2 bath (1,174 square feet) – This unit sold for $330,000, or $281 per square foot, on December 1, 2008. Foreclosure
Cite on the Bay – unit 3502 – 3 bedroom/2 bath (1,398 square feet) – This unit sold for $230,000, or $165 per square foot, on December 10, 2008. Short-sale
Miami Condo Index – Brickell – November 2008
It’s been three months since I last released the Brickell Condo Index. The last update for Brickell condos was published in August 2008. The data used to create the statistics below was collected on November 18, 2008 from the MLS. You may want to also compare the statistics below to those published a year ago in November 2007. It really helps to put into perspective how inflated prices were a year ago in some of the condo developments in Brickell.
The Brickell Condo Index now stands at an average price of $429.52 per square foot. This represents a 2.28 percent drop in the average asking prices of the 18 condo developments that comprise the Brickell Condo Index over the past three months.
Average price per square foot of Brickell condos currently listed on the MLS:
The average price of Brickell condos sold over the past six months has dropped 7.13 percent to $291.59 per square foot from August’s average of $313.97. As with the last update, the average would normally be higher had a sale occurred in the MLS within the past six months at Four Seasons Residences, which sells at the highest price per square foot of the 18 condo developments comprising the Brickell Condo Index.
Average price per square foot of Brickell condos sold in the MLS within the past six months:
Atlantis – 2025 Brickell Ave | 33129 | $250.71
Brickell on the River – 31 SE 5 St | 33131 | $264.63
Solaris at Brickell – 186 SE 12 Ter | 33131 | $200.00
The Club at Brickell Bay – 1200 Brickell Bay Dr | 33131 | $201.44
The Mark on Brickell – 1155 Brickell Bay Dr | 33131 | $289.18
The Palace – 1541 Brickell Ave | 33129 | $260.14
Villa Regina – 1581 Brickell Ave | 33129 | $249.88
Vue at Brickell – 1250 S Miami Ave | 33131 | $158.55
Below you will find some additional statistics:
The first column to the right of each condo development’s name is the difference in the average sales price and list price for this month, expressed as a percentage. An “N/A” is found next to Four Seasons Residences and Latitude on the River since this percentage could not be computed as each building failed to have a closed sale within the past six months through the MLS. A high percentage indicates that there is a large discrepancy between the average asking price for condos currently on the market and what has actually sold within the past six months.
The second column is the number of active listings in each condo development currently in the MLS. The third column shows the percentage that these listings represent over the total number of condo units in each development. The cells highlighted in green reveal those condo developments that have active listings that represent less than 10 percent of the the overall units in the building. To me, this is one indication of a sound condo development. Atlantis, Bristol Tower, Four Seasons Residences, Imperial at Brickell, The Palace and Villa Regina are the condo buildings highlighted in green. The ones highlighted in red reveal those condo developments that have active listings that represent over 20 percent of the overall units in the building. There’s definitely underlying risk in buying in these condo developments and I’d only advise buying in one of these if the price justifies the risk. This month, Solaris at Brickell is the only condo developments highlighted in red. This is usually a good indication that prices will fall further in future months. The condo developments with active listings less than 10 percent are considered safe, in my opinion, and anything in the 10-15 percent range is considered normal, even in a healthy market.
The fourth column shows the number of pending sales while the fifth column displays the number of closed sales within the past six months. There are a total of 94 total pending sales in the 18 condo buildings represented in the Brickell Condo Index. In August, there were a total of 79 pending sales at the time. Once again, The Club at Brickell Bay, Vue at Brickell and Jade each have pending sales in the double digits. The same goes for closed sales within the past six months in each of these condo developments. Skyline on Brickell also hit the double digit mark with a totla of 13 closed sales in the MLS within the past six months. In August, there were a total of 123 closed sales within the past six months. This figure has gone up almost 32 percent since the August update. The 18 Brickell condo developments had a total of 164 closed sales within the past six months.The vast majority of these closings occurred in just a handful of the condo developments, however. 8 of the condo developments had three or less closings within the past six months.
The sixth column shows the difference in the average list prices from this month’s and August’s, expressed as a percentage. Those highlighted in red reveal those condo developments which had a drop in their average list price while those highlighted in green show those that had an increase. Emerald at Brickell saw asking prices drop a little over 10.5 percent while Solaris at Brickell shed about 9.8 percent from its average asking price in August. An increase in average asking prices occurred in 8 of the condo developments in the Brickell Condo Index.
The seventh column reveals the difference in average sales prices from this month’s and August’s, expressed as a percentage. Vue at Brickell saw the largest drop with a 15.94 percent decline. Jade, Neo Vertika, The Club at Brickell Bay and Villa Regina also had double digits drops. It should be noted that Villa Regina only had one closed sale within the past six months to calculate its new average. Atlantis, Santa Maria, Skyline on Brickell and The Palace each experienced an increase in their average sales prices for the previous six months.
Vue at Brickell is very, very close to hitting the $150 average per square foot mark for closed sales over the previous six months. In August, the condos available on the market at Vue at Brickell represented about 28 percent of the overall units in the building. This figure now resides at around 17 percent. It will be interesting to see how much lower the average price per square foot of condos sold at Vue at Brickell will go if inventory levels continue to improve. As I mentioned earlier, the 10-15 percent range is normal even in a healthy market. Perhaps some sort of stability is right around the corner for Vue at Brickell. The same can be said for Jade and The Club at Brickell which have also continued to show progress in reaching normal inventory levels.
Miami Condo Index – Brickell – August 2008
It has been four months since the last installment of the Miami Condo Index for Brickell. The last update for Brickell condos was provided in April 2008. The data below was collected on August 18, 2008 from the MLS. While crunching the numbers earlier today, it quickly became apparent that prices have continued to fall within the past four months and, in some cases, prices have fallen hard.
The Brickell Condo Index now stands at an average price per square foot of $441.84. This represents a 7.71 percent drop in the average asking prices of the 18 condo developments that comprise the Brickell Condo Index over the past four months, or an annualized loss of 23.13 percent. You’ll see in the graph towards the bottom of the post that about four condo developments have had significant reductions in their average asking prices within the past four months.
Average price per square foot of Brickell condos currently listed on the MLS:
The average price of Brickell condos sold over the past six months has dropped 23.49 percent to $313.97 per square foot from April’s average of $410.38. However, much of this drop is attributed to the fact that Four Seasons Residences, which sells at the highest price per square foot of the 18 condo developments comprising the Brickell Condo Index, has not had one closed sale in the MLS within the past six months and therefore was not included in this month’s average. The average would have dropped around 14.37 percent had Four Seasons Residences been included using its April average. That would still have represented an annualized drop in the average sales prices of about 43 percent!!!
Average price per square foot of Brickell condos sold in the MLS within the past six months:
The Club at Brickell Bay – 1200 Brickell Bay Dr | 33131 | $224.18
The Mark on Brickell – 1155 Brickell Bay Dr | 33131 | $311.29
The Palace – 1541 Brickell Ave | 33129 | $240.85
Villa Regina – 1581 Brickell Ave | 33129 | $292.44
Vue at Brickell – 1250 S Miami Ave | 33131 | $188.62
Below you will find some additional statistics:
As in the past, the first column to the right of each condo development’s name is the difference in the average sales price and list price for this month, expressed as a percentage. An “N/A” is found next to Brickell on the River, Four Seasons Residences and Solaris at Brickell since this percentage could not be computed as each building failed to have a closed sale within the past six months through the MLS, and thus did not have an average price per square foot for condos sold. A high percentage indicates that there is a large discrepancy between the average asking price for condos currently on the market and what has actually sold within the past six months.
The second column is the number of active listings in each condo development currently in the MLS. The third column shows the percentage that these listings represent over the total number of condo units in each development. The cells highlighted in green reveal those condo developments that have active listings that represent less than 10 percent of the the overall units in the building. To me, this is one indication of a sound condo development. Bristol Tower, Four Seasons Residences, Imperial at Brickell, Santa Maria, The Palace and Villa Regina are the condo buildings highlighted in green. All, with the exception of Four Seasons Residences, were built prior to 2000 and none were targets for wild speculation during the last real estate boom. The ones highlighted in red reveal those condo developments that have active listings that represent over 20 percent of the overall units in the building. There’s definitely underlying risk in buying in these condo developments and I’d only advise buying in one of these if the price justifies the risk. Jade, Solaris at Brickell and Vue at Brickell are the condo developments highlighted in red. Each was built in 2004 or after and victimized by speculation and rampant mortgage fraud. Prices in each have fallen like a ton of bricks within the past year. The condo developments with active listings less than 10 percent are considered safe, in my opinion, and anything in the 10-15 percent range is considered normal, even in a healthy market.
The fourth column shows the number of pending sales while the fifth column displays the number of closed sales within the past six months. There are a total of 79 total pending sales in the 18 condo buildings represented in the Brickell Condo Index. In April, there were a total of 58 pending sales at the time. The Club at Brickell Bay, Vue at Brickell and Jade each have pending sales in the double digits. The same goes for closed sales within the past six months in each of these condo developments. In April, there were a total of 64 closed sales within the past six months. This figure has almost doubled since April with a total of 123 closed sales within the past six months. With 25 closed sales within the past six months and 25 pending sales in the pipeline at The Club at Brickell, I question myself whether some sort of stability is finally being reached. Again, the 25 closed sales had an average price of around $224 per square foot. If the answer to my questions is no, then where will the dust finally settle? Of the three condo developments, The Club at Brickell Bay was the only one which has had a reduction in its active listings since April. That, to me, is progress. From November 2007 until April 2008, average sales prices at The Club at Brickell Bay fell about 46 percent. Now since April, we have seen another large drop of about 39 percent in its average sales price. By year’s end, can prices at The Club at Brickell Bay hit the $150 per square foot mark that many of the commentors on this blog have mentioned? A 30 percent drop in sales prices will bring us very, very close to that oft-mentioned number. A better question is, will the pundits of this blog revise their guidance downward if that figure does become an eventuality in a few condo developments in Brickell?
The sixth column shows the difference in the average list prices from this month’s and April’s, expressed as a percentage. Those highlighted in red reveal those condo developments which had a drop in their average list price while those highlighted in green show those that had an increase. Emerald at Brickell saw asking prices drop a little over 23 percent, Vue at Brickell slightly under 23 percent, Solaris at Brickell around 20 percent, The Club at Brickell Bay about 17.5 percent, Neo Vertika 11.4 percent and Jade 11.25 percent. Only Santa Maria and The Palace experienced average list prices actually rise.
The seventh column reveals the difference in average sales prices from this month’s and April’s, expressed as a percentage. Emerald at Brickell saw the largest drop with a 41.21 percent decline, although only one closed sale was found in the MLS within the past six months to calculate its new average. It has a difference of around 46 percent in its average sales and asking prices. This is the largest pricing discrepancy amongst the 18 condo developments represented in the Brickell Condo Index. This just shows me that asking prices at Emerald at Brickell still have a ways to come down before reaching its market clearing value. The Club at Brickell Bay had its average sales price drop around 39 percent, Skyline on Brickell around 25.5 percent, The Palace about 25 percent and Villa Regina around 25 percent. Only Latitude on the River and Santa Maria experienced an uptick in average sales prices since the last Brickell Condo Index update.
This the first month where we saw average sales prices for a Brickell condo building fall below $200 per square foot. Vue at Brickell is now sitting on an average sales price of around $189 per square foot, calculated from the 17 closed sales in the MLS that it has had within the past six months. A look at the listings currently available at Vue at Brickell indicates that prices will continue to fall, as over 30 listings have an asking price below the $189 per square foot average. In fact, four listings are currently asking less than $150 per square foot. It goes without saying that Vue at Brickell will likely hit the $150 average sales mark before any of the other condo developments in the Brickell Condo Index.
Another insight I made while pondering the figures for this month’s Brickell Condo Index is that Santa Maria is alive and kicking. It looks healthy despite the slow down in the real estate market. Its average listing and sales prices have both gone up within the past four months. It has also had 8 closed sales within the past six months. That may not seem like a lot but, with only 174 total condos, Santa Maria is not a huge mega-building with 500-plus units like we often see nowadays. It also has the most realistic asking prices. The discrepancy in asking and sales prices is 15.81 percent, the lowest amongst the 18 condo developments. Couple all that with the fact that the currently available listings at Santa Maria only represent around 8 percent of its possible inventory and I’m saying that it’s good to see that there’s still one stand-up condo development amongst the 18.