Market Stat Monday: How Is The Rental Market At Brickell Heights?
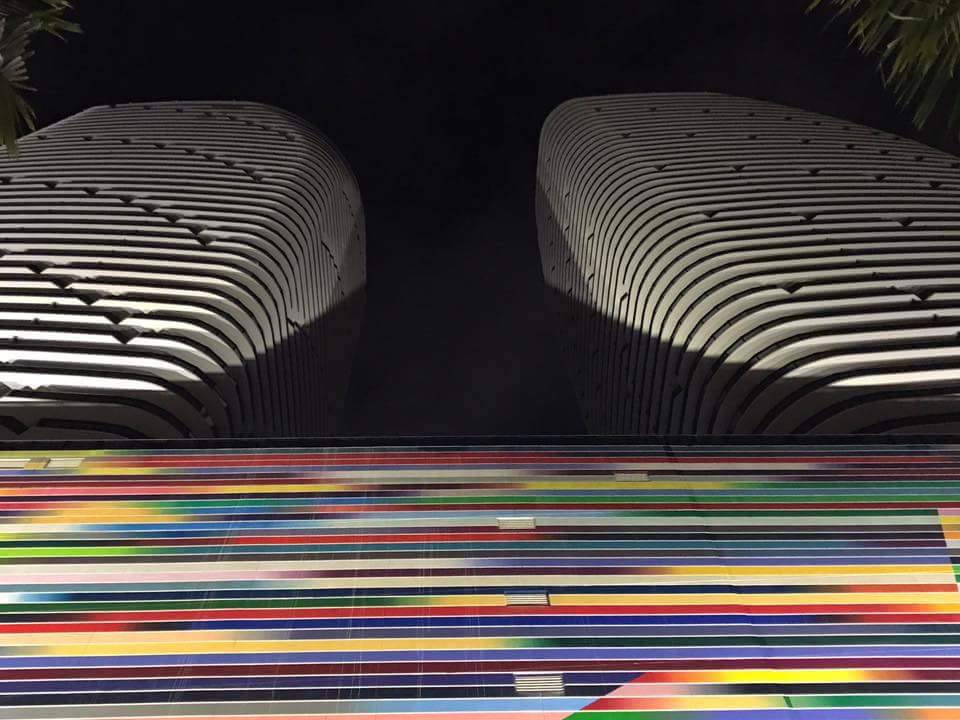
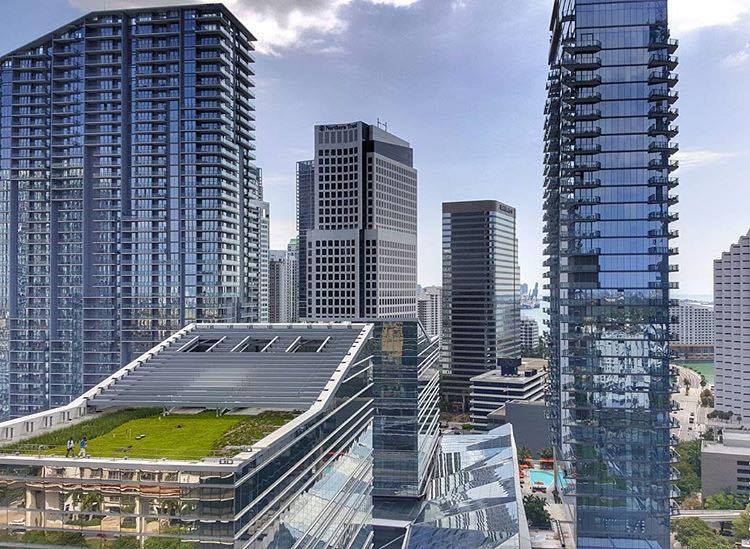
It has now been almost 3 months since this photo was taken, just as Brickell Heights was preparing to open. The closings have gone down at a harried pace, Equinox is open and buzzing with activity and moving trucks are filling the loading docks daily. The project was a resounding success for The Related Group, and it is too soon to tell how the resale market will fare, but we have had enough time and activity to check the pulse of the rental market.
Brickell Heights East
Between the active/available rental options, the ones whose tenants have already moved in and the ones whose tenants are awaiting association approval, it appears that 99 of the tower’s 358 units are operating as rentals. That amounts to 28% of the building as of today, not bad! I’ve come to expect to see an investor ratio of 60%-75% in most of the Brickell condo towers, after seeing the condo questionnaires that banks use to determine financing availability.
In the last 3 months, 26 landlords have moved their tenants in and have accepted $2.73 per square foot on average. One bedrooms range from $2,000 per month up to $2,750 per month, and two bedrooms are renting for $3,000 per month up to $3,900 per month. Nine units are currently pending, but I expect to see the final pricing stay in line with the previous numbers.
With 64 active/available listings, it looks like we’re operating with right about 2 months of inventory (great news!). The pricing of the available options is also more or less in line with the rented units. One bedrooms are available for between $2,000 per month up to $3,000 per month, two bedrooms range from $2,700 to $3,700 per month and three bedrooms are between $5,500 to $5,950 per month (there are only two of these currently available).
Just as we have seen in past buildings, the landlords are not budging much on their pricing. The ones who already rented their units did so for an average of 97% of their asking price.
Brickell Heights West
Originally slated to be a rental-only tower that turned back into a condo tower when the pre-construction market took off, the West tower is still shaping up to be mainly rentals. There are currently 90 available units for lease, ranging in price from $1,950-$3,000 for one bedrooms, $2,800-$4,500 for two bedrooms and $4,950-$5,250 for three bedrooms.
Aside from those 90 available listings, 16 have rented and 26 more are awaiting association approval. With that many pending leases, I imagine there is quite a bit of backlog in the management office. For the next couple of months, it is probably a good idea to lease here only if you have a flexible move-in date or 3+weeks to wait for approval. Otherwise, you could find yourself in a hotel while you wait for approval.
The 16 units that did rent garnered 96% of their asking price and range from $1,950-$2,200 per month for one bedrooms and $2,700-$3,250/month for two bedrooms. The tenants are paying $2.66/square foot on average.
Looking Ahead
It will be interesting to see what happens over the next few months at Brickell Heights with the new competition from Solitaire and Panorama Tower, both of which are slated to open soon. Do you think the prices will dip a bit during the wave of inventory of the first lease-up and then level off at a higher value due to continued demand and less inventory like SLS Brickell, or do you think Panorama Tower and Solitaire’s wave of inventory will hold the prices lower?
Market Stat Monday: The Bond On Brickell


This week, we are going to take an in-depth look at another recently-opened development, Rilea Group’s Bond On Brickell. Around the same time last year, we were treated to a sneak peek just days before the project began closings, and it has come a long way since!
After digging into the numbers, I’m really starting to see some solid trends among these new buildings. The developer made off flush, closing on all but a handful of the units for an average of $587/square foot, or $183 million as reported by The Real Deal. Nearly 80% (77% to be exact) of the pre-construction buyers are now either trying to sell or lease their properties, and nobody has claimed their homestead exemption.
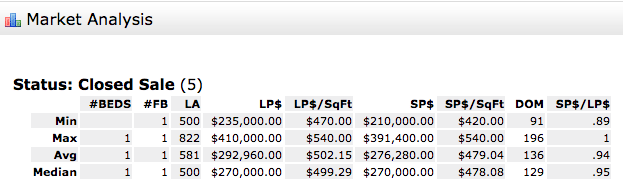
RESALES
Looking at the resale market, the outlook is pretty grim (but don’t get worked up, the rental market is better, just scroll down if you’re looking for rosy news). There are currently 68 active listings for sale, and only 2 have sold on the resale market so far. The MLS shows 6 total sales, but 4 of them were developer sales. If you figure the months of inventory based upon all closed sales combined, there are 91 months of inventory. If you only consider the true resales, that number jumps to 272 months of inventory! Either way you figure it, that is far more inventory than we’ve seen so far.
Of the apartments that did sell, again we are seeing that the sellers are not budging far in their negotiations. The developer sold their 4 listed apartments at an average discount of 4% and garnered $595/square foot. Open-market resales received 94% of their listing price with an average of $499/square foot. Although both investors garnered far less for their units than the developer, that’s not to say they both lost money.
Apartment 2508
– Originally purchased in September 2016 for $742,900. If you figure a 1.5% developer fee, that nets a $754,000 buy-in.
– The property resold in April 2017 for$620,000. If you figure the seller paid the standard 6% commission, they netted $582,800 in the sale.
– The overall investment lost the investor $171,200 (unless there are hidden factors that we can’t pull from the MLS and tax roll).
Apartment 2101
– Originally purchased in August of 2016 for $527,900, netting $535,800 after assuming the 1.5% developer fee.
– The property sold in May of 2017 for $595,000. Assuming the 6% commission, the net sale was $559,300.
– This transaction left the investor a $23,500 gain, or a little more than 4%.
Final Thoughts
Am I saying that purchasing in The Bond on Brickell is a bad idea? Absolutely not. The building turned out very nicely, with high quality finishes and thoughtfully chosen amenities. Rilea Group was also smart to purchase the air rights over the small office building next door. I see it as SLS Brickell’s not-so-garish cousin. If that is your taste, then it is a great time to get a great deal and a lovely home for years to come, just don’t buy in thinking you can flip the property for a hefty profit, because you will be disappointed.
The current price ranges are:
Studios – $268,000-$389,000
1 Bedroom – $359,000-$680,000
2 Bedroom – $667,000-$850,000
3 Bedroom – $1,050,000-$1,650,000
RENTALS
Now it is time for the good news. The rental market is very stable, with only 20 active listings currently. The building has been leasing up at an average of 18 units per month (142 for the year so far), leaving just over 1 month of inventory for tenants to choose from.
Despite the low inventory today, the average days on market is listed as 64 days. It is common to see new buildings offer a glut of inventory shortly after the investors close on their units. Everyone wants to find a tenant and fast. The lease prices drop for awhile until the majority of that inventory is absorbed and then the prices and days on market stabilize.
This trend is evident in the rental history of The Bond over the last year. Studios have leased for as little as $1,350/month during times of high inventory, but now command between $1,900-$2,350/month. One bedrooms have been as low as $1,800/month, but now are leasing between $2,300-$3,250. Two bedrooms were as low as $2,400/month but now are $3,300-$4,500. Three bedrooms were once $4,200/month, but the only one available today is $6,500.
This is not the time for opportunistic tenants to try and over-negotiate lease prices. There is very little on the market and the landlords are only negotiating to 94% of their asking price… not a huge drop.
So, while the resale market is pretty bleak, the landlords and owner/occupants in The Bond are poised for success!
Nearly 80% Of Buyers At Reach Purchased As Investment
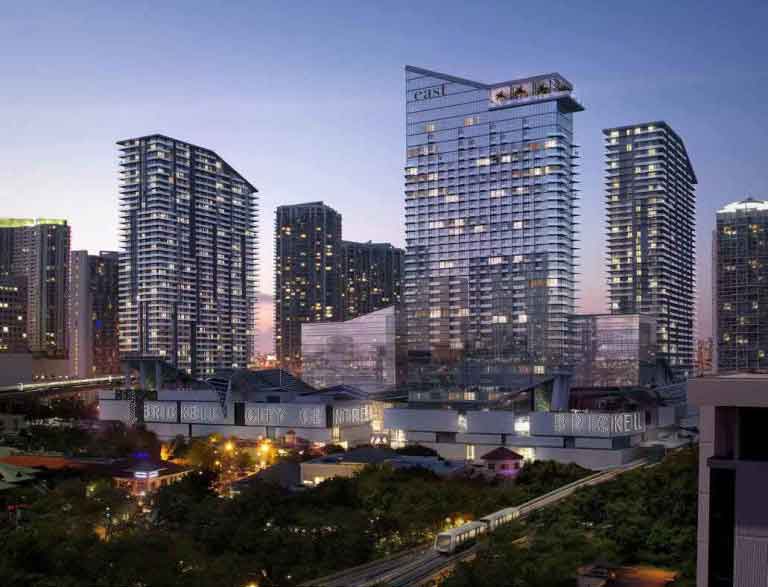
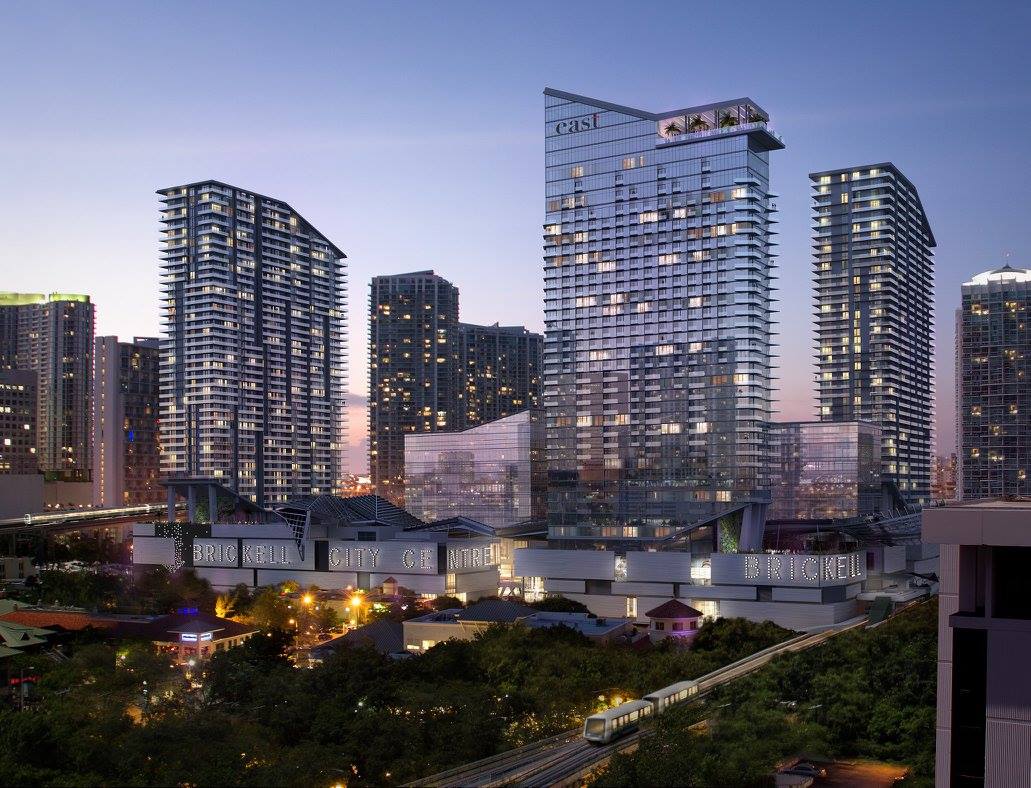
One year ago, we noticed a shocking yet not unexpected trend at Brickell City Centre’s Reach Tower. At that point, 277 of the building’s 390 residences had closed, and 30% of those had already come back to the market as rentals. We knew that a significant number of buyers had purchased as rental investments, but had not seen the exact figures. It was intriguing, and we have followed the numbers as the building continues to fill up.
And here we are. A year has passed and according to the tax rolls, 351 units have closed. Of those, 34 have come back to the market as resales, 191 as rentals, and 55 owners put their units up for sale and for lease. That leaves only 71 units to be used by the owners. According to the tax rolls, none of the owners had filed for the Homestead Exemption, so it appears that those 71 owners are part-time residents.
Over the coming days, we are going to be calculating the same figures for other buildings that recently opened. Do you think we will see the same trend throughout the marketplace, or is Brickell City Centre an exception?
Market Stat Monday: How Many Buyers Actually Pay Cash vs Financing?
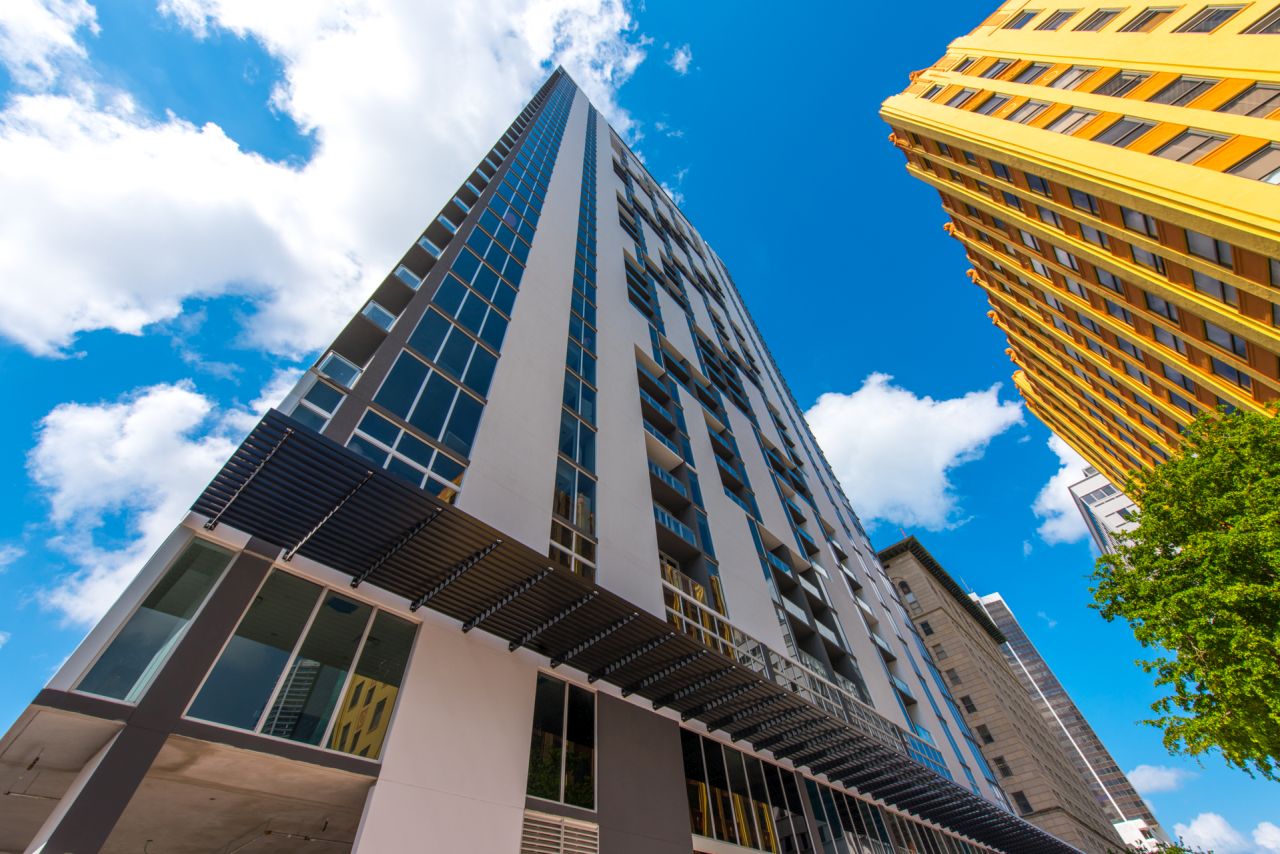
Photo by Lucas Lechuga.
In the not-too-distant past, our real estate market was in a state of financing drought. Even if a buyer was prequalified, the chances of a mortgage making it out of underwriting with a clear to close were slim to none. Listing agents would many times refuse to show their listings to buyers who intended to use financing because the likelihood of the deal going through was so slim. This was during the recovery of the 2008 market crisis, and we have come a long way.
Banks have since loosened their purse strings and relaxed their underwriting guidelines, leaving more opportunity for the mortgaged masses… but how much of our current market do they make up? We took a look at all of the 772 resales that happened during the first half of 2017 in Brickell, Downtown, Midtown and Edgewater and found that financed purchases comprise about half of the transactions and sales volume. Check out this interactive graph that displays our findings.
Aside from the number of transactions and sales volume, we also found that only 14 of the 397 cash transactions were valued at over $1 million, and 23 of the 365 financed transactions were valued over $1 million. Naturally, none of the FHA financed transactions hit the benchmark since these loan limits are capped far below.
Are you surprised by any of these findings? How do you think the trend will continue through the rest of the year and into 2018?
Market Stat Monday: Buyers From Which Country Purchase The Most In Sunny Isles?
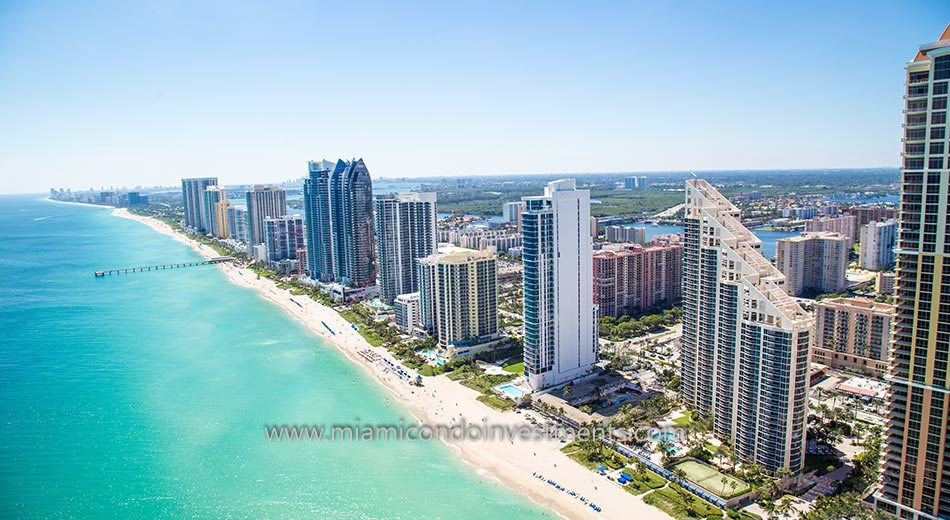
After the interesting findings in our Market Stat Monday report last week showed that Americans purchase more Brickell properties than any other country, I thought it would be interesting to see who the predominant buyers are in Sunny Isles Beach. Of course, everyone assumes that the findings will show that Russians are the most active, the community has been nicknamed “Little Moscow,” after all. But guess what? They’re not.
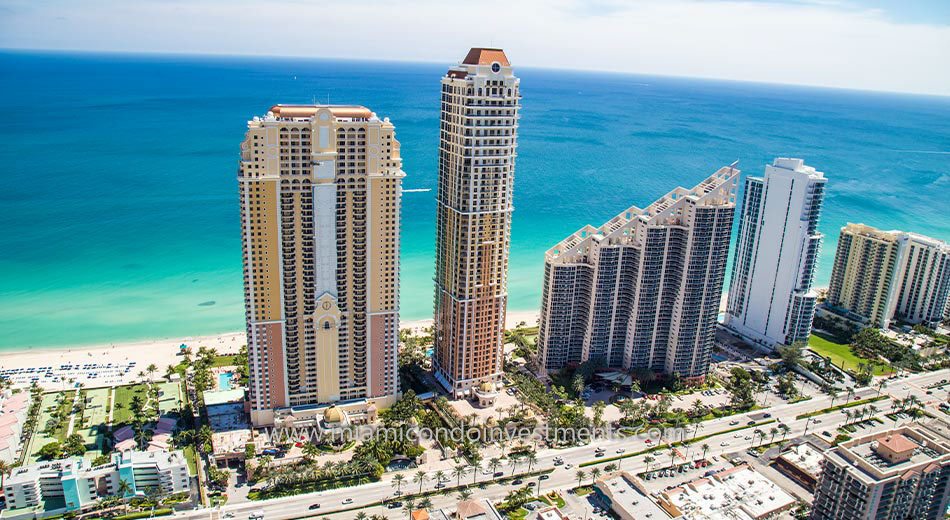
According to the Miami MLS, it was again the Americans who had the highest number of transactions as well as the highest total expenditure. Granted, it was a US buyer who snagged the Upper Penthouse at Porsche Design Tower, but even before that one $25 million sale, the US was way ahead of the other countries.
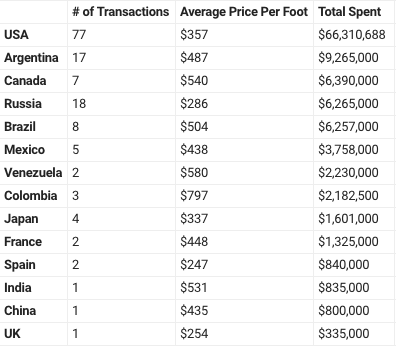
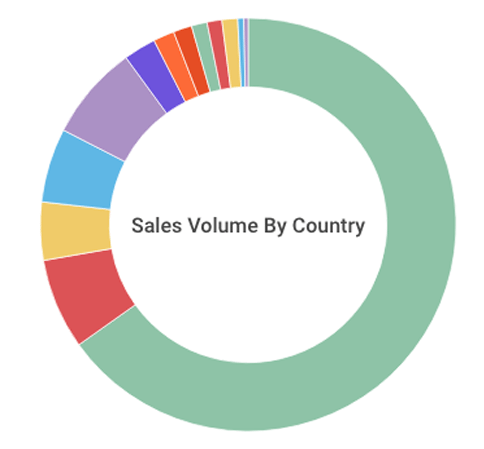
Overall, there were 264 closed sale transactions amounting to a grand total of $220 million in sales. In Sunny Isles, I’m not as interested in the overall price per square foot paid because the market is too polarized. We need to break that figure down into average price per foot of affordable condos in Sunny Isles, mid-range, luxury and super-luxury. In addition to those topics, we should also separate the oceanfront buildings from the intracoastal side buildings, so this is a post of its own. Of the closed sales that occurred, about half of the agents reported the nationality of their buyer. Here is how it breaks down, just scroll over or touch the graph below to see the figures.
Market Stat Monday: Brickell Sales Statistics By Country Of Buyer’s Origin
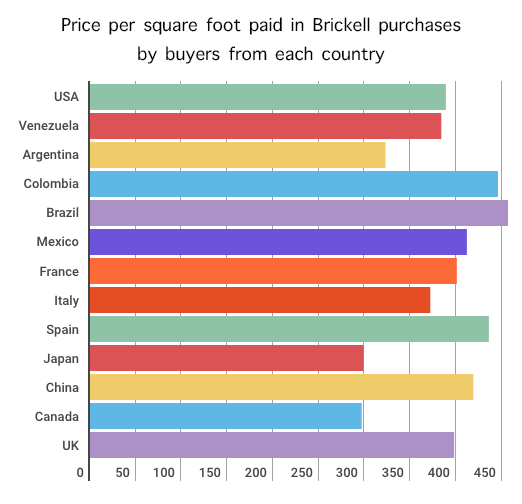
Since this is such a patriotic week and it is no secret that our friends from abroad play a big role in the Brickell real estate market, I thought it would be interesting to see which countries are producing the most buyers of condos. The Miami MLS has a new-ish feature that reports the country of origin for the buyers after they close on a listed condo. We still have to rely upon the word of developers in order to report buyer origins of new condos, but resales can now be statistically found.
Out of the 414 total sales that have happened in Brickell since the beginning of the year, about half of the agents have reported the country of origin of their buyers. This represents just under $100 million of Brickell inventory sold out of the $198 million that was sold in total.
Here are our findings:
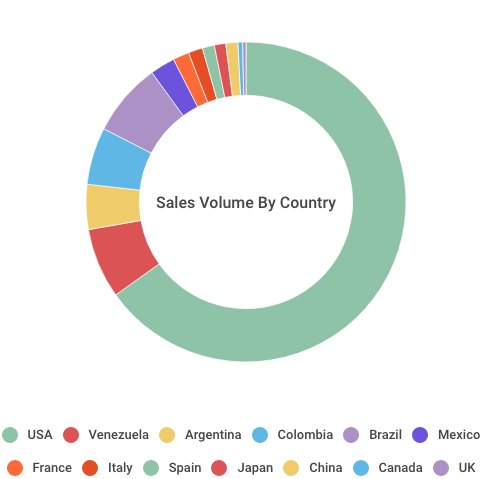
If you look at the total sales volume of all of the sale transactions in the neighborhood during 2017 so far, you can see that the United States is responsible for the overwhelming majority, followed by Brazil, Venezuela, Colombia, and Argentina.
Despite reports of their sales activity in the area, China and Mexico did not spend nearly as much as other countries, and Russia was not even on the list.
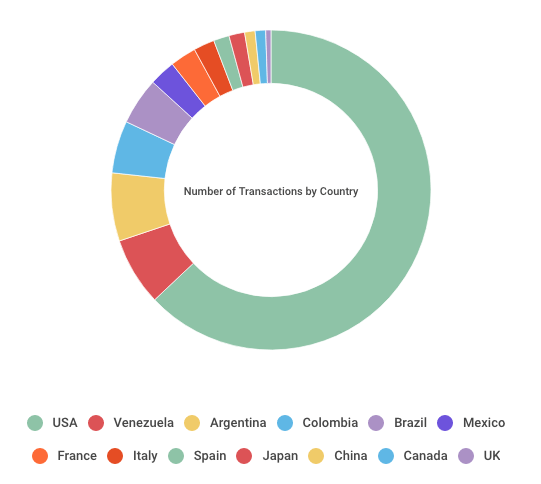
The number of transactions was skewed even farther in the United States’ favor, with Venezuela, Argentina, Colombia and Brazil following behind.
For those who prefer a chart rather than a graph, here are the actual figures for each country.
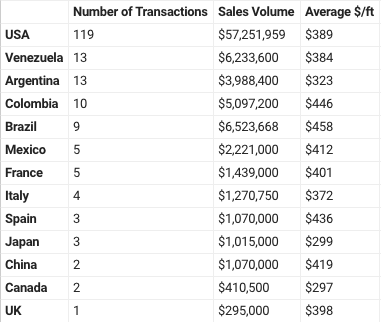
Are you surprised by the findings?
Neo Vertika Market Statistics
Just west of the Metrorail line in Brickell is Neo Vertika. It was built in 2006 and is the only building in the neighborhood that offers industrial-style lofts. I have always been a fan of the building since the units are unique, deals are plentiful and the building is very well-managed. Since the building is well-managed, financing is easier and the terms are more attractive to buyers. So how is the market doing today?
The sales market is holding strong! There are only 18 active listings today, 13 of which are unfurnished non-outlier listings (I took out the penthouses and lower-floor units since they don’t fully compare). The listings are asking $349/square foot on average.
So far this year, 5 listings have closed in the building. This isn’t a huge number, but when you consider the lack of available listings for sale, the metric looks far more healthy than buildings we have seen in weeks past. The units that did find a buyer closed for an average of $318/square foot after negotiating to 96% of asking price.
There are two types of one bedroom units at Neo Vertika. The smaller 638 square foot plan is really a studio, but is often marketed as a one bedroom. The 795 square foot one bedroom is a duplex loft. The studios are available for between $225,000-$245,000, duplex one bedrooms from $269,500-$294,500 and two bedroom duplex plans from $355,000-$450,000.
The rental market is also performing very well at Neo Vertika. With only 24 available options currently, 37 other units have found tenants so far this year. That gives us just under 4 months of inventory. The studios lease between $1,600-$1,700/month, duplex one bedrooms from $1,750-$1,900 and two bedrooms from $2,200-$2,550/month.
Looking at the current inventory, one deal that sticks out to me is apartment 2309, which is listed for $335,000. This is the lowest priced two bedroom option currently on the market and is leased for $2,400/month. A rental investor would earn a 4.7% return on their investment after you paid the taxes and HOA bills as quoted in the listing. That is a great return compared to buildings we have seen previously. The apartment also has a river view and is across the street from KLA, one of the most popular preschools in the area. Not bad!
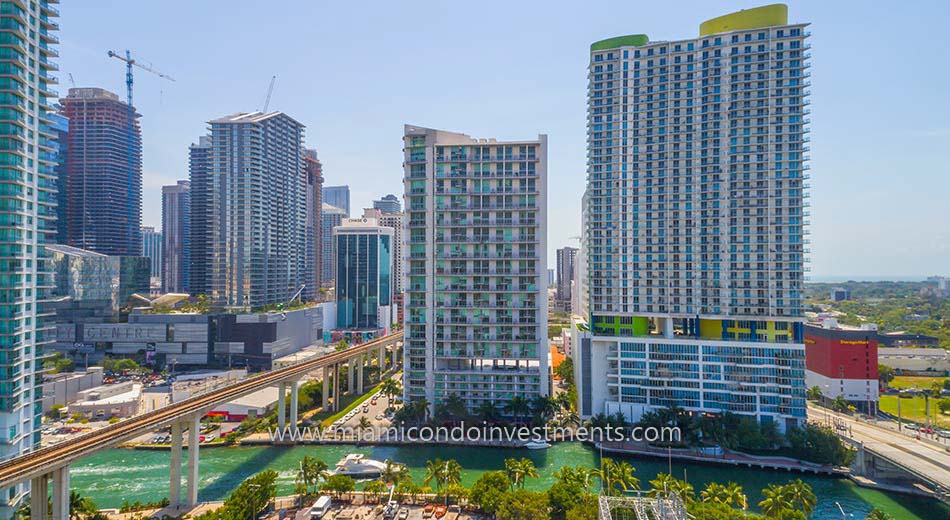
Market Stat Monday: Centro in Downtown Miami
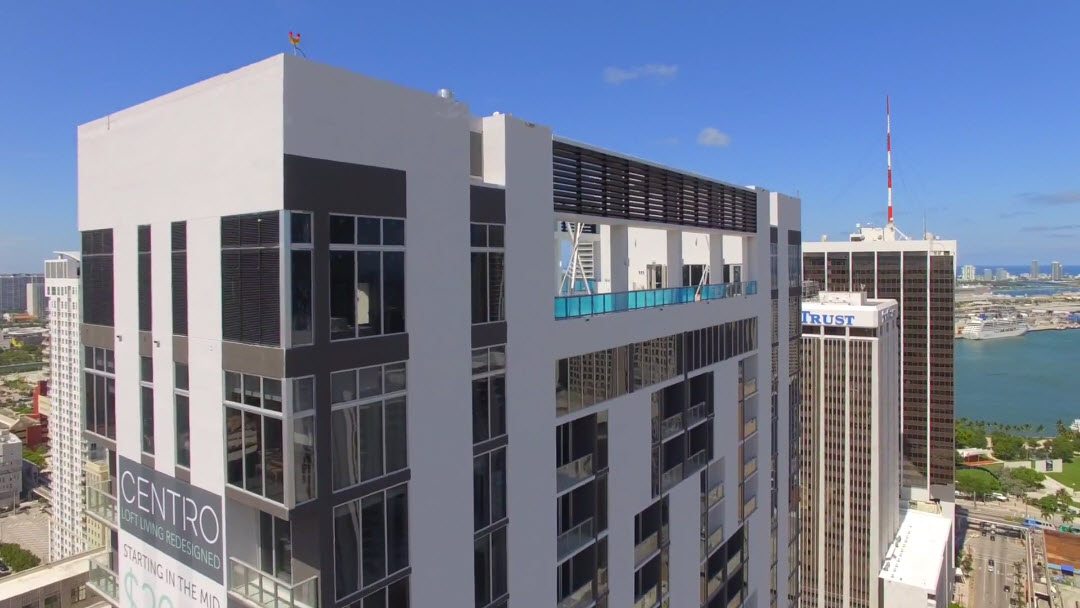
Welcome back to a new week! We’re going to continue our Market Stat Monday series in Downtown Miami’s Centro building. This building made a splash when it was announced because it was the first new tower in the neighborhood to be constructed without parking. It is located in the Central Business District at 151 SE 1st Street, very close to MDC and Bayside Park, so the area is quite walkable.
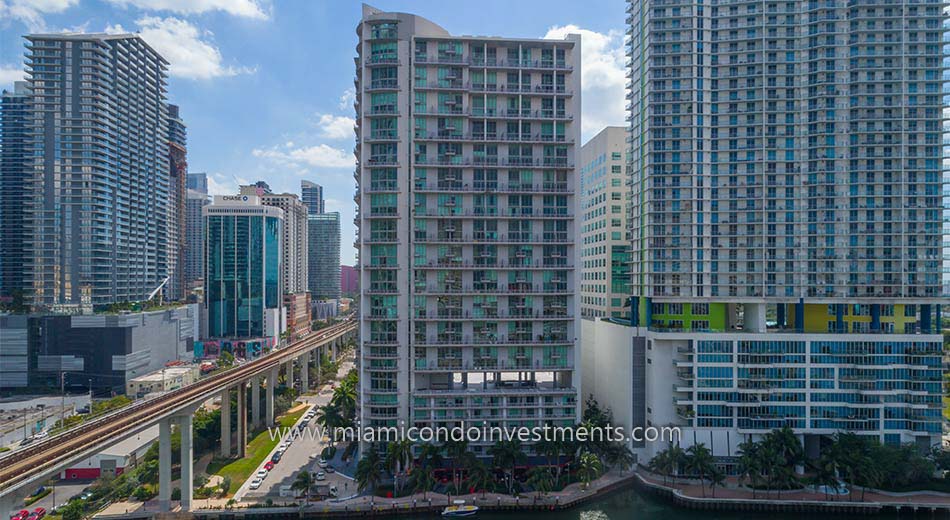
Another interesting quality of Centro is that all 352 units are loft-style. They’re not duplex loft style (two story layouts), but they are New York style lofts in that there are no walls between the living areas and the bedrooms. This can be a positive or a drawback, depending upon your style of living. It is urban, chic and cool, but the lack of privacy could make things difficult for people living in a roommate situation.
Since there is really nothing different about the penthouses at Centro other than the fact that they’re on the highest floor, I am going to factor them into the statistics search today. Furnished units are factored out. Also, since I’m in the mood for good news, I’m going to look first at the rental market.
Centro Rentals
Because of it’s proximity to MDC and the price, this building was really hot for a few months on the rental market. People could move into a brand-new condo for as low as $1,450/month! Those days have come and gone because there’s just not that much inventory right now. There is only one 1 bedroom layout available to rent as of today, and it is $1,920/month.
Overall, there are 10 active unfurnished listings on the market today. As I said above, the one bedroom is listed for $1,920/month with a partial bay view from the 36th floor. Two bedrooms are listed between $2,000-$2,650/month depending upon the view and size. Most all units in Centro have a city view, a few have a partial bay view.
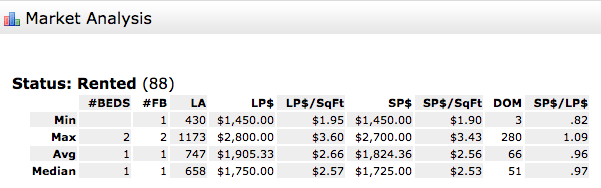
This has been a very active year for Centro. It opened last summer, in 2017 we have seen 88 total unfurnished rentals. The prices ranged from $1,450/month up to $2,800/month and averaged $2.56 per square foot of living space.
The units that found tenants were marketed for an average of 66 days and accepted 96% of their asking price. Something else that sticks out to me in this report is that the lowest-priced rental stayed on the market for just 3 days. There was also a unit that closed for almost 10% above asking price! This demonstrates something that we tell our clients every day. There is a lot of competition for units that are at the entry point of the market (least expensive in the neighborhood). The rentals happen quickly and for very close to asking price, so if you love an apartment then it is best to make a move for it.
With just 10 units currently available and 88 rented so far this year, that works out to less than 1 month of available inventory! Amazing!
Centro Sales
Now it’s time to swallow our bitter pill. There are currently 55 people trying to sell their apartments in Centro, and 2017 has brought a paltry 5 closed sales. That gives us 66 months’ of inventory. Oof.
The active listings are asking $489/square foot on average, and those who did find buyers sold for $479/square foot, accepting 94% of their asking price. The building is one of the few in the area that is Fannie Mae approved, making financing easier, so what’s the problem?
It appears there are just WAY less buyers in the marketplace. Now more than ever, it is imperative that sellers who sincerely want to sell choose an agent that has access to buyers and a way to make the listing shine in a pack of similarly-priced and similarly-finished apartments. You need an agent who will make sure the property is available to be shown when the buyers request, meets them there to roll out the red carpet and give a tour of the building, answering their objections on the spot and increasing the likelihood that your apartment is the one they choose. I apologize for the lecture, but listing agents need to work harder than ever to make closings happen these days. Here’s a look at the scary stats.
I was amazed to see that even with Fannie Mae approval, there were so few transactions in the building. Only one sold at full-ask, and that seller threw in seller financing to make the deal work. They garnered $540/square foot, the highest price for a resale in the building ever.
To be clear, I’m not dogging Centro. It is very well positioned in the market, offering the lifestyle and finishes that residents of the Central Business District want. Hopefully the demand will pick up and these sale listings will start moving again. Until then, just keep them filled with tenants!
Miami Condo Investments’ Most Popular Buildings in Greater Downtown Miami
I thought about doing a TBT post today, but then changed my mind. There is so much going on in today’s real estate market, why talk about the past? New buildings are opening every month, people are curious about how these new buildings compare to the ones that were new in years past. So which buildings are currently the most popular by condo shoppers?
I took a look through our Google Analytics report to see what our readers are looking at the most. In the time period from May 14, 2017-June 14, 2017, MiamiCondoInvestments.com received a total of nearly 73,000 page views. Of those, here are the ten most viewed building pages. This list does not include views of individual listings, just of the building pages themselves, where you can find inventory lists, market statistics and closed sale/rental data.
1 – SLS Brickell – 1,219 views
It makes sense that SLS Brickell would take the number one spot with an overwhelming lead. The project was very much anticipated by future tenants, owners and pool-party-goers alike. Move-ins began in late December/early January and have moved on at a rapid pace, leaving the building almost at full occupancy now, with demand still strong. Our agents alone have handed out 16 sets of keys in the building, with a healthy book of buyers and prospective tenants still shopping.
2 – Reach at Brickell City Centre – 731 views
I would have been surprised if Brickell City Centre didn’t make this list! This project was the catalyst that fueled the buying craze in Brickell over recent years and reinvigorates the neighborhood that was once a dense yet sleepy enclave of beautiful high rises that became quiet at night. Reach was the first residential tower to open in Brickell City Centre, and is also approaching occupancy. When the project initially opened, one bedrooms started at $2,400-$2,450/month, but now have risen to $2,650/month.
3 – Brickell Heights East – 715 views
The newest new building on the block also made the list, and no surprise there. Our photo tour of Brickell Heights just days before they opened was one of the most popular blog posts so far this year, and the amount of calls we get for it is a very good sign that the initial occupancy of the building will go smoothly.
4 – 1100 Millecento – 700 views
Millecento’s place as number 4 on the list was a bit more surprising, but not in a bad way. It’s not the newest building in the area, so people aren’t hungry for a preview. There’s really no drama going on with the building (that I have heard of at this time), so people aren’t looking for gossip and info. We still receive a healthy amount of calls and contact requests on Millecento, so I feel it’s safe to say that the traffic is good ol’ prospective residents. That’s great!
5 – Biscayne Beach – 638 views
Edgewater’s newest new building is also on the charts. We covered the progress & opening extensively, so it makes sense that blog readers are interested in the progress. We also have a beautiful 3 bedroom unit listed on the 30th floor with direct bay and Downtown Miami views. It is well-priced and a blank canvas inside. With the amount of attention the building receives, I feel that it will sell quickly.
6 – The Bond on Brickell – 615 views
The Bond is very popular for people who want to live in a brand-new condo in Brickell, but prefer understated elegance and high quality finishes over the kitschy excess that is SLS Brickell. We receive many calls about this building, and there have also been many of our clients who have called about SLS Brickell but then chosen The Bond. It is like SLS Brickell’s quieter sister.
7 – The Plaza at Brickell East Tower – 531 views
The Plaza is basically a Brickell staple. I was surprised that it received more views than any of the IconBrickell towers, but that just shows what the market is interested in. We did a market report on Monday about The Plaza and found that sellers and landlords fare better in today’s market by removing that horrible outdated berber carpet from 2008. There is too much competition in the neighborhood to expect buyers and tenants to sign up for old berber carpet (in case I didn’t make my point on Monday).
8 – BrickellHouse – 530 views
Despite their garage saga, BrickellHouse remains a popular building in the neighborhood. Yes, the garage is broken. No, we don’t know when it will be fixed. Despite that, the finishes are quite lovely, the views and location are great and it remains very popular among our clients.
9 – IconBrickell Tower 1 – 477 views
Of course IconBrickell would be on the list. It has remained one of our most requested buildings since it opened… even since the pool closed. The pool should reopen by the end of the year.
10 – Jade Residences at Brickell Bay – 468 views
Jade is one of the most luxurious buildings in the neighborhood, even after 13 years. Although most buildings in Brickell have beautiful bay views, Jade is where you go if you want an extremely luxurious setting with private elevators and direct bayfront. The only building it competes with is the Santa Maria, except that Jade is more modern and in a more walkable section of the neighborhood.
Do you think that the top viewed buildings on our website are surprising, or expected?


