The average price per square foot of condos listed in Brickell Key has gone down once again, as it has every month since I began this index. The average price per square foot of the ten condos, which represent the Brickell Key Condo Index, fell to $494.61 this month from last month’s figure of $501.55. The weight-adjusted average also fell to $490.87 per square foot versus last month’s weight-adjusted average of $497.82.
Average price per square foot of Brickell Key condos currently listed on the MLS:
This is the first month since I began the Brickell Key Condo Index that the average price per square foot of condos sold over the previous six months has gone up. The average price per square foot of condos sold within the last six months increased to $435.21 from last month’s average of $430.08. The weight-adjusted average also increased to $433.31 from last month’s weight-adjusted average of $424.57. Most of this is attributed to the lack of closed sales at Brickell Key Two. A closed sale of $375 per square foot at Brickell Key Two fell off the average and was replaced by a new closed sale within the past month at $446 per square foot. One closed sale within the past six months encompassed the average in October and November. As I said, the lack of closed sales is to blame.
Isola – 770 Claughton Island Drive | 33131 | $440.14
One Tequesta Point – 888 Brickell Key Drive | 33131 | $407.77
St. Louis – 800 Claughton Island Drive | 33131 | $442.40
Three Tequesta Point – 848 Brickell Key Drive | 33131 | $461.58
Two Tequesta Point – 808 Brickell Key Drive | 33131 | $450.84
Additional statistics can be found in the chart below:
There have been a total of 6 closed sales within the past month which is much better than the pathetic 2 closings revealed in last month’s update. These 6 closings, however, were highly concentrated with 4 of the 6 closings residing at Carbonell. Pending sales have inched up to 18 from last month’s 16 pending sales.
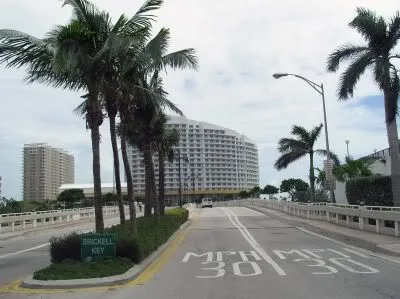
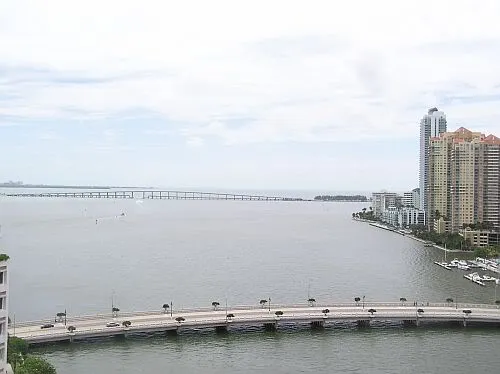
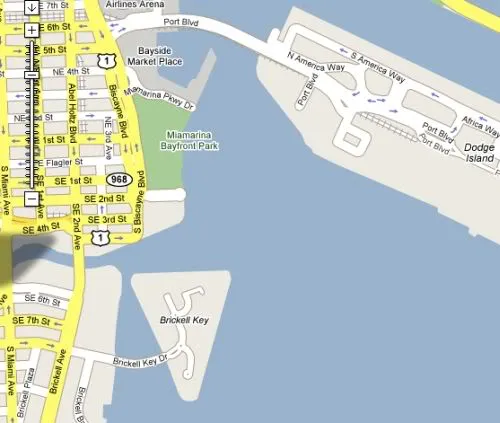
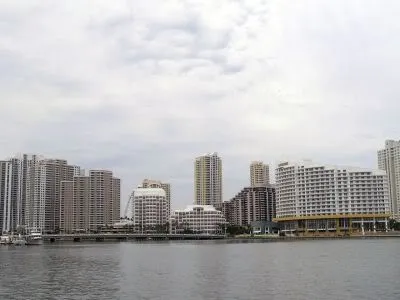
Miami Condo Index – Brickell Key – October 2007
The following statistics were collected on October 27, 2007 but I wasn’t able to compile and publish the numbers until today.
Each month since I began this index, the average price per square foot of condos listed in Brickell Key have gone down slightly when compared to the prior month. This month is no different. The average price per square foot of the ten condos, which represent the Brickell Key Condo Index, fell to $501.55 this month from last month’s figure of $505.30. The weight-adjusted average also fell to $497.82 per square foot versus last month’s weight-adjusted average of $501.64.
The average price per square foot of condos sold over the previous six months has also continually gone down each month since I began this index. The average price per square foot of condos sold within the last six months dropped to $430.08 from last month’s average of $432.94. The weight-adjusted average also fell to $424.57 from last month’s weight-adjusted average of $428.59.
Isola – 770 Claughton Island Drive | 33131 | $437.40
One Tequesta Point – 888 Brickell Key Drive | 33131 | $413.07
St. Louis – 800 Claughton Island Drive | 33131 | $451.18
Three Tequesta Point – 848 Brickell Key Drive | 33131 | $479.76
Two Tequesta Point – 808 Brickell Key Drive | 33131 | $456.63
As with October’s Brickell Condo Index, I’ve provided the following snapshot to make it easier for everyone to make sense of the statistics above.
The first column, to the right of each condo development’s name, is the difference in the average sales and list prices for the statistics at the top, expressed as a percentage. As you can see, each development has an average six month sales price that is well below the list price that is prevalent in the market at each condo building in Brickell Key.
The second column is the number of active listings in each development currently in the MLS. The third column shows the percentage that these listings represent over the total number of condo units in each development. The cells highlighted in green reveal those developments that have active listings that represent less than 10 percent of the the overall units in the building. I find this to be a very healthy number. The 10-15 percent range is considered average while the 15-20 percent range is beginning to approach dangerous levels. The ones highlighted in red reveal those developments that have active listings that represent over 20 percent of the overall units in the building. This indicates that the danger zone has been breached and caution should be heeded. Of the ten developments in the Brickell Key Condo Index, only Courvoisier Courts falls into this territory with 24.26 percent of the building currently on the market.
The fourth column shows the number of pending sales while the fifth column displays the number of closed sales since September’s Brickell Key Condo Index. As you can see, there are 16 pending sales in Brickell Key. The 7 pending sales at Carbonell and 3 at Isola may help to prevent each from penetrating the dangerous 20 percent mark next month. There’s been a total of 2 closed sales since last month’s statistics were presented. September revealed 3 closed sales while 4 transactions closed over the previous month in August. Hopefully, next month won’t reveal the lonely number of 1 or even 0. The One and Three Tequesta Point sisters brought their A-game this past month to prevent a goose egg from appearing in this month’s closed sales figure.
The sixth column shows you the difference in the average list prices from this and last month’s, expressed a percentage. Those highlighted in red reveal those condo buildings which had a drop in their average list price while those highlighted in green show those that had an increase. One Tequesta Point was the only development that was able to muster an up-tick in prices for condos listed.
The seventh column reveals the difference in average sales prices from this and last month’s, expressed as a percentage. The cells displayed in green show those which had an increase, the one in yellow reveals an unchanged condition while those in red reveal a decrease. You may notice that I colored St. Louis in green although it shows 0.00 percent. The average price per square foot of condos sold at St. Louis over the past six months actually inched up 2 cents per square foot. Carbonell and Two Tequesta Point were the only other two to increase. The rest of the bunch fell.
For months, I’ve been saying that Brickell Key is the best indicator that we have of the Miami condo market. Each month, list and sales prices in Brickell Key have come down steadily, as they should be. It’s almost as if we can count on it to provide a true picture.
I have a prediction, however. Take it for what you will because this is just my prediction. The Brickell Key Condo Index will continue on its steady decline. Most of the developments located on Brickell Key were completed prior to 2004, so speculative money in Miami, for the most part, doesn’t reside there. Brickell Key also enjoys a very small percentage of foreclosures and short-sales.
Brickell, however, with its high number of foreclosures and short-sales, prevalent mortgage fraud and large number of new condos coming onto the market will be much faster to correct itself. It won’t have a steady decline. It will crash beyond Brickell Key statistics but then rise at a much higher rate than condo developments in Brickell Key. I think Plaza on Brickell will act as a buoy. I’m not saying that prices at Plaza on Brickell won’t dip lower after closings. I’m just saying that as prices at Plaza on Brickell fall, so will other prices in Brickell but prices at Plaza will act as a floor.
The following graph displays what I have in mind. The line at the top, towards the beginning of the graph, represents Brickell, while the one below it represents Brickell Key. Sorry for the amateurish work but I still need to go trick-or-treating tonight.
It’s not exactly what I have in mind but it gives you an idea. I don’t think the average price per square foot of Brickell condo developments will rise at such a rapid pace as which is indicated by the final portion of the drawing above but I do think that it will fall below, then rise back above that of Brickell Key. The developments in Brickell will, for the most part, be much newer and will draw heavier demand. New speculative money already has their eye on Brickell. Brickell Key will bounce once buyers for Brickell condos flood the market and those who are left behind will look towards Brickell Key. Brickell Key should, in my opinion, sell above Brickell, but I think the world-renowned attention to Brickell, and its oversupply problem, will draw a level of demand that inverts the situation.
What do you all think? Does this make sense or am I out of my mind?
Miami Condo Index – Brickell Key – September 2007
The Brickell Key Condo Index continues to represent the true condition of the condo market in Miami. Its counterpart, the Brickell Condo Index, has become the red-headed stepchild and has failed to provide any true insight into the state of the market.
Until the fraud in Brickell has been squashed, I would keep a closer eye on the Brickell Key Condo Index to better ascertain how progression towards the equilibrium of supply and demand is being achieved.
List prices have continued to fall in Brickell Key. This month, the average price per square foot of condos listed in Brickell Key fell to $505.30 from last month’s figure of $507.22. The weight-adjusted average dropped to $501.64 versus last month’s weight-adjusted average of $502.76.
The continued decline in list prices in Brickell Key is a good indication that sellers are finally “getting it”. If a condo owner is truly motivated to sell their condo then they should aggressively price their unit accordingly. Sellers that are priced in the middle or high end of the pack, and are waiting for the “right” buyer to come along, will save themselves, and their Realtor, time and effort by taking their condo off the market. Matters will only worsen once the new condo inventory hits the market and buyers are given more options. If you NEED to sell, then your one and only shot at it is now.
I was surprised to see that condos listed at Two Tequesta Point were priced over $50 per square foot higher than those listed at Three Tequesta Point. It didn’t make sense to me so I was compelled to investigate. A 2/2.5 listing at Two Tequesta Point immediately jumped out at me that was priced at $1.85M, or $1,042 per square foot. The condo was highly remodeled and looked fabulous, but not $1,000+ per square foot fabulous. In fact, a 2/2.5 seven floors higher in the same line is listed at $998,000. I’m pretty sure that the upgrades in the condo priced at $1.85M aren’t worth $852,000. This is a perfect example of a seller who is waiting for the “right” buyer to come along. Good luck!
The average price per square foot for condos listed at Isola also surprised me. I think we’ll see this number penetrate the $500 per square foot mark on the downside once more sellers of condos listed at Isola finally “get it”. I’m more impressed with St. Louis than I am Isola, but both will eventually have list prices well below $500 per square foot.
The average price per square foot of condos sold within the past six months has also dropped from last month’s average of $437.34 per square foot to this month’s average of $432.94 per square foot. The weight-adjusted average has fallen to $428.59 from last month’s figure of $433.97.
Isola – 770 Claughton Island Drive | 33131 | $444.28
One Tequesta Point – 888 Brickell Key Drive | 33131 | $416.33
St. Louis – 800 Claughton Island Drive | 33131 | $451.16
Three Tequesta Point – 848 Brickell Key Drive | 33131 | $480.92
Two Tequesta Point – 808 Brickell Key Drive | 33131 | $452.72
The following is for those of you have just discovered this blog. The first figure below, beside each building name, represents the total numbers of active listings in that building. The number to the right of that, in parentheses, is the number of currently listed condos in each building expressed as a percentage of the total number of condos. The third number represents the number of pending sales in the building while the fourth is the number of closed sales within the past month
Brickell Key One – 20 (6.33%) | 4 | 0
Brickell Key Two – 47 (11.90%) | 0 | 0
Carbonell – 57 (20.07%) | 4 | 1
Courts Brickell Key – 42 (13.17%) | 0 | 0
Courvoisier Courts – 63 (23.16%) | 1 | 0
Isola – 59 (19.67%) | 2 | 0
One Tequesta Point – 22 (7.61%) | 2 | 0
St. Louis – 9 (6.72%) | 0 | 0
Three Tequesta Point – 28 (11.76%) | 0 | 0
Two Tequesta Point – 26 (9.67%) | 2 | 2
There have been a total of three closed sales within the past month, which is a decline from last month’s total of four closed sales. The number of pending sales has also moved downward from 17 to 15. It appears that two of last month’s pending sales have reached the closing table within the past month, which indicates to me that there has only been one new condo under contract in Brickell Key within one month’s time. Only one condo in all of Brickell Key has been executed within the past month? That can’t be good. This is assuming that none of the pending sales ran into problems within the past month. Best-case scenario is that one contract within the past month has been executed in Brickell Key. The worst-case scenario is that none have been. One word comes to mind…”Holy-tamale-mother-of-god-this-is-one-bad-situation”.
Overall, the condos listed in Brickell Key represent 13.25% of the condos that reside in Brickell Key. That’s actually a relatively healthy figure. However, the figure that is not healthy is the “months of inventory”. Let’s assume an average of four closings per month, as we’ve seen. That means that if closings continued at the same pace and all inventory were to stop right now, it would take 7.77 years to absorb the present inventory. That’s not so good. Do you sellers get it yet? I’m pretty sure that the buyers get it.
Miami Condo Index – Brickell Key – August 2007
Welcome to the third installment of the Brickell Key Condo Index. I have included a few additional statistics to provide a more comprehensive view of the market. This change will be implemented in the Brickell and South Beach Condo Indices in September. I will now report the number of available listings, pending sales and closed sales in each building, as well as express the number of available listings as a percentage of the overall units in each. I have done away with the sold-to-listed ratio since that statistic has not revealed much insight into the market. It can also be easily calculated with the figures that I provide if someone wishes to track that statistic.
The average price per square foot of condos sold in the past six months in Brickell Key has dropped this month to $437.34 versus $442.69 in July. The weight-adjusted average has dropped to $433.97 from $439.02. Brickell Key has proven to be a much more reliable source as to the state of the market in Miami than Brickell. I have yet to find any closed sales that indicate mortgage fraud in Brickell Key as I have in Brickell. This is not to say that mortgage fraud has not occurred in Brickell Key, but I haven’t found any since I began tracking the market in June.
Isola – 770 Claughton Island Drive | 33131 | $471.85
One Tequesta Point – 888 Brickell Key Drive | 33131 | $442.33
St. Louis – 800 Claughton Island Drive | 33131 | $451.18
Three Tequesta Point – 848 Brickell Key Drive | 33131 | $480.92
Two Tequesta Point – 808 Brickell Key Drive | 33131 | $431.99
As mentioned in the introductory paragraph, I will now include additional statistics each month. The first number beside each building name represents the total numbers of active listings in that building. The number to the right of that, in parentheses, is the number of currently listed condos in each building expressed as a percentage of the total number of condos. The third number represents the number of pending sales in the building while the fourth is the number of closed sales within the past month. Pending sales is a leading indicator and should reveal, in future months, when the condo market begins to rebound.
Brickell Key One – 20 (6.33%) | 4 | 1
Brickell Key Two – 49 (12.41%) | 0 | 0
Carbonell – 57 (20.07%) | 3 | 0
Courts Brickell Key – 41 (12.85%) | 2 | 1
Courvoisier Courts – 58 (21.32%) | 1 | 0
Isola – 53 (17.67%) | 2 | 0
One Tequesta Point – 23 (7.96%) | 2 | 1
St. Louis – 9 (6.72%) | 0 | 1
Three Tequesta Point – 20 (8.40%) | 1 | 0
Two Tequesta Point – 25 (9.29%) | 2 | 0
As you can see from the statistics above, there were only four closed sales in Brickell Key within the past month. This reveals a slow market but the 17 pending sales indicate that the following months should prove to be more active if 70 percent of the pending sales actually close. This is assuming that the pending sales are scheduled to close within the next 60 days.
I’d love to hear some feedback regarding the latest statistics provided. I hope the additions shed new light into the Miami condo market. I’m particularly curious to see the number of pending sales in Brickell when I publish the Brickell Condo Index for September.
Miami Condo Index – Brickell Key – July 2007
This is the second installment of the Brickell Key Condo Index. The data was collected on July 27, 2007. Overall, list prices declined about .82% in the past month for condos listed in Brickell Key. The average price per square foot in June for condos listed was $519.97 versus an average price per square foot of $515.71 for the month of July. The weighted-average price square foot in June was $513.19 versus $510.83 this month. Each building in the index, except Brickell Key One and Two Tequesta, had a decrease in their average price per square foot over the past month.
The average price per square foot of condo units sold in the past six months was $442.69. This is compared to an average price per square foot of $445.59 for condos sold over the preceding six months in June. Prices went down about .65% in Brickell Key in one month’s time. The weighted-average price per square foot for condos sold in the past six months in Brickell Key was $439.02. This compares to a weight-adjusted average of $441.05 in June.
Isola – 770 Claughton Island Drive | 33131 | $465.90
One Tequesta Point – 888 Brickell Key Drive | 33131 | $444.10
St. Louis – 800 Claughton Island Drive | 33131 | $466.15
Three Tequesta Point – 848 Brickell Key Drive | 33131 | $480.92
Two Tequesta Point – 808 Brickell Key Drive | 33131 | $431.99
The sold-to-listed ratio, expressed as a percentage, of each building is found below. Overall, the average Brickell Key condo this month is listed 16.39% above what closed sales have dictated. The weighted-average reveals that the typical Brickell Key condo is listed 20.63% above average closed sales. Both of these numbers are down from last month.
Isola – 770 Claughton Island Drive | 33131 | 13.92%
One Tequesta Point – 888 Brickell Key Drive | 33131 | 9.07%
St. Louis – 800 Claughton Island Drive | 33131 | 13.82%
Three Tequesta Point – 848 Brickell Key Drive | 33131 | 19.05%
Two Tequesta Point – 808 Brickell Key Drive | 33131 | 37.61%
There were a total of 10 closed sales in Brickell Key since the June numbers were released. This is one more transaction that occurred in one month’s time than in the 18 buildings that are represented in the Brickell Condo Index. The 10 buildings that compose the Brickell Key Condo Index have a total of 2,816 condos versus the 5,349 condo units represented in the Brickell Condo Index.
I feel that there is going to be far more stability in Brickell Key than in Brickell. Clients that I have been working with are much more comfortable looking at properties in Brickell Key. Prices are more reasonable, the neighborhood offers a sense of exclusivity and every building in Brickell Key is waterfront.
Miami Condo Index – Brickell Key – June 2007
This week I decided to compile a condo index for Brickell Key. The data wasn’t quite as shocking as the condo index for Brickell but it did provide a few surprises. Overall, condo units in Brickell Key are listed at an average price per square foot of $519.97, or $16.31 per square foot less than condos in Brickell. The average price per square foot is $513.19 for listed units when using a weighted average. The latter is a bit lower due to a higher percentage of the units in Brickell Key residing in older buildings that have a lower price per square foot.
The average price per square foot for condos sold in the past six months in Brickell Key is $445.59, or $441.05 when weight adjusted. This is $26.17 per square foot less than condo units sold in Brickell over the last six months, or $54.08 per square foot less when comparing their weight-adjusted averages. These figures in themselves are a bit shocking because most would think that units sold in Brickell Key would bring higher prices as it has the reputation of being a more exclusive area. A few of the older buildings in Brickell Key did bring down the overall average but I feel that the difference is more attributable to the mortgage fraud that has occurred in a few large buildings in Brickell. I think we’ll see prices in Brickell Key surpassing Brickell as prices in Brickell readjust to account for the mortgage fraud. Many of those buildings already have a high percentage of foreclosures and those will bring down the overall average in Brickell as other units will need to adjust their prices downwards.
While the price per square foot for listed and sold condos in Brickell Key might be less, the average condo is mispriced by a greater percentage than units in Brickell. The average Brickell Key condo is listed 19.20% higher than what condos have actually sold for in the past six months, or 25.01% when weighted. This is well above the 13.98%, and 10.48% weight adjusted, numbers for Brickell.
I used a total of 10 buildings in Brickell Key to derive the condo index for that neighborhood. Those 10 buildings are found below, along with the statistics that were calculated. The first set of numbers are for condo units that are currently listed in those buildings.
The following numbers represent the average price per square foot of the closed sales within the past 6 months in each building. It is important to note that there was only one closed sale in Courvoisier Courts over the past six months. I feel that the particular unit that did close had a price per square foot that was well above the price per square foot of units that will close in the upcoming months. Prices should, and will most likely, end up more in line with condo units at the building called Courts Brickell Key.
Isola – 770 Claughton Island Drive | 33131 | $477.28
One Tequesta Point – 888 Brickell Key Drive | 33131 | $449.42
St. Louis – 800 Claughton Island Drive | 33131 | $ 466.15
Three Tequesta Point – 848 Brickell Key Drive | 33131 | $520.86
Two Tequesta Point – 808 Brickell Key Drive | 33131 | $447.32
As mentioned earlier, the average condo in Brickell Key is overpriced by 16.65%, or 22.15% when weight-adjusted. The break-down for each building is below.