BrickellHouse Floor Plans, Info and Pricing
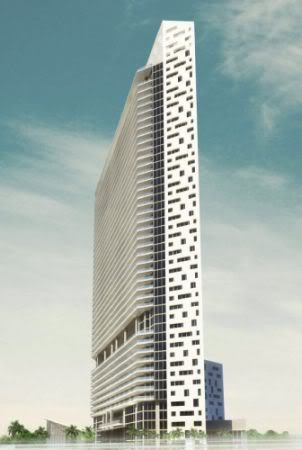

BrickellHouse is now accepting reservations. The 374-unit condo development will be located directly west of Jade and north of Emerald at Brickell at 1300 Brickell Bay Drive. BrickellHouse has several appealing features but there are two which will also make it rather unique. One, it will allow daily rentals but will not be considered a condo-hotel. The building will have on-site maintenance and housekeeping staffs as well as an in-house management program for owners who wish to rent their units on a daily, weekly or monthly basis. Owners will obviously first need to finish and furnish their decorator-ready unit in order to be included in the leasing program. You can read more about this program in the BrickellHouse brochure. The second unique aspect of BrickellHouse is the parking. The building will have a fully-automated parking garage.
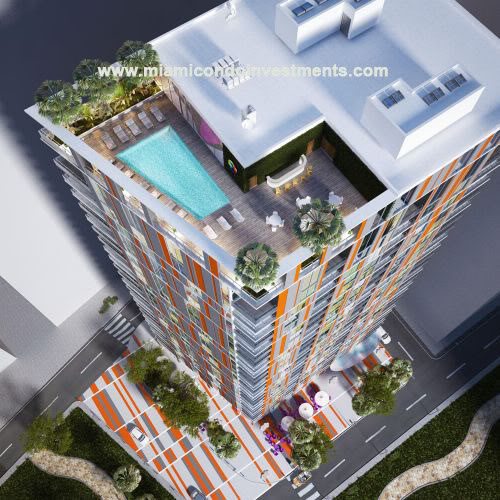
The 46-story high-rise will have an array of lavish amenities which include:
- rooftop pool and sundeck
- fully equipped, state-of-the-art fitness center
- luxury health spa with sauna, steam and private treatment rooms
- High-definition theater room with 10-foot screen and theater-style seating
- Private owner’s lounge with event bar, catering kitchen and daily world newspapers
- Resort deck with putting green and summer kitchen
- 50-foot-long lap pool with poolside cabanas and heated Whirlpool spa
- Resident club room with conference and meeting rooms
- 24-hour concierge and security
- 24-hour guest valet parking
Additionally, Meat Market, a steakhouse on Lincoln Road in South Beach, has already signed on to occupy part of the retail space on the ground level of BrickellHouse.
BrickellHouse will be comprised of studio, 1 bedroom/1 bath, 2 bedroom/2 bath and 3 bedroom/3 bath units. The spreadsheet below will show you the approximate interior and exterior square footage for each. You can also refer to the BrickellHouse floor plans where you will also be able to view layouts for the BrickellHouse penthouses.

A full price list has not been released but the pricing below will give you a general idea for what one might be able to afford at BrickellHouse. Contact us if you have an interest in purchasing a unit at BrickellHouse and we will be able to get you pricing for other units.
Studios
- Unit 2212 (S3) – $163,900 west view
- Unit 1906 (S1) – $197,900 eat view – (420 sq ft under a/c)
1 bed/1 bath
- Unit 2507 (A7) – $276,400 east view
- Unit 2511 (A5) – $273,900 west view (790 sq ft under a/c)
2 bed/2 bath
- Unit 2507 (B4) – $435,900 east view
- Unit 2002 (B5) – $331,900 west view (1,116 sq ft under a/c)
2 bed + den/2 bath
- Unit 3008 (B1) – $424,900
3 bed/3 bath
- Unit 3002 (C1) – $683,900 (1,451 sq ft under a/c)
Contact us at 305-428-3860 or [email protected] to learn more about BrickellHouse.
Miami Condo Sales Up 58% Year-Over-Year in September; Prices Rise


The Miami real estate recovery continues, according to a report released Wednesday by the National Association of Realtors. September sales of existing condominiums in Miami rose 58 percent year-over-year while sales of existing single-family homes increased 46 percent in the same time period. Prices were also on the rise in September. The average sales price for condominiums in Miami-Dade County increased 13 percent, from $187,185 in September 2010 to $211,455 last month while the average sales price for single-family homes increased 29.8 percent, from $264,602 in September 2010 to $343,497 in September 2011.
Proposed Bill Would Incentivize Foreign Buyers of Real Estate


It’s no secret that the Miami real estate market has experienced a dramatic turnaround over the past two years due in large part to an overwhelming interest from foreigner buyers. A bipartisan bill introduced into the Senate earlier today would provide an additional incentive for foreigners to pour further capital into the U.S real estate market. The bill, the Wall Street Journal reported, would grant residence visas to foreign buyers who make a cash investment of at least $500,000 on residential real estate located throughout the U.S. The residence visa would allow a foreign buyer to bring a spouse and any children under the age of 18 into the country but would not allow them to work unless a regular work visa is obtained. Furthermore, once the property is sold, they would no longer be able to legally stay in the country.
If passed into law, this would be a tremendous boon for the South Florida real estate market. While a visa incentive likely won’t encourage further investment by most foreign buyers, it would encourage wealthy foreigners living in countries with political instability to purchase here. With that thought, two countries immediately come to mind – Venezuela and Argentina. This would be an almost ideal solution for the wealthy there. It should go without saying that a disproportionately high number of people from those two countries would choose a city like Miami – “the gateway to the Americas” – if they were to take advantage of the visa incentive.
Mybrickell Renderings
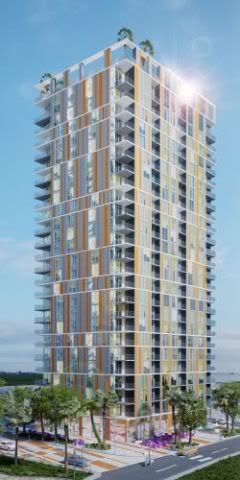
The development site for MyBrickell is located at 30 SE 6 St, directly west of 500 Brickell and south of Brickell on the River South. Below, are the various development renderings for MyBrickell currently made available to the public.
MyBrickell is a 28-story condo development with 192 total units.


Two New Brickell Condo Developments to Launch Preconstruction Sales By Year’s


Miami continues to buck the trend. While other U.S. cities are dealing with a depressed real estate market, Miami has growing concerns over a lack of inventory. Two new Brickell condo developments hope to help alleviate those concerns, however, with the launch of preconstruction sales by year’s end. MyBrickell, to be located at 30 SE 6 St, will add 192 condo units while BrickellHouse, to be located at 1300 Brickell Bay Dr, will add an additional 374 condo units.
MyBrickell will be developed by The Related Group which has vast experience in developing condominiums, especially in South Florida. Their portfolio of past developments includes Icon Brickell, The Plaza on Brickell, 500 Brickell and 50 Biscayne. Arquitectonica, an internationally acclaimed architectural firm, has been selected to design MyBrickell with Karim Rashid to design the interiors. Studios will start from $164,900, 1 bedroom + den units from $219,900, 2 bedroom units from $249,900 and 2 bedroom + den units from $299,900.
BrickellHouse is to be developed by Newgard Development Group, a relatively new name in development. The Sieger Suarez team will be the architects behind BrickellHouse and Yabu Pushelberg has been selected to design the interiors. Pricing information for condos has not yet been released but I was told that the average price per square foot will approximate $375.
Reservations are now being accepted for condos at MyBrickell with an initial reservation deposit. The reservation, however, will not entitle you to a specific unit. The developer will offer a unit to the prospective buyer given their price range and unit preferences. The prospective purchaser will then have 24 hours to accept the unit offered and the balance of a 10% deposit will be due upon acceptance. Those who reject the offering or do not respond within the 24-hour time period will have their initial reservation deposit returned to them. BrickellHouse plans to accept reservations early next week and will actually allow you to choose a specific unit with a 10% initial deposit. Another 10% will then be due upon execution of the contract, 10% at groundbreaking, 20% when construction reaches your floor and a final 20% when construction is topped off – for a total of 70% due prior to closing.
Contact us at 305-428-3860 or [email protected] if you have an interest in reserving a unit at MyBrickell and/or BrickellHouse, Miami’s two newest preconstruction condo developments.
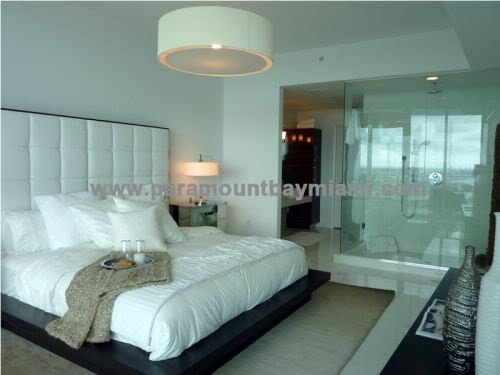
The Scoop on Paramount Bay
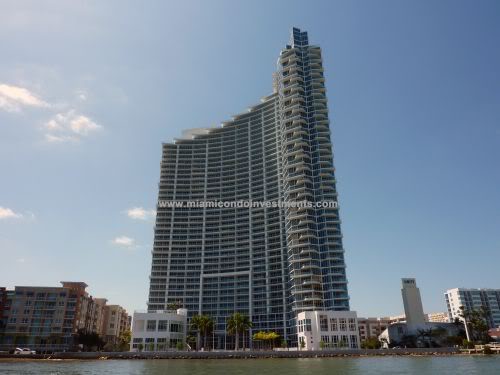

There is a lot of excitement in the air regarding the Paramount Bay sales launch so I wanted to take a moment to share with everyone the latest information that we have. Sales are expected to begin on or around October 10th. At that time, a total of 60 units, 6 units from each of the 10 lines, are expected to be released. We expect pricing to increase after the initial 60 units are sold. The location of these 60 units has not yet been determined but we have been told that they will be scattered throughout the building with a few on low floors, a few on mid-level floors and a few located on high floors.
In addition to the 60 units, the 11 penthouses at Paramount Bay will be available for sale at that time. 3 of the 11 penthouses have already been reserved and we expect the remaining 8 penthouses to sell quickly. The remaining 8 penthouses range from 5,128 total square feet to 5,941 total square feet with 5 of the 8 having terraces over 1,900 square feet. It’s important to note that these terraces were constructed with 10-inch reinforced concrete which allows for a Jacuzzi, pool or outdoor kitchen to be installed.
Contact us if you have any questions regarding Paramount Bay or if you would like to schedule a tour.
Paramount Bay Sales to Launch Early Next Month

We received official word late last week that sales for Paramount Bay condos will launch early next month. Of the many condo developments constructed during the recent condo boom in Miami, Paramount Bay will be the last to launch sales. It is also one of the few luxury waterfront developments and perhaps the finest of the bunch. Buyers have eagerly been awaiting for condos at Paramount Bay to begin sales and we expect units to sell quickly. As a result, it is important for potential buyers to become familiar with the building and floor plans before the launch of sales. Last week, we were given a private tour of Paramount Bay and can offer the same opportunity to those who contact us with an interest to purchase a condo at Paramount Bay.
Please refer to the Paramount Bay condos website for full information regarding the sales launch and to view pictures of various condos at Paramount Bay.
Miami & Miami Beach Condo Supply Down Sharply
Thanks in large part to a strong interest from international buyers, the South Florida condo market has fared extremely well over the past year despite global economic worries. One would assume that the supply of condos has shrunk as a result, but to what extent? Is the condo inventory problem finally a thing of the past? Does the current supply of condos indicate a transition from a buyer’s market to that of a seller’s market? The condo inventory and sales figures below should shed light on the subject to help answer these questions.
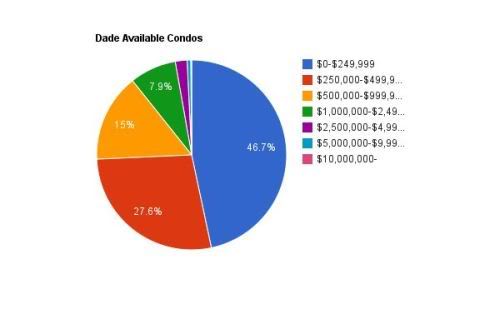
The figures below were compiled on August 31, 2011. Three sets of spreadsheets and graphs can be found below. The first pertains to the inventory and sales figures for condos throughout Miami-Dade County. The second focuses on those located only in Miami while the third set concentrates on condos residing only in Miami Beach.
I grouped the number of available condos into seven distinct price ranges and provided total closed sales figures over the past six months for each. Columns three, four and five display figures for average closed sales per month, months of supply and years of supply, respectively. The last three columns show the percentage change in those figures when compared to those published slightly over 16 months earlier in April 2010.
As you will see, there is currently a little over 6 months worth of condos for sale throughout Miami-Dade County. Obviously, the supply figures vary within each price range and again when looking at the figures specific to Miami and Miami Beach. It is important to note that the figures below only include resales listed on the MLS. Developer inventory and closed sales are not included. My guess is that the statistics would be even more compelling had those figures been included. To put things into perspective, I recently heard that Icon Brickell had been averaging around 60 closed sales per month. With 1,796 total units, Icon Brickell had been the poster child of the oversupply problem in Miami. Icon Brickell currently has less than 100 available condos for sale. Word on the street is that sales for condos at Paramount Bay will launch later this month. Once it does, Paramount Bay will be the last of the recently constructed condo developments to hit the market and will add just 350 total units. Many of those condos have already been secured by original contract holders and interest from potential buyers for the remaining units is staggering. A shortage of condos in Miami is an almost certain problem that lurks on the horizon. Keep in mind, even if new condo developments were planned and approved tomorrow, it would be another 3-5 years for those condos to be completed and delivered.
Below, you will find the Miami-Dade County condo supply and sales figures for August 2011:


The following statistics encompass only those condos located throughout Miami (not other areas of Dade County such as Miami Beach, Aventura, Sunny Isles Beach, etc.):


The following statistics encompass only those condos located throughout Miami Beach:


developer inventory
CBS4 Reports on the Downtown Miami Condo Market Turnaround
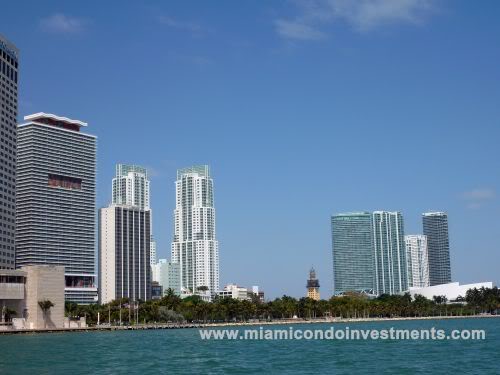

For those who missed it earlier this evening, CBS4 aired a segment entitled “Is Downtown Miami’s Condo Market on the Rebound?“. CBS4 reporter, David Sutta, highlighted the recent sellout of the Viceroy Tower at Icon Brickell and interviewed our very own, of the Miami Condo Investments team, to get his perspective regarding the dwindling condo inventory in Downtown Miami. He compares the condo inventory at the peak of the market to the inventory that now exists. Over the past year, prices have begun to rebound in Downtown Miami as inventory has been swallowed up predominantly by foreign buyers. There is no reason to believe that the market turnaround will reverse course anytime soon as new condo inventory in Downtown Miami is years away from hitting the market.


