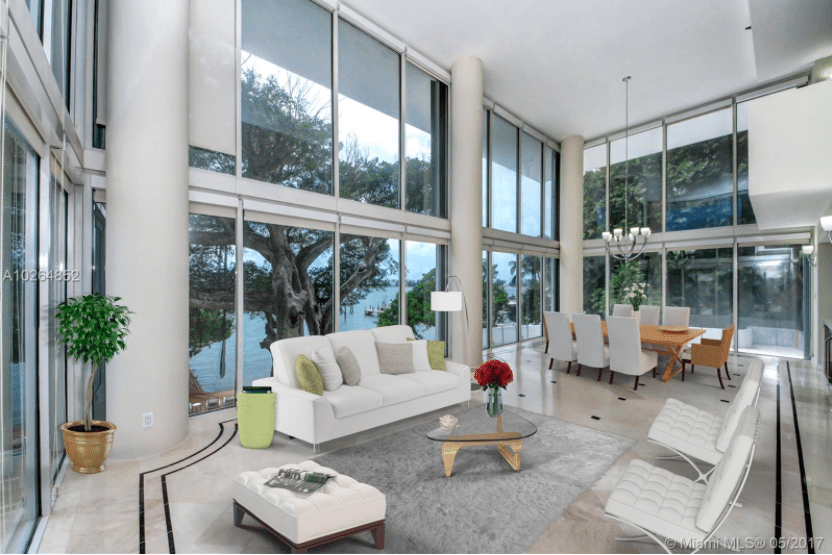
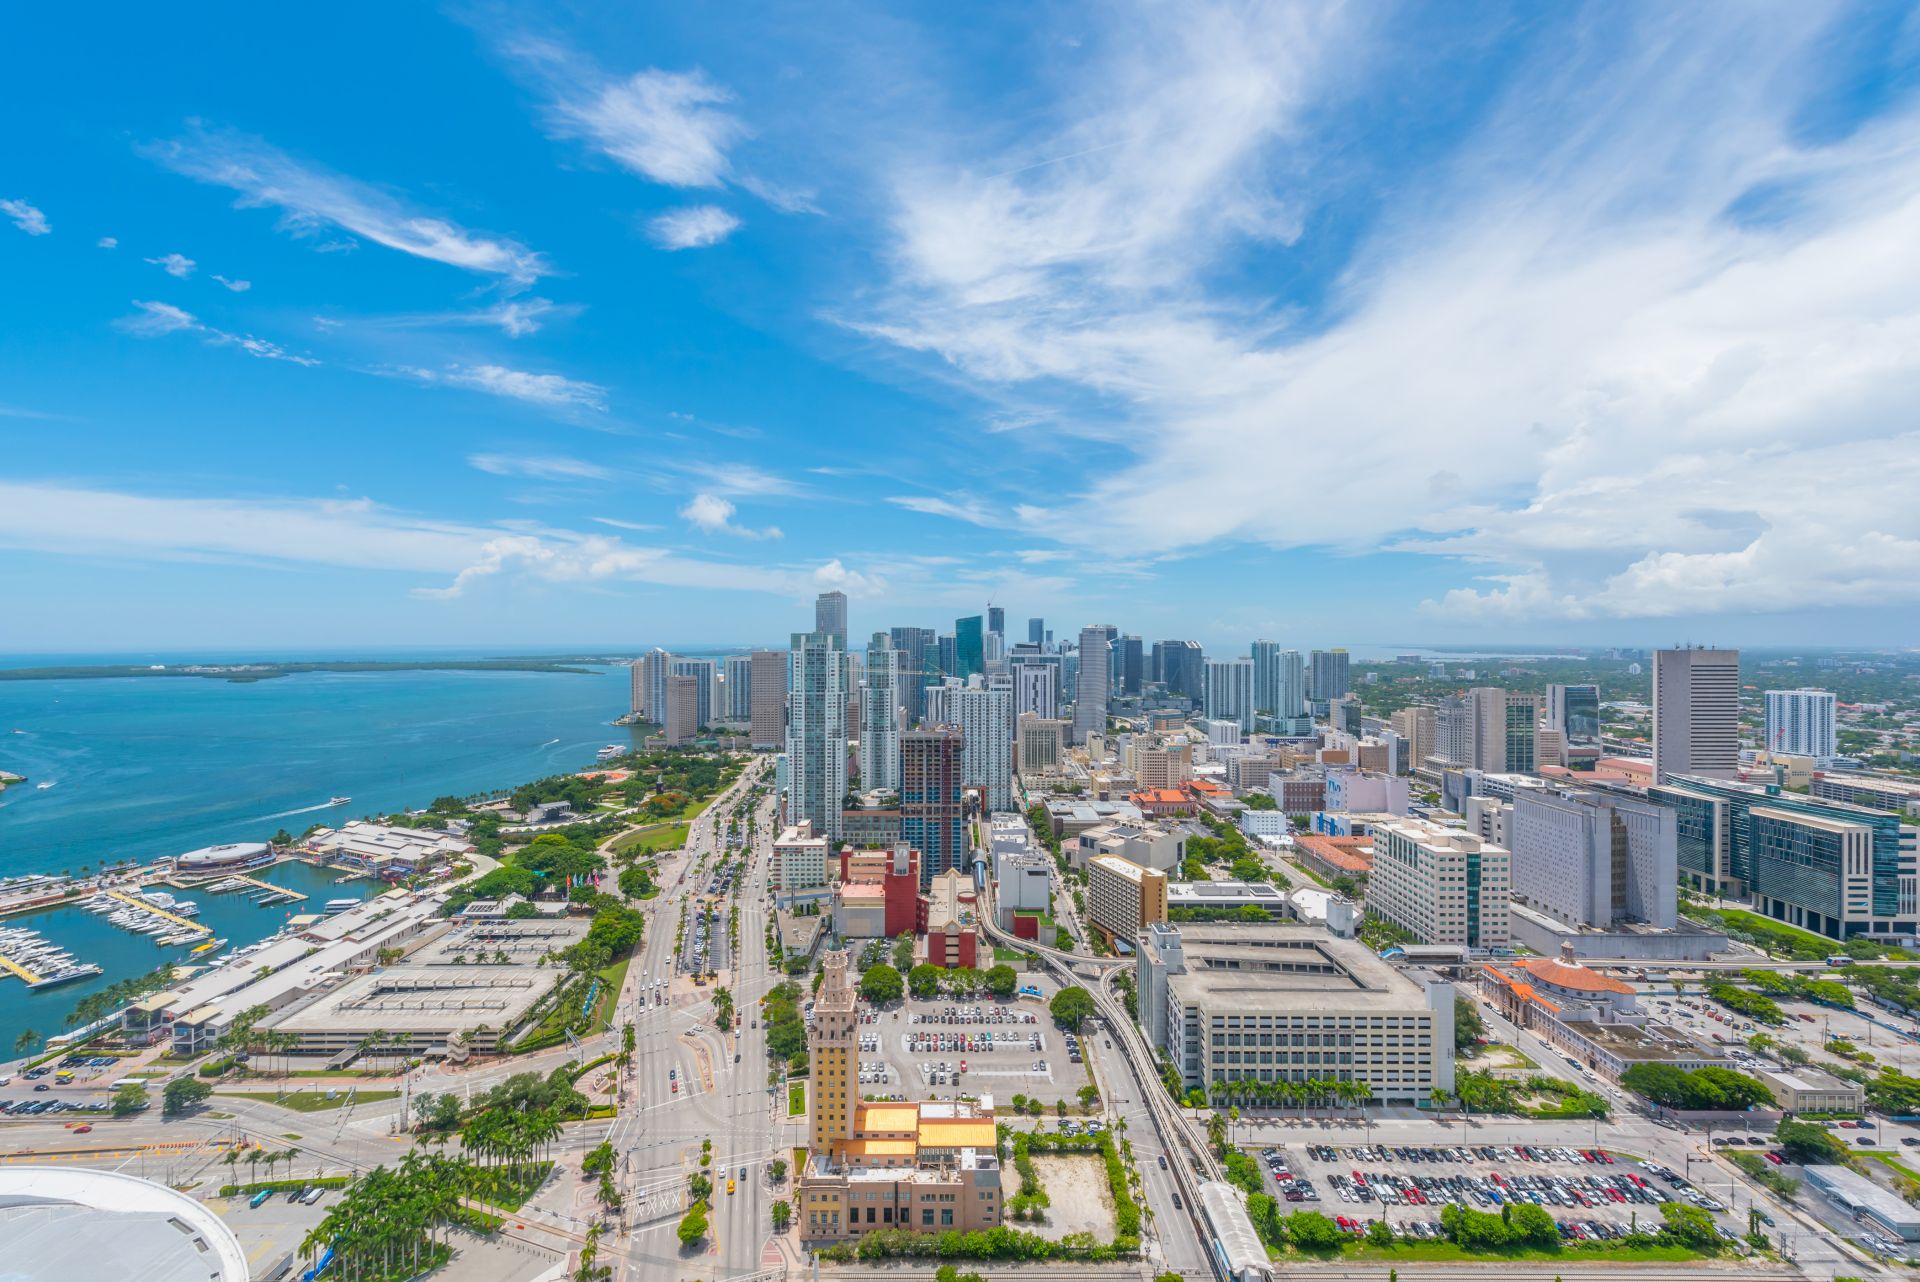
Miami Q1 Residential Condo and Single Family Home Numbers are In, and They Look Good!
According to the quarterly Douglas Elliman’s report for Q1 in Miami-Dade County, residential sales continue to rise. With limited inventory of single-family residences and condominiums, prices and sales have increased drastically.
Single-family sales increased by 162 percent and new signed contracts for condo sales have increased by 338.9 percent.
What’s interesting for both condo and residential sales in Miami, the sales price of $5 million and higher have increased substantially. With condo sales over $5 million at a 492.2 percent increase and residential sales over $10 million at a 339.5 percent increase.
The median condo sale price is at $300,000, with a 14 percent increase compared to this time last year. According to the report, “Condos showed much larger gains due to their earlier slowdown in activity early on in the pandemic.”
For Miami Beach, sales of condos and houses increased by 85% with 1,425 closings in Miami Beach. Nearly 10-month supply for single-family homes and condos remained. Condo sales in Miami Beach have increased by 75 percent to 1,192 sales. The median condo price at $510,000 rose 44 percent compared to this time last year.
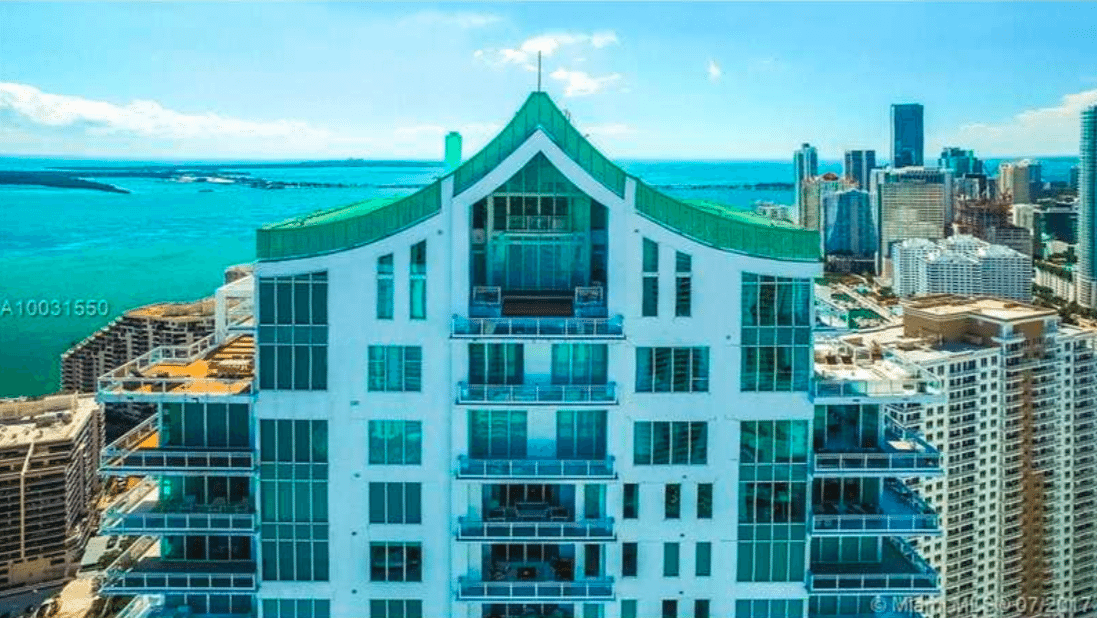
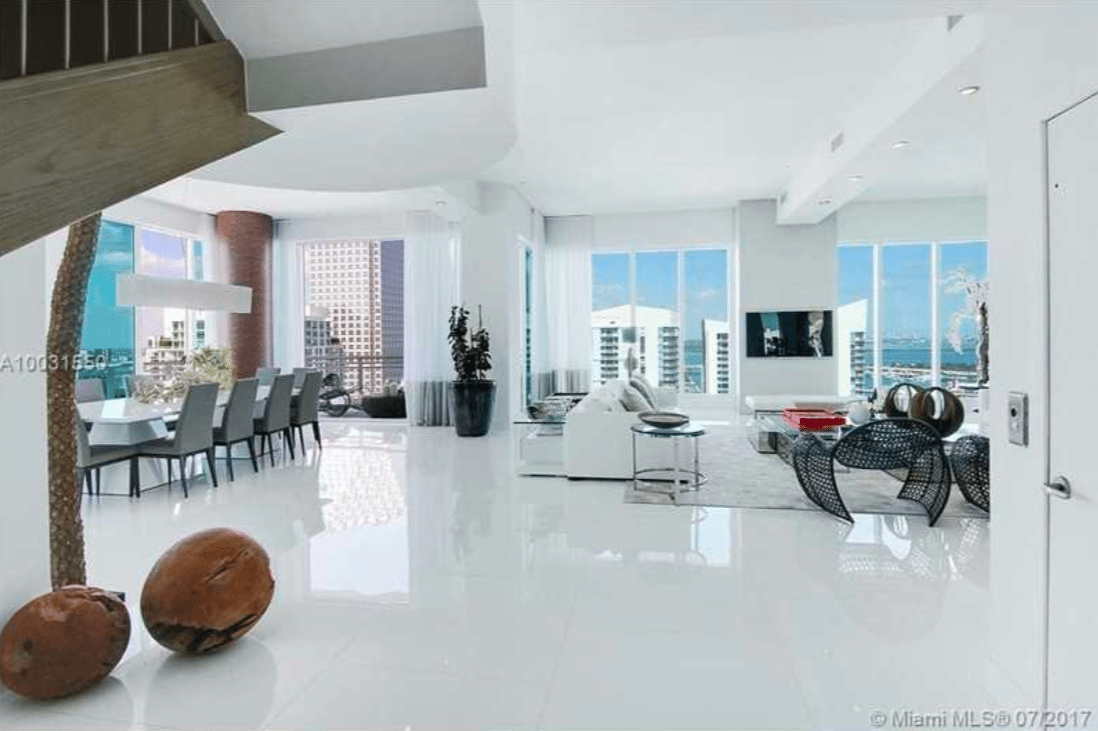
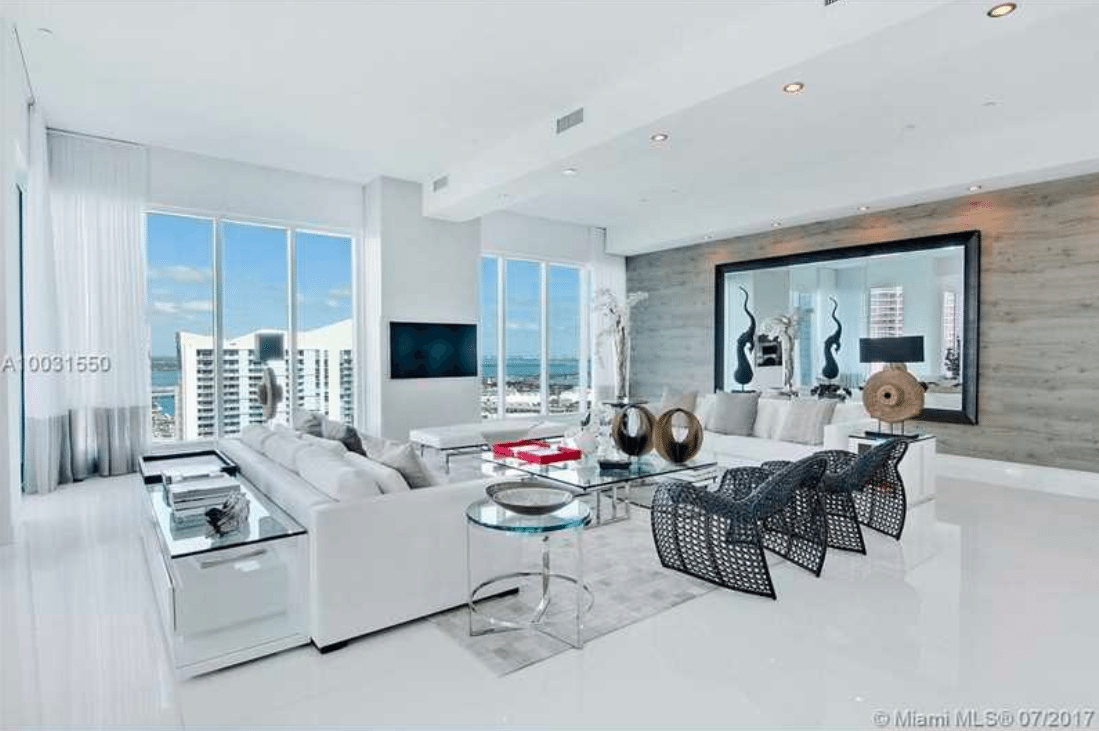
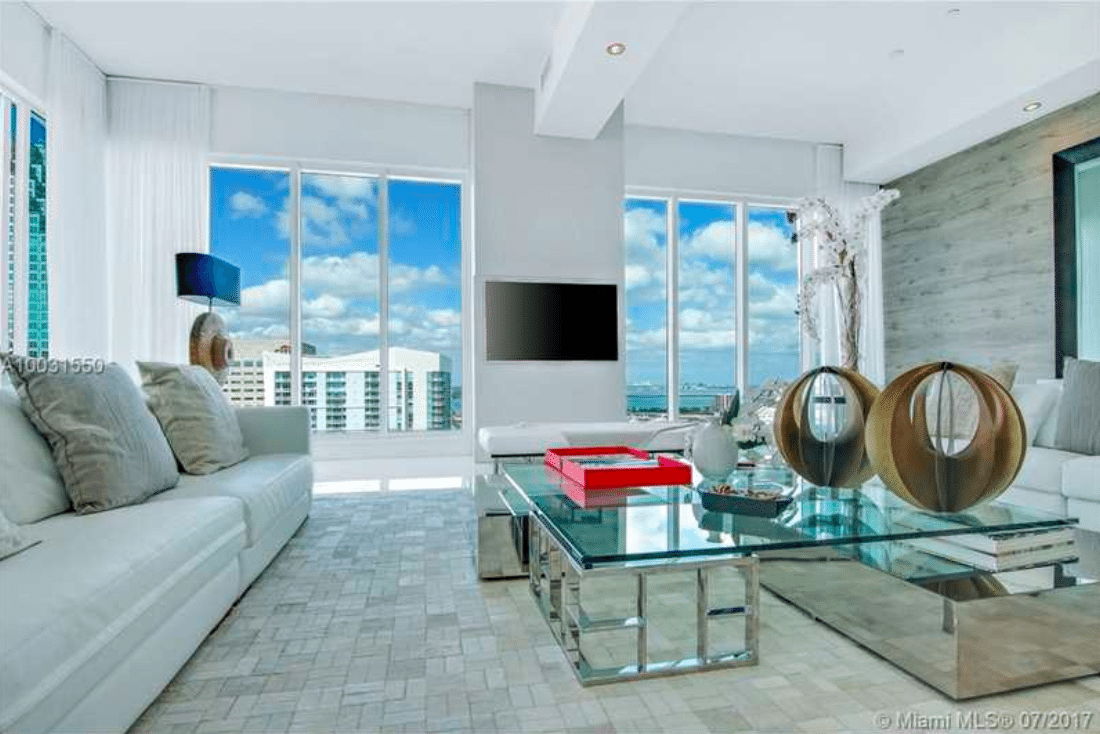
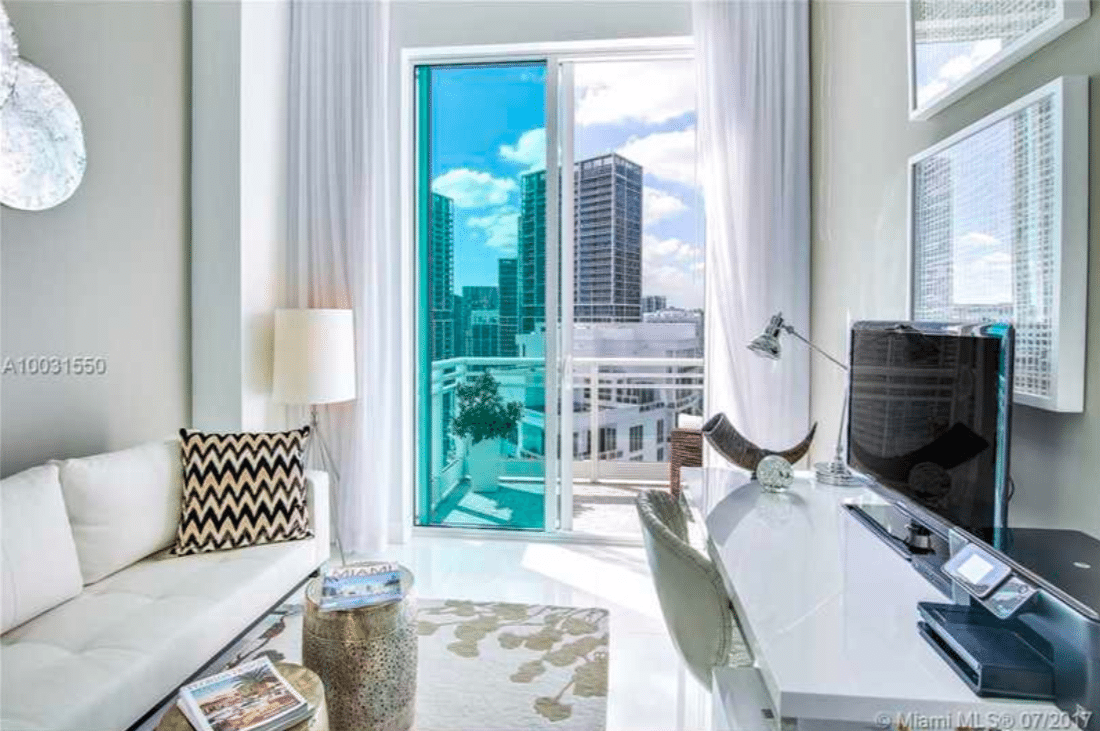
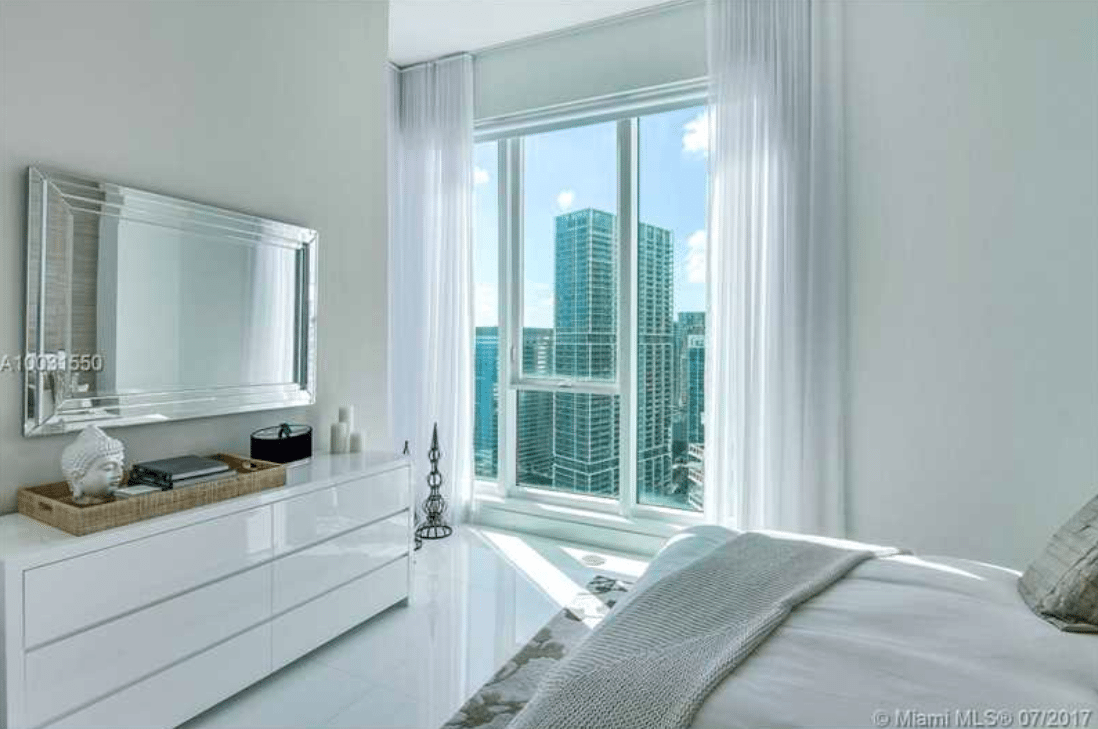
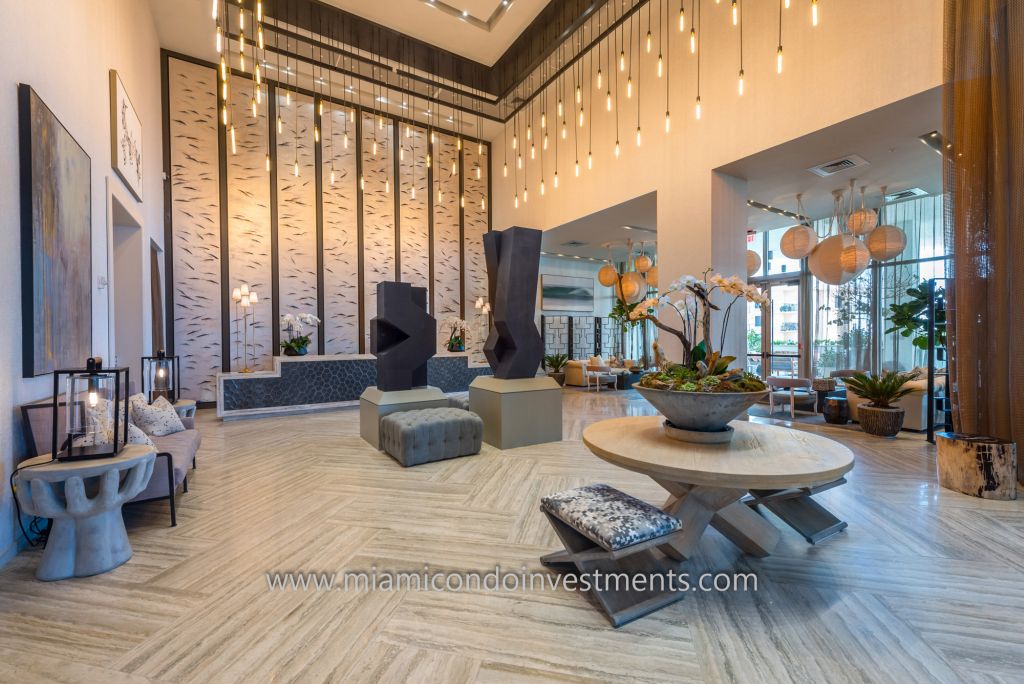
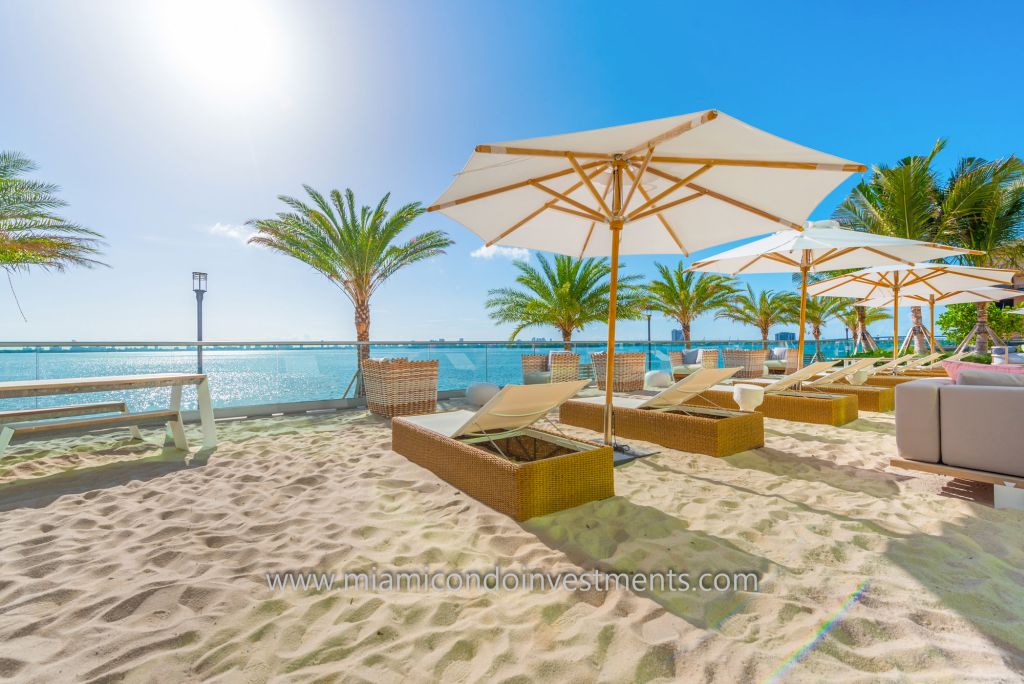
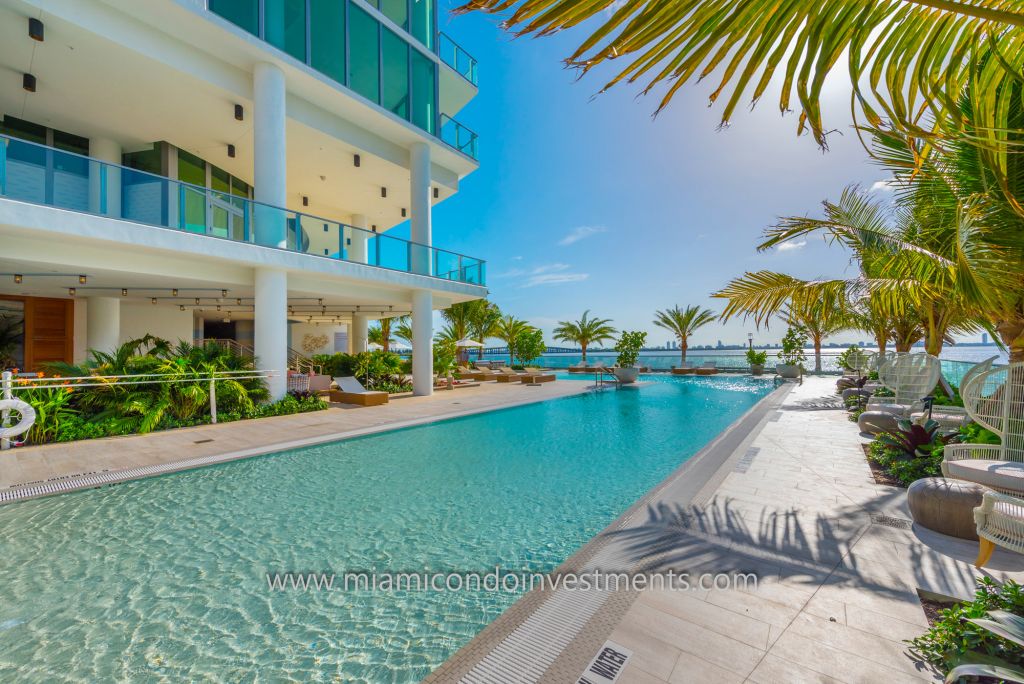
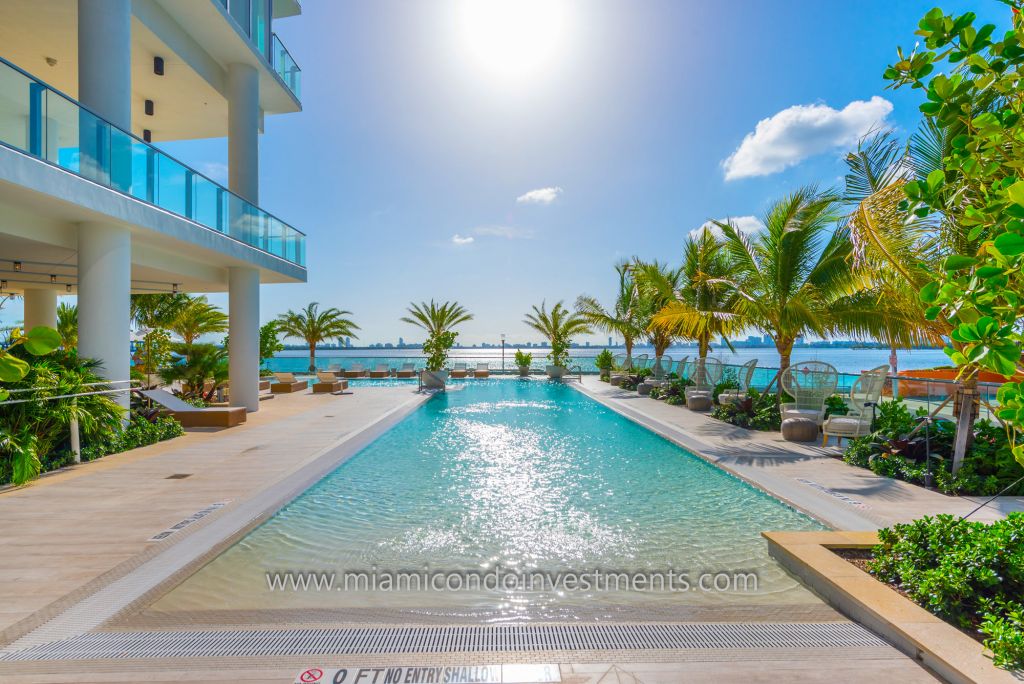
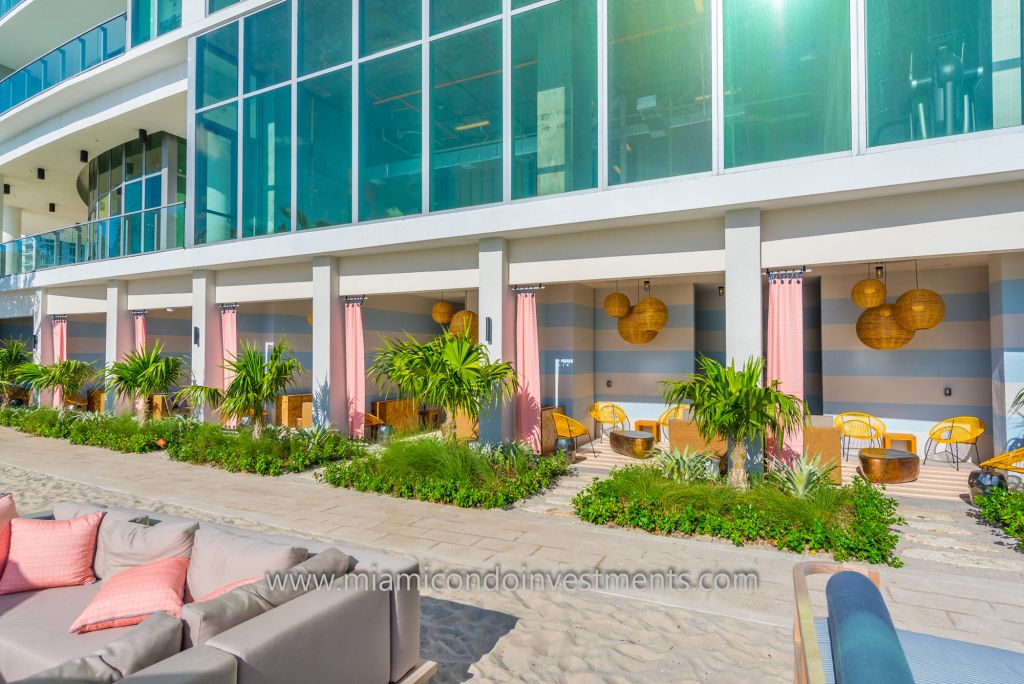
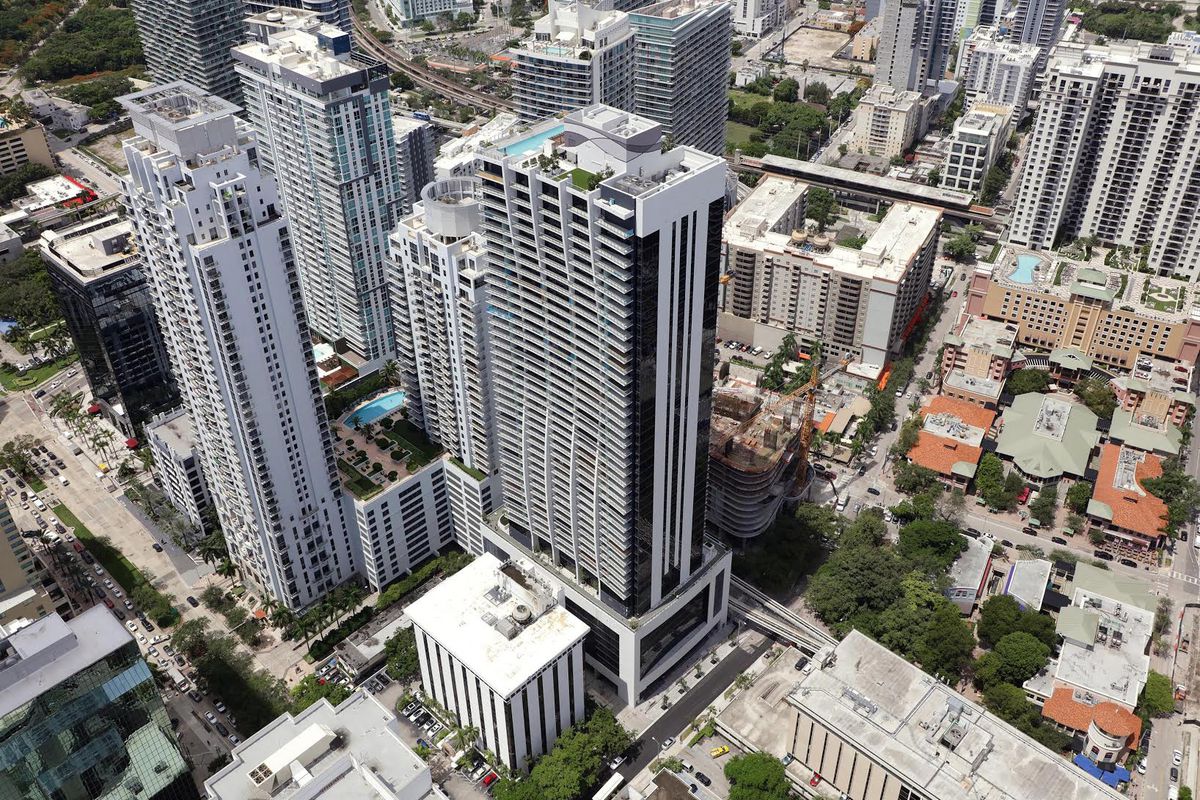
As the busy season for Miami real estate progresses, we’ve noticed quite the increase of inquiries from both renters and buyers for one of Edgewater Miami’s most upscale developments: the beautiful, Biscayne Beach. Its most notable feature is found on the ground floor of the building – mainland Miami’s first-ever beach club, complete with sand, lounge chairs, beach volleyball, and cabanas. Also, a highlight of the building is the gorgeous interiors by internationally-acclaimed celebrity interior designer, Thom Filicia (of Bravo’s hit TV show, Queer Eye for the Straight Guy). Completed in July of 2017, Biscayne Beach saw its first condo resale in September and has since seen 6 other resales closed to date.
Let’s check out the stats for our prospective renters and buyers…
Current Inventory
According to the MLS, there are 68 units currently available for rent of the building’s 391 total residences, 9 listed as pending rentals, and 48 marked as rented. Of those 68 units available for rent, 20 are 1-bedroom floor plans, 34 are two-bedrooms, 12 are three-bedrooms, and the final two are a penthouse and a beach house residence.
82 units at Biscayne Beach are currently listed for resale, with 3 marked as pending, and 7 closed.
Closed Rentals
Here are the price ranges for the closed rentals to date:
-1 bedroom units: $2300 – $2900 per month
-2 bedroom units: $2,500 – $4,200 per month
-3 bedroom units: $5,200 – $6,600 per month
Closed Resales
Here are the sales prices for the 7 resales that have closed to date:
-1 bedroom units:
-#1009 – $573,000 ($488 per sq ft)
-#2009 – $504,000 ($477 per sq ft)
-#3509 – $530,000 ($501 per sq ft)
-3 bedroom units:
-#1907 – $1,050,000 ($499 per sq ft)
-#2307 – $1,255,000 ($597 per sq ft)
-#3307 – $1,250,000 ($594 per sq ft)
-#4007 – $1,400,000 ($666 per sq ft)
The fact that all the closed resales so far are either of the 07 or 09 lines tells us that these two floor plans are the building favorites. Considering that they are located at the southeast (07 line) and southwest (09 line) corners of the building, there’s no wonder why. The view really opens up to the south with the added bonus of being able to enjoy views of the Downtown Miami skyline and sunset.
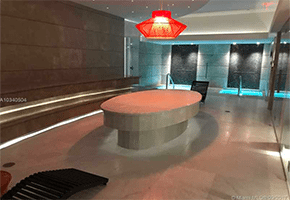
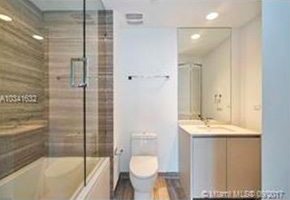
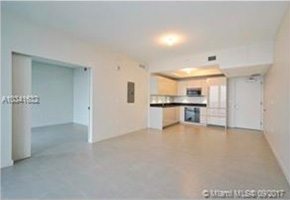
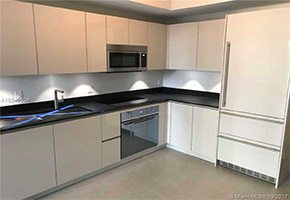
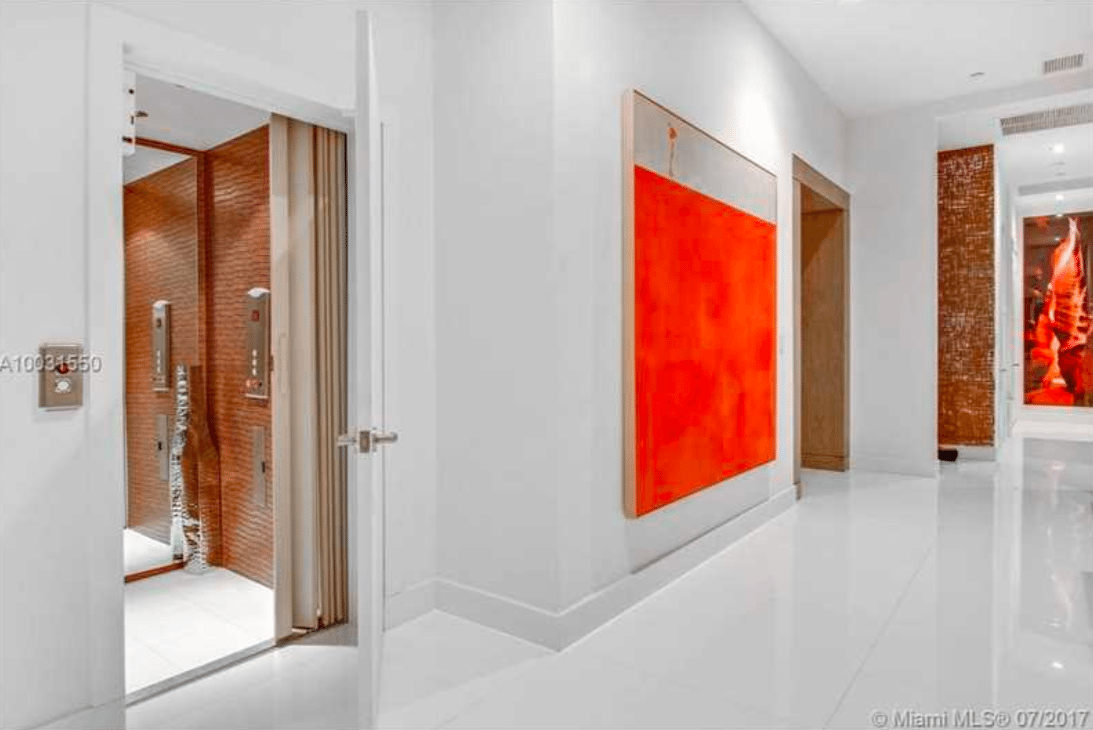
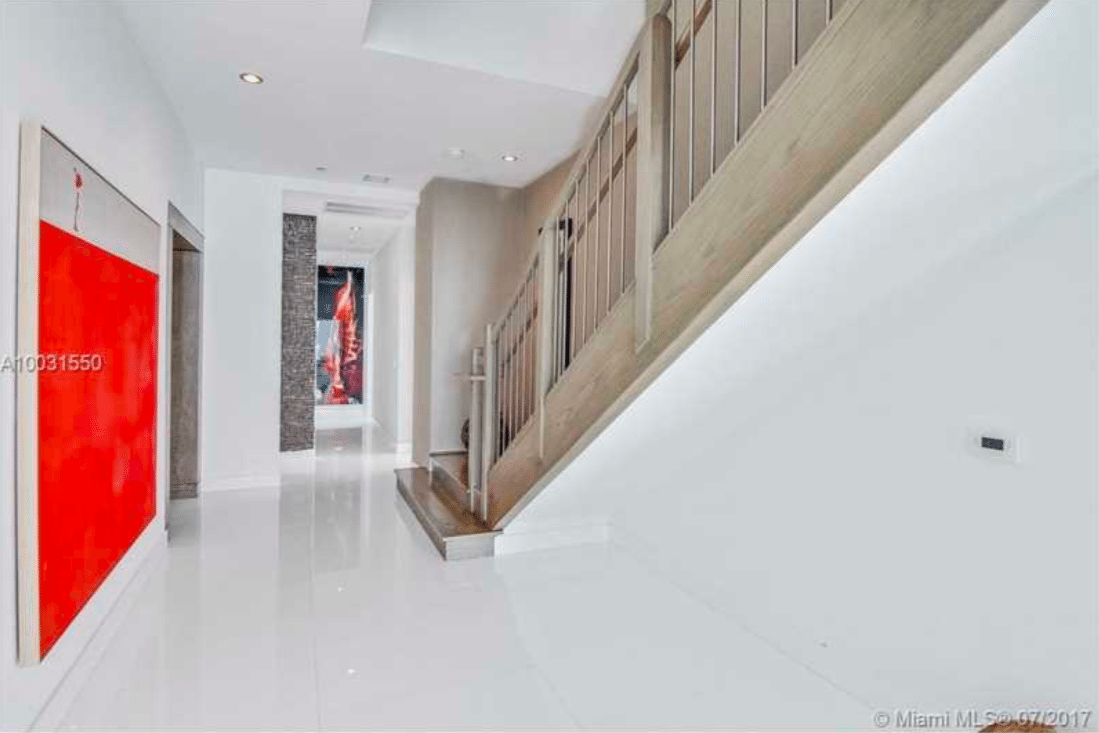
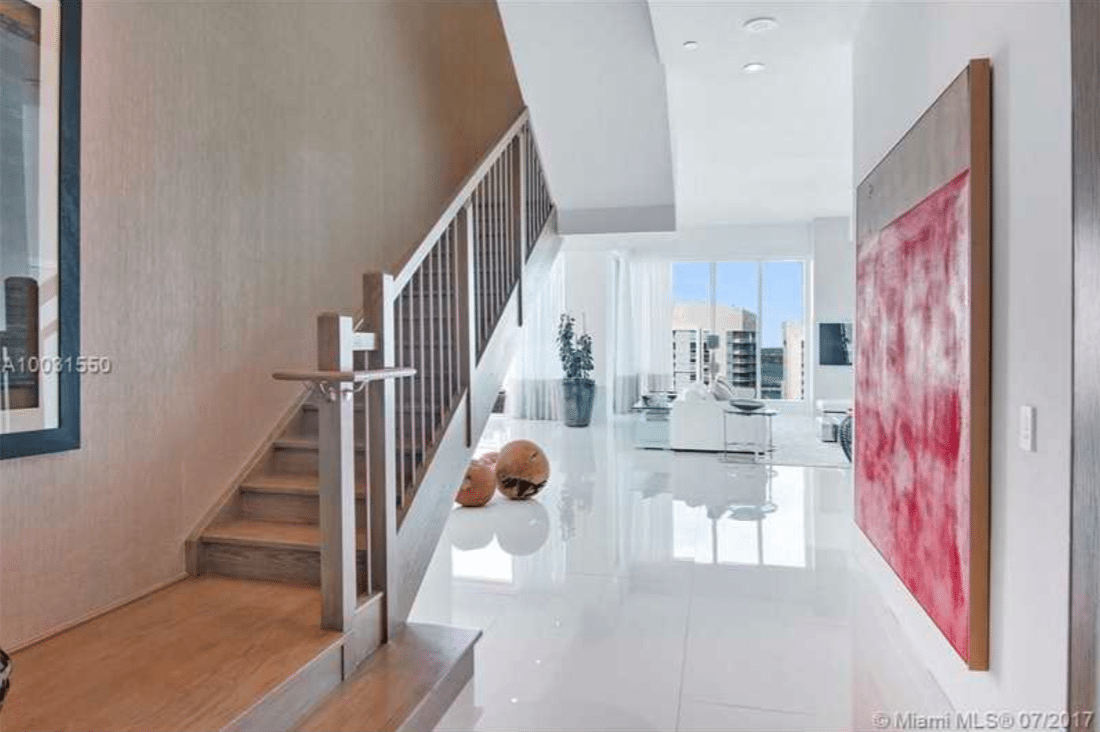
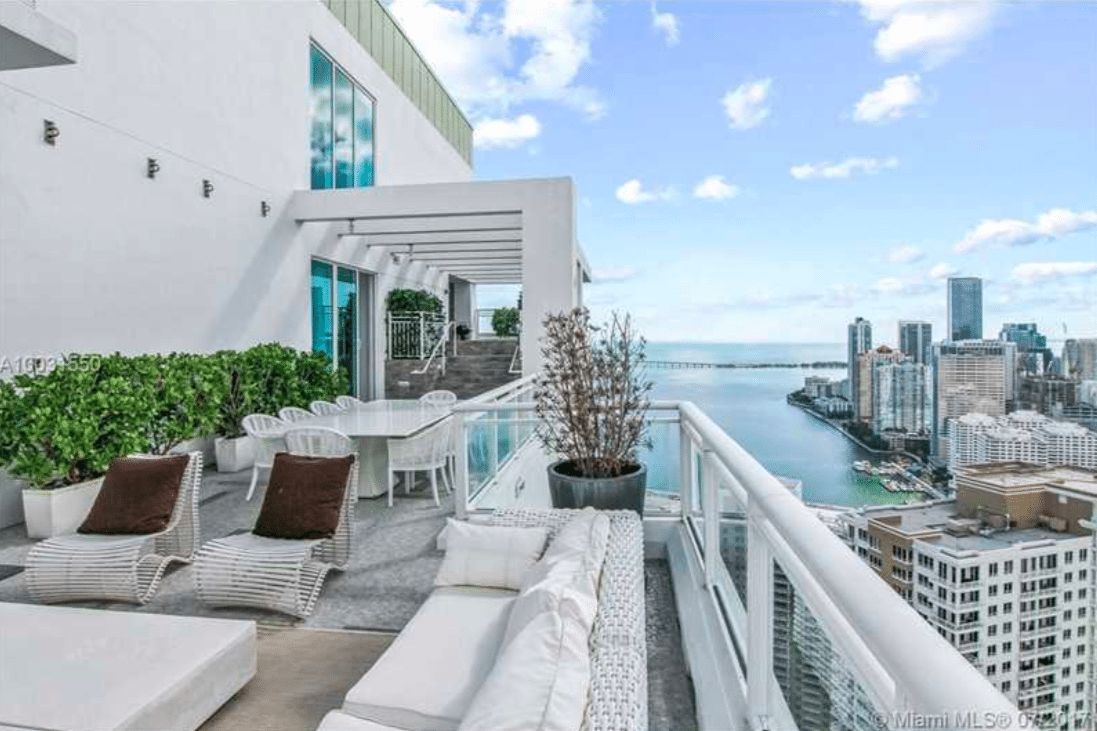
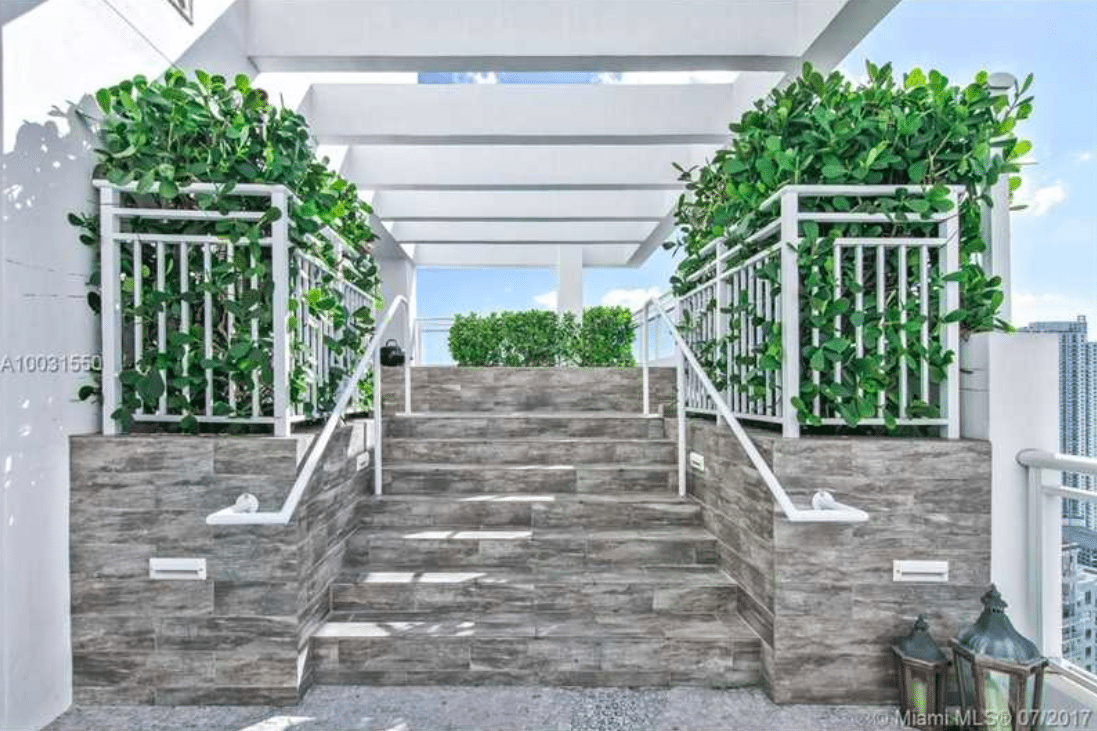
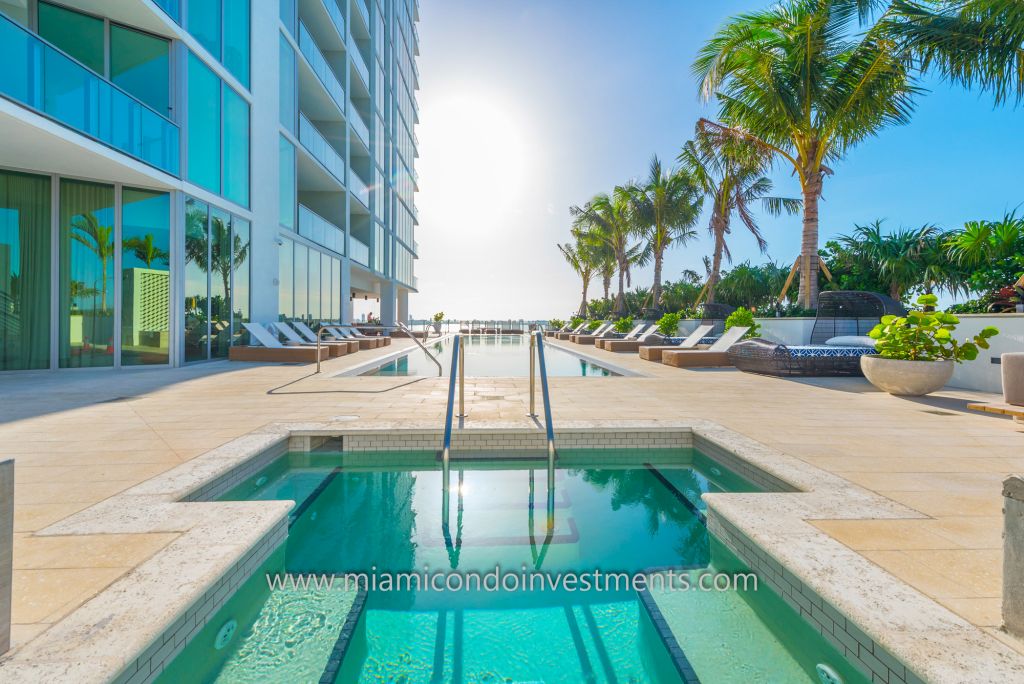
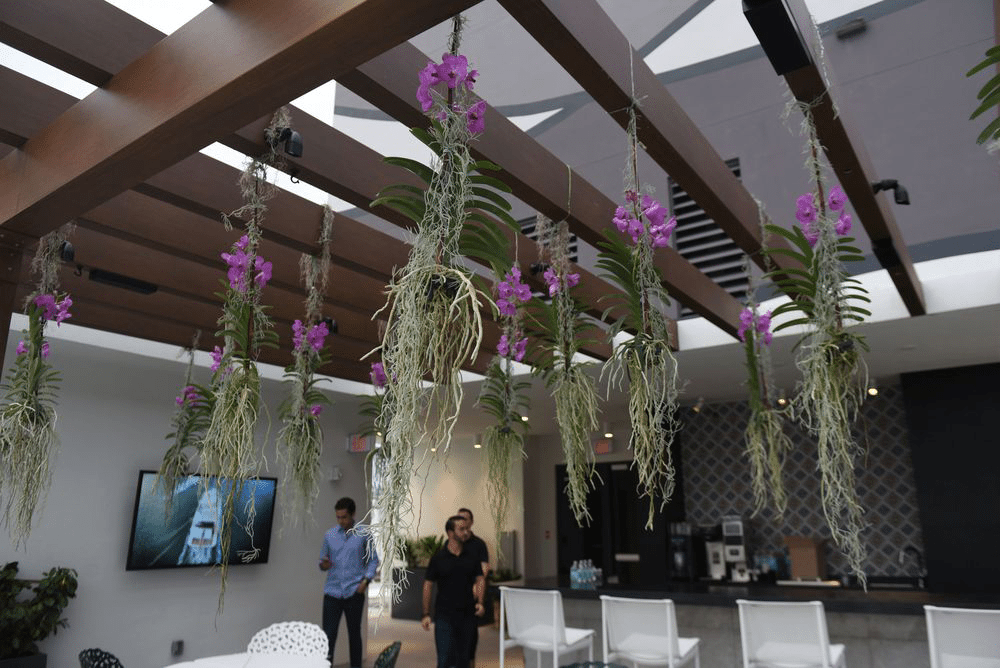
While stunning bay views, gorgeously designed interiors, and high-end finishes are bountiful at Biscayne Beach, there’s no question that its amenities are what makes this building so unique. From a family-friendly club room and children’s water feature at the impressive beach club to a residents-only amenities floor with a BBQ, tennis courts, dog walking area, and a pool; all it’s missing now is a tenant for the large, commercial restaurant space on the waterfront side of the lobby level. Check out the photos below.
If you or anyone you know has an interest in leasing or purchasing a condo at Biscayne Beach, email us at [email protected] to speak with one of our expert agents.
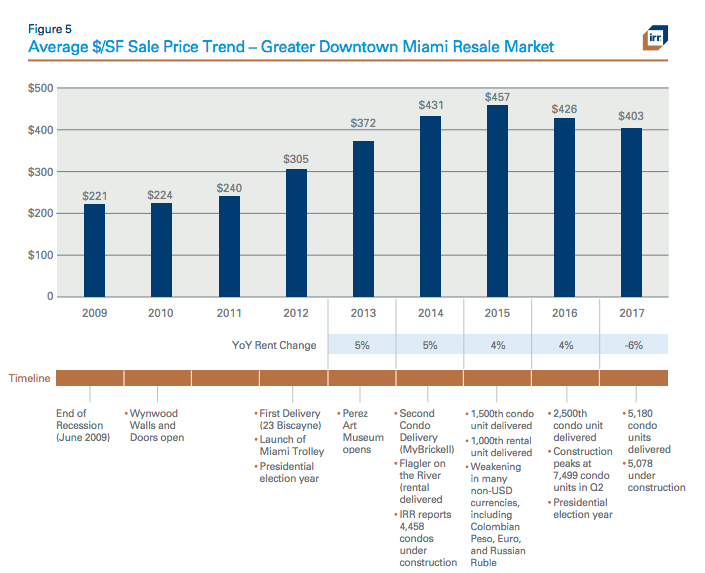
The Ultimate Market Stat Monday: Downtown Development Authority’s Mid-Year Report
Despite the fact that many media outlets and whispers in the marketplace would leave you to believe that the cards are stacked against us in the Miami condo market, things really aren’t so bad according to the Downtown Development Authority (DDA) Mid-Year 2017 Report. As they state in the report, “2017 has not been the best of times, but it hasn’t been the worst of times either.”
I have included the full 28 page report below, but also a synopsis…
RENTALS
The report separates the rental market into two sub-categories. Conventional rentals are the rental-only buildings that are all managed by one company. 2017 has brought 969 new rental units to the market, leaving just under 3,600 under construction. The condo rentals are considered shadow inventory since there is no way to tell whether a unit would be a rental, resale, or final sale until after delivery.
Amazingly, despite increased inventory, rental prices have increased slightly in conventional rental communities. I had previously been skeptical about the rental community market with so much inventory going up, but our neighborhood is very attractive and people are flocking in.
The segments of the rental market showing the biggest price gains are 1 bedrooms and 3 bedrooms, showing 3.4% and 3.6% growth since last year respectively. Studios are showing a slight decrease in price, but I suspect that this is due to the fact that tenants who would typically take a studio are now taking one bedrooms. Three bedrooms are less plentiful in the neighborhood, so are almost always a good investment opportunity.
PRE-CONSTRUCTION
The market in new developments is also hanging on. The researchers report that 2016 and 2017 YTD have garnered about 50% of the sales experienced in 2015, which experienced 25%-50% less than 2014. It’s undeniable that things have changed, but we will survive and the projects will be sold.
While the market has slowed markedly, projects that are currently under construction and 55%-60% sold do not seem to be in distress, according to the researchers.
One submarket that could flourish in the upcoming 18 months is the smaller-scale boutique project market. According to the report and our experience, these developments tend to capitalize on infill lots between the larger developments and do very well when the larger buildings slow down.
RESALES
Our resales are facing a tremendous amount of inventory with a 6% decline in overall pricing since last year. From July 2016 to June 2017 there were an average of 99 resales sold. That rate needs to be raised by an additional 500-700 listings sold per month to reach pricing equilibrium.
The conclusion of the report is that because so many new construction projects continue to be delivered and fewer projects are announced, we could see some stability in 2018 if nothing crazy happens.
Unless you’ve been living under a rock over the last two years(or outside of Miami), you have to know that Icon Brickell is undergoing an epic pool repair. How’s that coming along?
According to their management office, very well. Everything is still on schedule to see the pool fully repaired and reopened by the December 15 date they had initially anticipated. Of course, the last year has left a lot of frustration and questions for unit owners and residents, but there is finally a light at the end of the tunnel. Because of the frustration of not having a pool, coupled with the inconvenience of living in a construction zone and our over-saturated market, have people been able been able to land some amazing bargains? Not so fast…
While there are currently 167 active listings on the market for sale and 113 available for rent, the development is still seeing solid traffic. The third quarter of 2017 brought 30 new closed sales and 104 new tenants, all paying more than 90% of the asking price.
Sales
The most expensive listing to trade over the last quarter was Bay Loft 806. It was a 2 bedroom with a den and direct bay views from each room, and traded for $745,000 after having been listed for $780,000.
The least expensive transaction was a studio in the Viceroy (W Hotel) tower. It had been listed for $270,000, but traded for $250,000. One of the unique features of Tower 3 at IconBrickell is that daily rentals are allowed.
On average, buyers have given 92% of the asking price of the condos they purchased, or $442/ square foot. It also takes 233 days to sell a listing on average, but as many as 644 days. Given that there were 30 new closed sales during the quarter, that leaves us with 16 months of inventory. This really isn’t a bad number compared with the market as a whole.
Rentals
On the rental side, things move much more quickly. With 104 closed rentals and 113 available options, there is just over 3 months’ of inventory.
The least expensive rental was a studio on he 8th floor with a river view that rented for $1,675/month. The most expensive was a 3 bedroom unit with 2 baths and a big bay view that leased for $6,000/month.
On average though, the listings are trading for $2.90/square foot and take 68 days to find a new tenant. The tenants are also paying 95% of the asking price, so there are no special bargains to be had despite the pool situation.
Not bad!
Market Stat Monday: 1010 Brickell
It has now been just over six weeks since 1010 Brickell opened its doors, sending the market into the flurry of interest and curiosity we have become familiar with when the neighborhood gets a new newest building. But does 1010 live up to the hype? Let’s have a look at the market after a few weeks and see…
Closings
Although Hurricane Irma put a hold on closings for two weeks in early September, 12 buyers were able to receive keys before the storm hit. Once the storm passed, things went back to normal and a total of 84 units have closed to-date with an average price of $411/square foot, according to the tax rolls.
Resales
Of the 84 units that closed, 34 have come back to the market as resales so far. None have found buyers yet, but the asking prices are:
When shopping in 1010 Brickell, make sure to look at the floor plan of the apartment you are planning to visit prior to the tour, as I did see several units with dens that were being sold as an extra bedroom. You will want to double check that the den has actually been converted.
For potential buyers who are financing their purchase, you will be pleased to know that 1010 Brickell is one of the few buildings in the area that has Fannie Mae Approval. This will make financing much easier and less expensive.
Rentals
So far there has been only one closed rental in the building, but there are at least four that have already found tenants and are waiting for move-in day.
The rental that has already closed was a 1778 square foot 2 bedroom/3 bath apartment on the 15th floor with a private elevator, a den and a partial bay view. The landlord had listed the property for $4,000 per month and received a full price contract.
The four that are waiting to close all have city views and are listed as follows:
– A two bedroom, three bath on the 37th floor for $3,400 per month.
– A one bedroom, two bath plan with a converted den on the 14th floor for $2,875 per month.
– A one bedroom, two bath with an open den on the 15th floor for $2,700 per month.
– A 28th floor studio for $1,800 per month.
Of course, since these four have not yet closed, we do not yet know the final lease prices but I expect them to be very close to the list price since owners are not very motivated to negotiate when they are among the very first listings in a brand new building.
One surprising factor that I will continue to monitor over the coming weeks is the fact that six weeks after opening, there are only 15 available rentals in a 389 unit building. I had expected to see three times that number! It could be because the closing schedule moves at a more leisurely pace in 1010 Brickell than in Related Group’s projects like Brickell Heights or SLS Brickell. Related Group typically closes 30-40 units per week until all have closed. According to the tax roll, 1010 Brickell is closing 10-15 per week.It could also be because more buyers are moving into their apartments, rather than leasing them out. Only time will tell.
For tenants who are hoping to move to 1010 Brickell, here are the price ranges as of today.
– Studios: $1,800 per month.
– One Bedrooms: $2,150-$2,900 per month. All of these have city views, and some have dens.
– Two Bedrooms: There are currently only two available. For a city view, $3,250 per month and for a partial bay view with a private elevator, $5,000 per month.
– Three Bedrooms: $5,250 per month with a partial bay view and private elevator.
To stay up-to-date with the available inventory yourself, you can visit our 1010 Brickell Rentals page to get real-time availability.
About 1010 Brickell
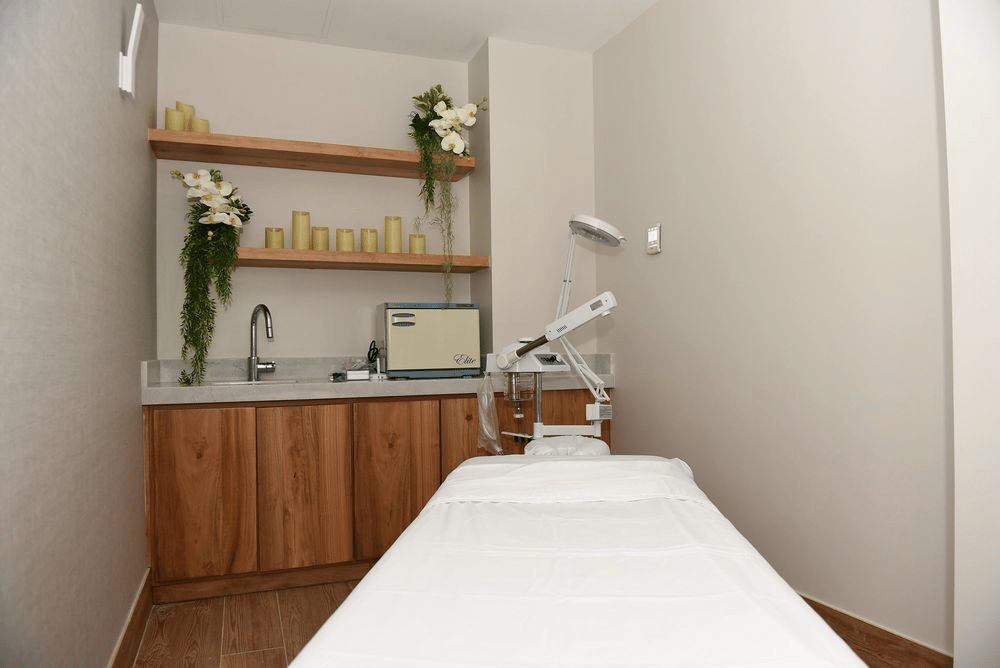
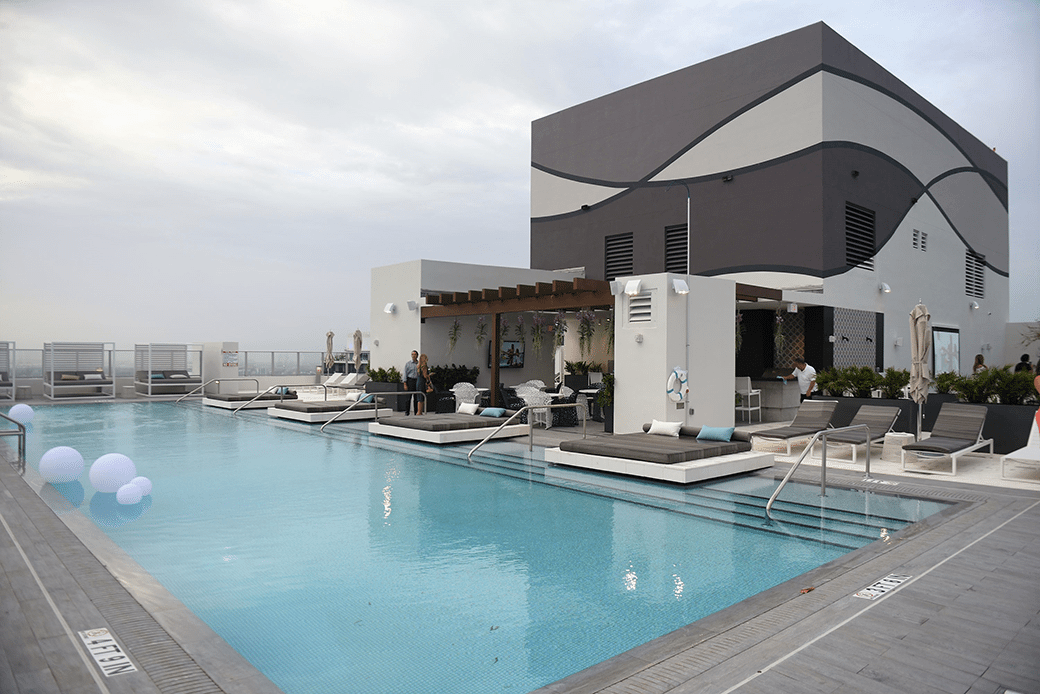
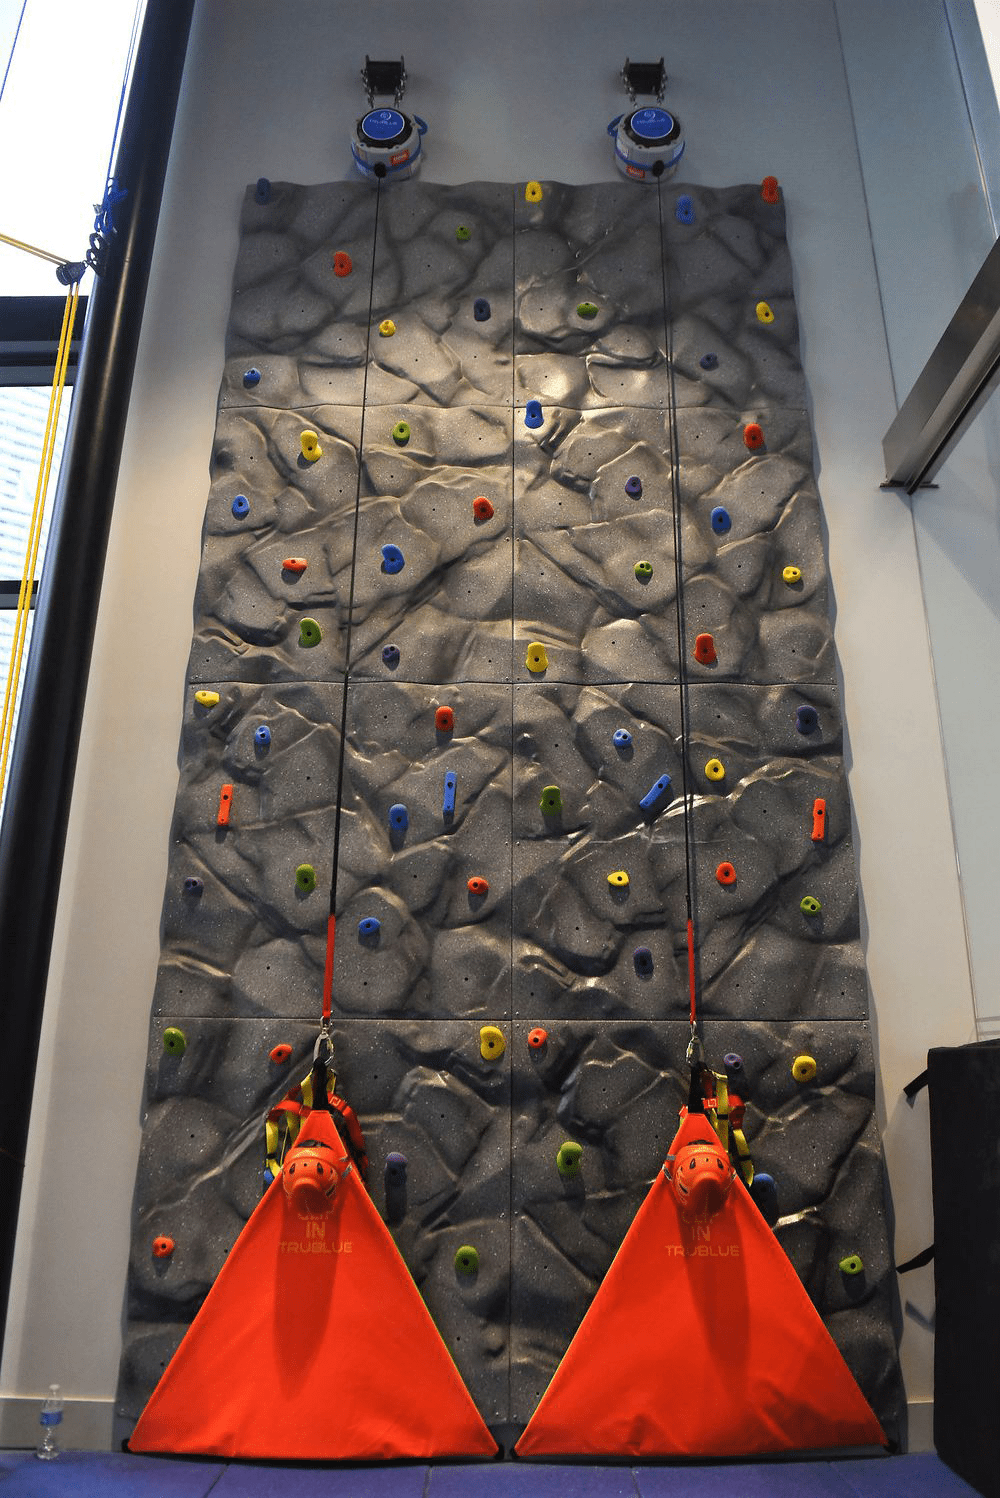
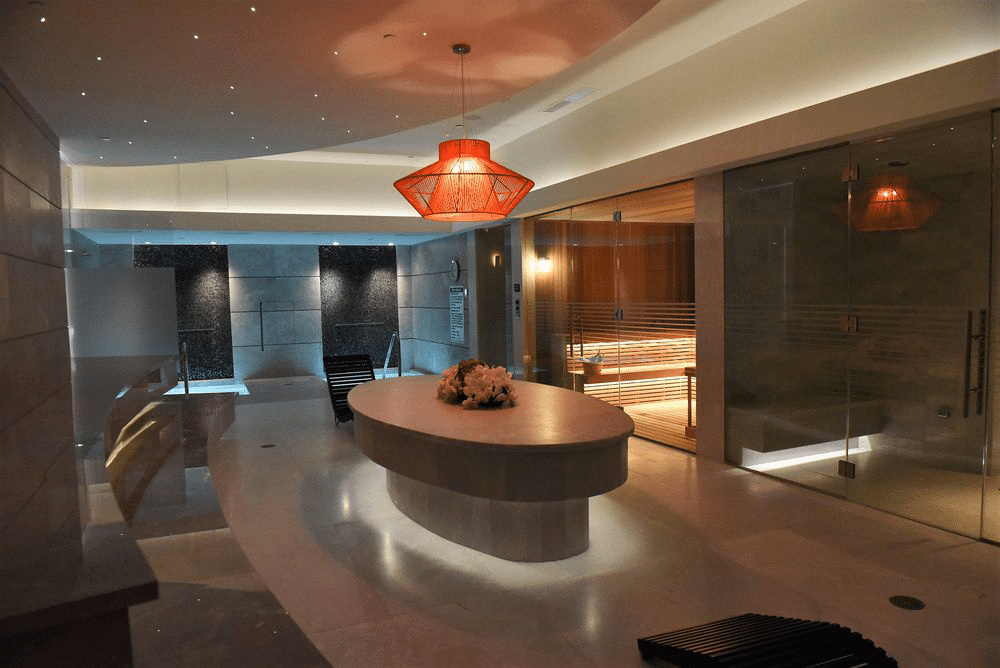
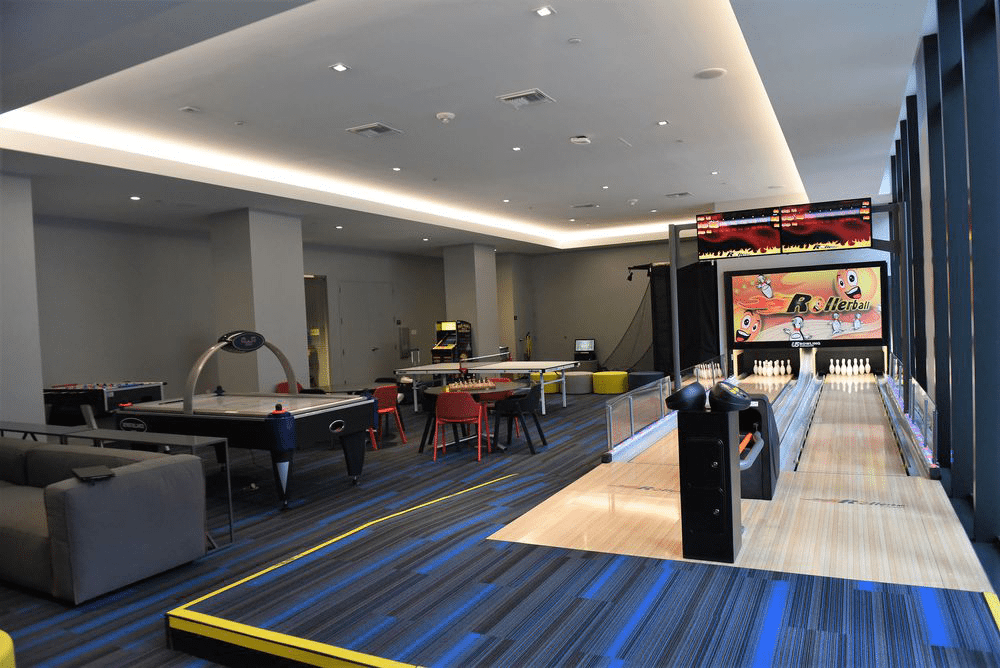
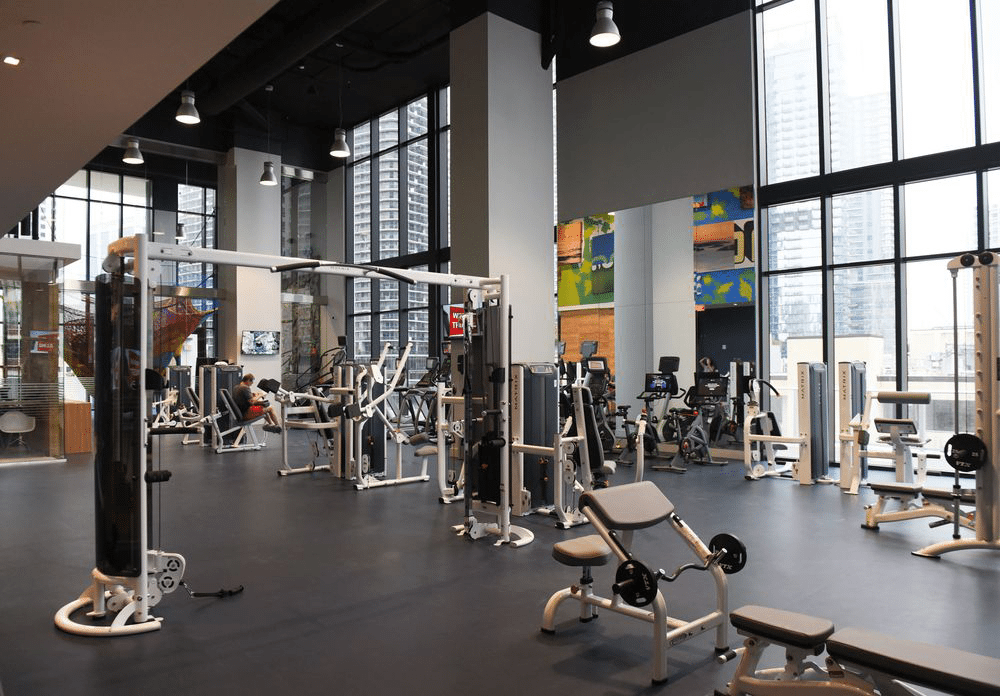
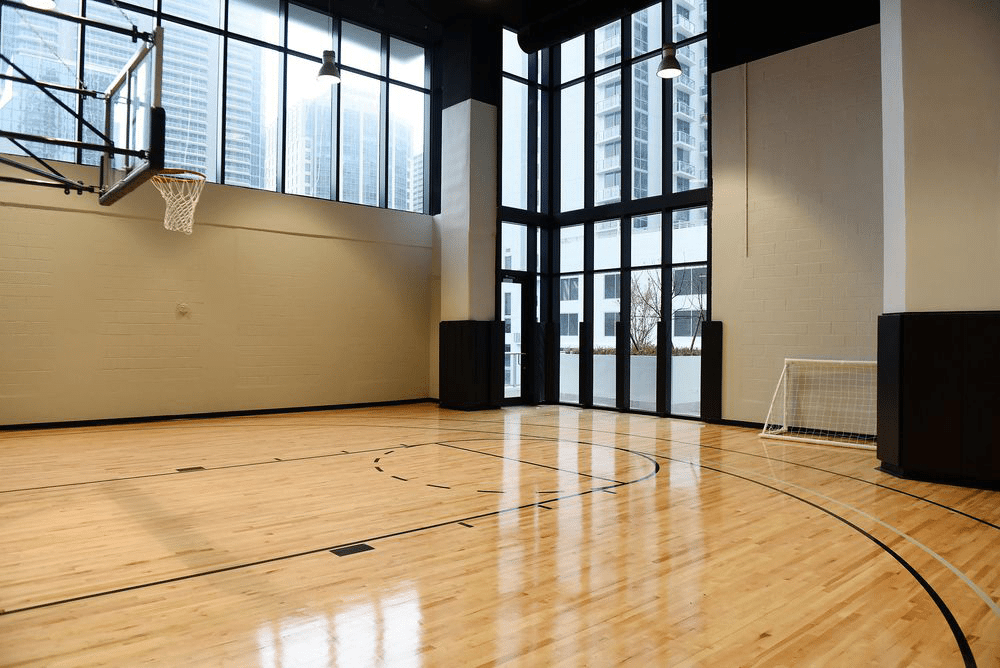
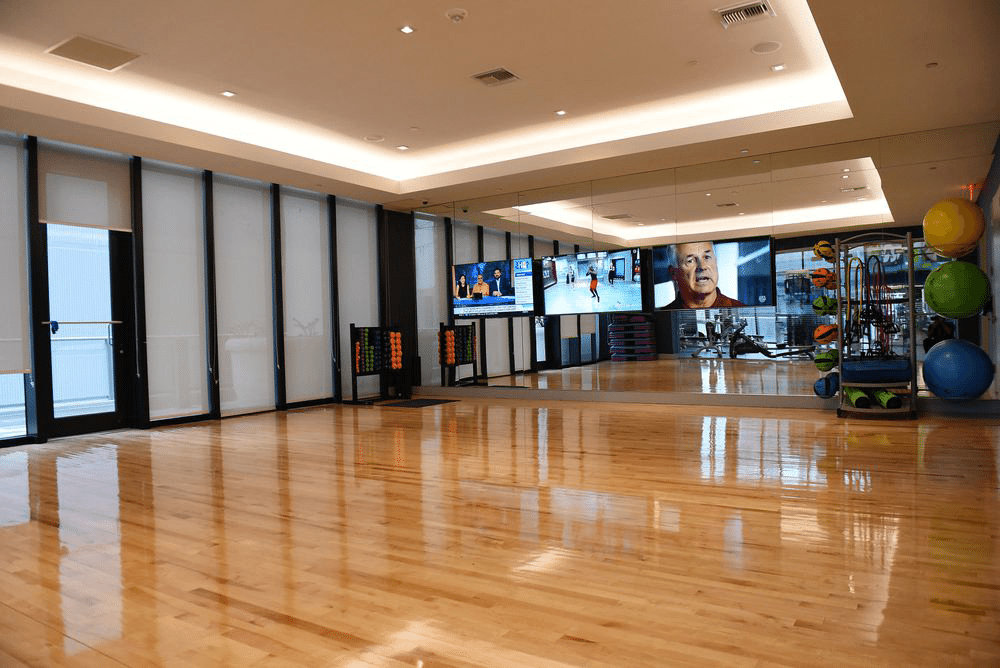
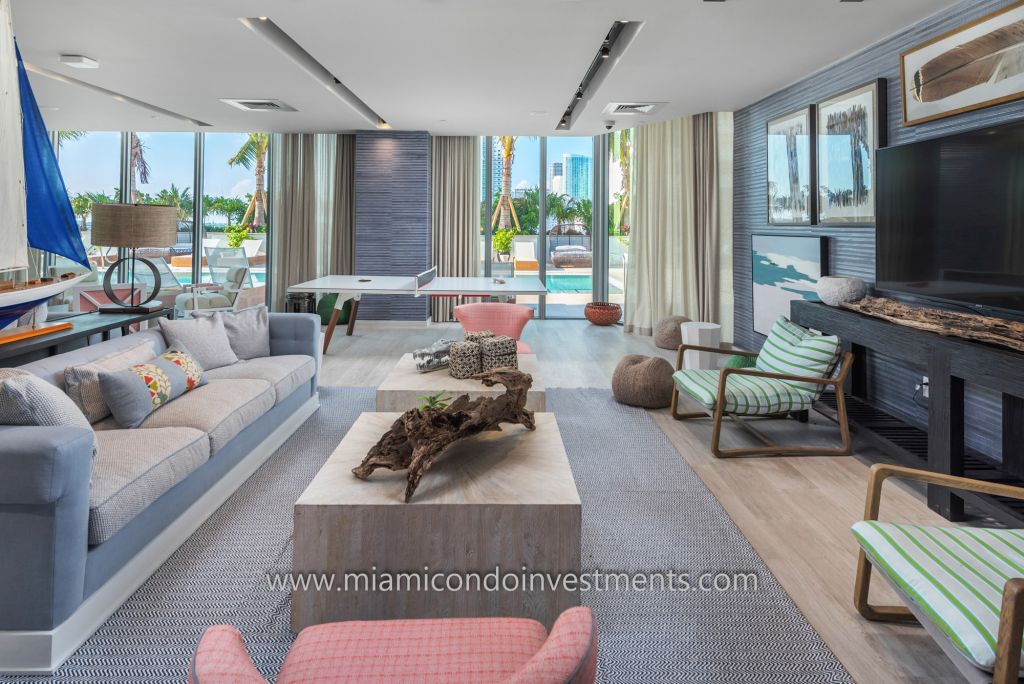
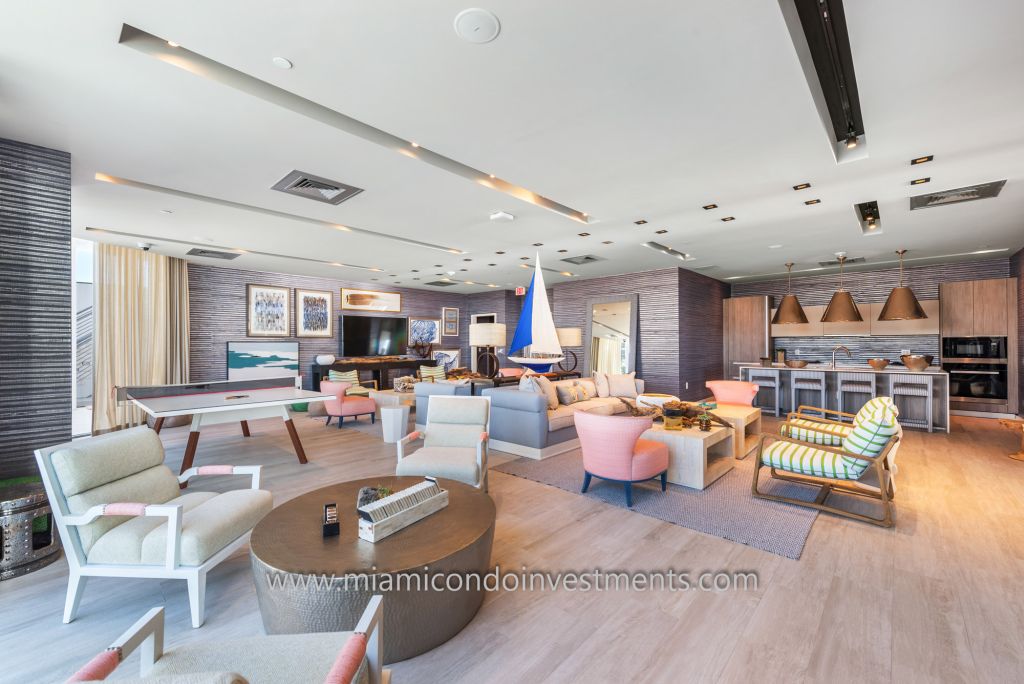
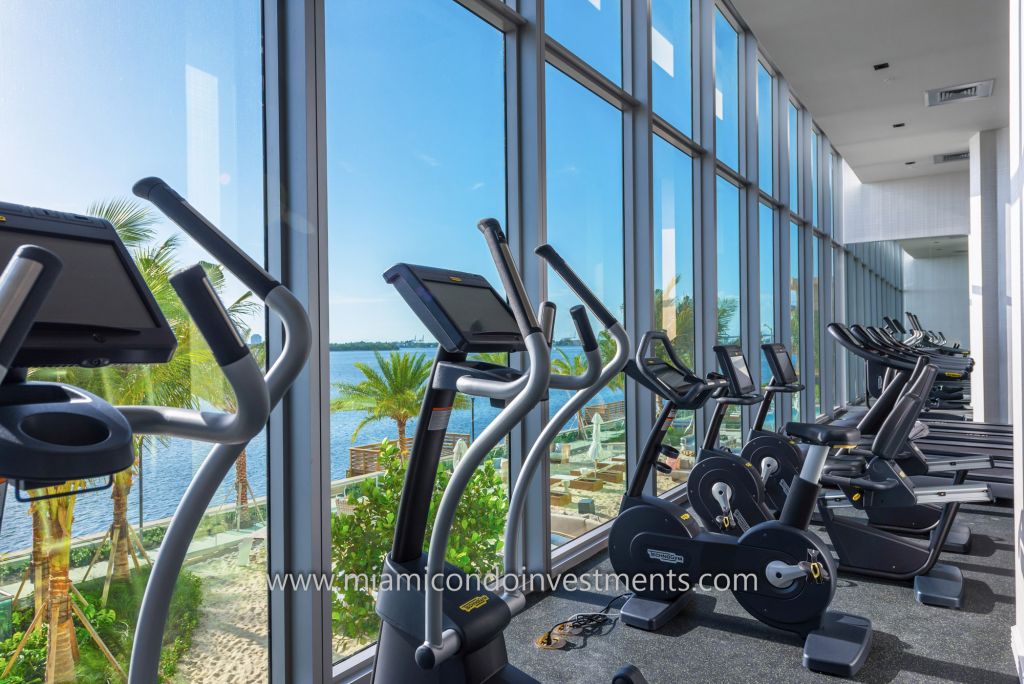
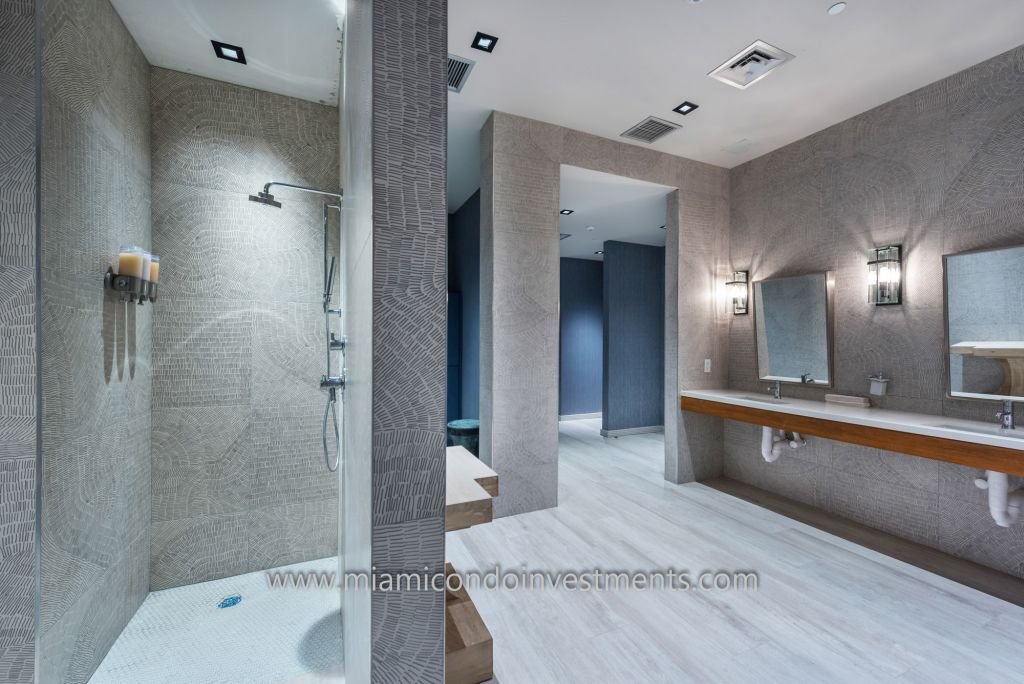
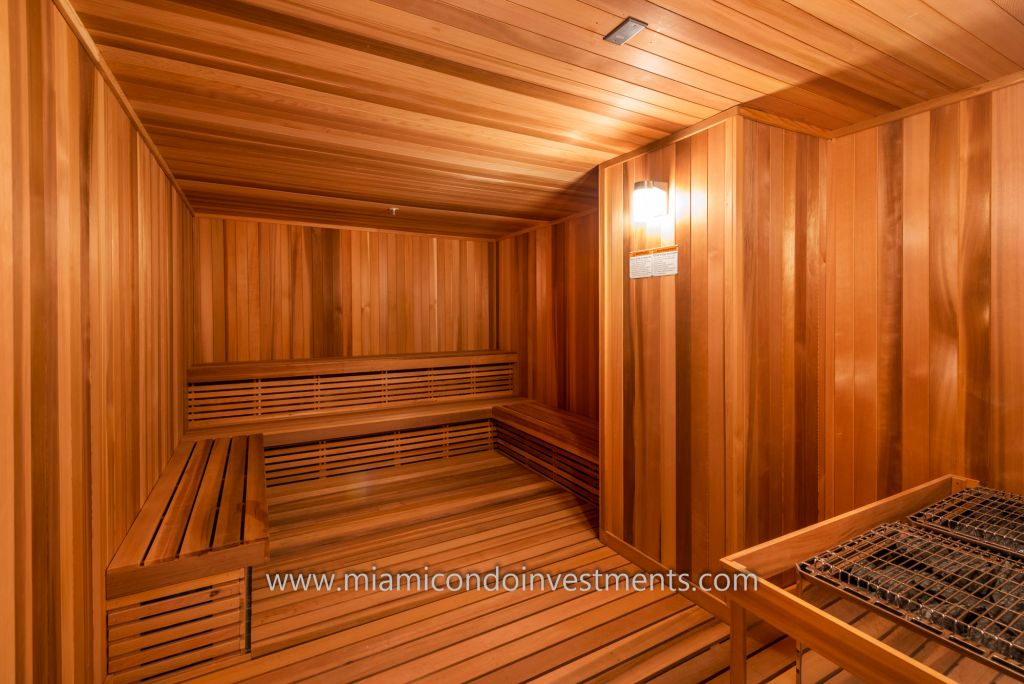
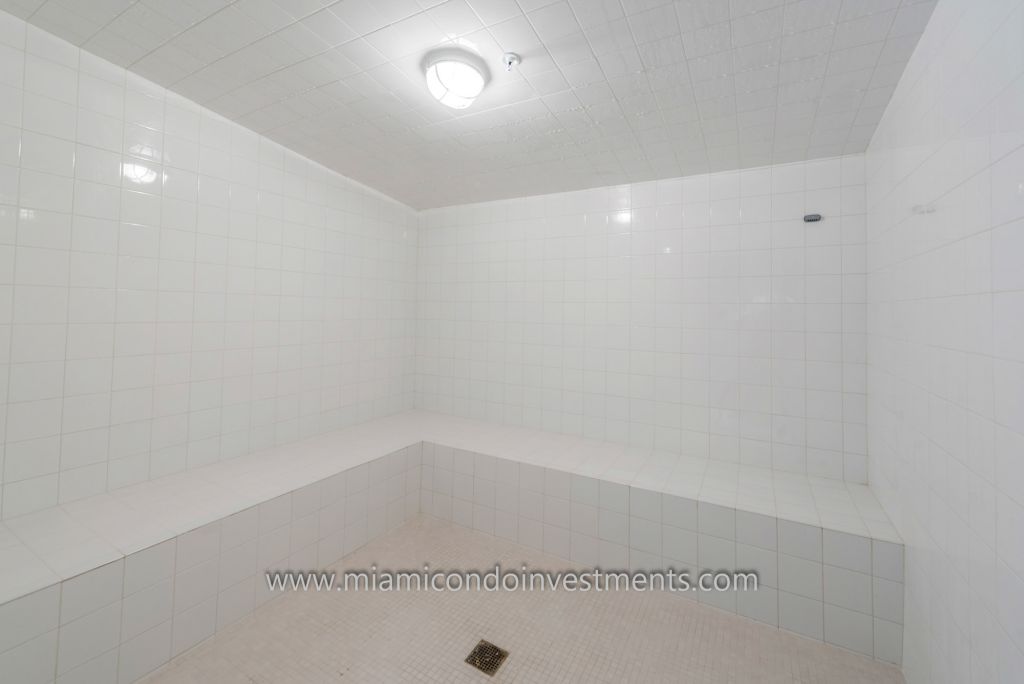
It isn’t just 1010’s status as the new newest building on the block that has the market so excited. The building also has the most expansive array of family-friendly amenities in the neighborhood, including play rooms for toddlers/little kids, climbing walls, an arcade, basketball court, bowling alley and more in addition to the expected state-of-the-art fitness center, spa, social room and hammam. Scroll through the photos below to get an idea… what do you think?
]
How Did The $1 Million+ Downtown Miami Condo Market Fare In Q3 2017?
Last week, one of our faithful readers requested more information on the million dollar-plus condo market in Greater Downtown Miami, and I had planned to make it our Market Stat Monday entry for this week, but got sidetracked with Missoni Baia’s groundbreaking and the waterfront sale on the Venetian Islands, but here we are…it’s not Monday anymore, but the stats are just as interesting.
During the time period of July 1, 2017-September 30, 2017, there were a total of 18 closed condo sales in the area that garnered at least $1 million.
The Highest Priced Sale
Marquis Residences‘ PH6301 was the overall priciest listing to sell during Q3. It is a duplex with 3 bedrooms, 3.5 baths and just over 3,800 interior square feet. After 8 months on the market (243 days), a buyer surfaced and paid $3.5 million ($913/square foot) cash. The seller had been seeking $3.745 million ($977/square foot).
The Lowest Priced Sale / Lowest Price Per Foot
The lowest priced million dollar sale of the quarter is also the lowest price per square foot, and the buyer landed a really nice deal! Pictured above, the duplex Lanai Units at The Imperial at Brickell rarely come available, and they are really quite unique! Unit 407 has 2,673 interior square feet with 4 bedrooms and 4 baths. Despite being built in 1983, the unit was recently remodeled and has close-up direct bay views from the 4th floor.
The residence had been asking $1,050,000 ($393/square foot) and received $1,000,000 cash ($374/square foot) after just 65 days of marketing.
Highest Price Per Foot
The apartment that commanded the highest price per square foot is also one of the few luxury listings that sold with conventional financing. The Four Seasons Residences #62E is a 2,738 square foot 2 bedroom with 2.5 baths, a den and sweeping bay views. It had been listed for $3.2 million ($1,169 per square foot) and sold for $3,079,999 ($1,125 per square foot) after just under 4 months on the market.
Longest Marketing Time
There is a lesson here. Brickell Key’s Three Tequesta Point 2001 took nearly 23 months to sell after numerous price reductions and the addition of commission bonuses. The seller had listed the property at $1.48 million ($629 per square foot) and finally accepted $1.3 million ($552 per square foot) after nearly two years.
The unit is quite lovely, it is a corner apartment with marble floors and lots of natural light. The building is one of the most desirable on Brickell Key, and there is an enormous terrace with huge bay views. So, what happened? The seller had decided to forego a listing agent, instead going with a flat-fee firm that only provides the MLS listing. Although clearly trying to save money by not hiring a listing agent, the sellers ended up having to pay nearly a full commission anyway and the marketing time dragged on for YEARS. A trusted, knowledgeable and hard working agent is worth every nickel of their commission and could have certainly gotten the job done in a fraction of the time, probably garnering more profit as well.
Shortest Marketing Time
Jade Residences at Brickell Bay was by far the most popular building of the million-dollar-plus price point during Q3, giving us 7 of the 18 closed sales in the entire Greater Downtown Miami area (Brickell to Midtown/Edgewater). It also gave us unit 2911, which sold after just 32 days on the market. The unit is a beautiful 1,878 square foot corner unit that has Southeast exposure and a large open terrace. There are 2 bedrooms, 2.5 baths, and marble floors throughout. The seller had asked $1.55 million ($825 per square foot) and received a cash deal of $1.395 million ($743 per square foot).
Averages
The 18 listings that sold were asking an average of $744 per square foot and received an average of $690 per square foot after 154 days of marketing time. Sellers are tending to accept 93% of their asking price.
In Conclusion
While these beautiful condos all found buyers over the last few months, it is also important to do a competition analysis before listing property in order to achieve the best results. Looking at the closing rate over the last 3 months compared with the 488 other properties that are listed for at least $1 million (nearly SEVEN years’ of inventory), it is important to single your property out as unique and hire an agent with superior marketing and negotiation capabilities in order to achieve optimal results.
Market Stat Monday: Almost $50 Million In Contracts Signed Post-Irma
It has been a few weeks now since the skies have cleared in Greater Downtown Miami after Hurricane Irma’s brush, and despite a little bit of flooding and debris, we were very lucky. Now that cleanup is under way, how have the condo sales fared?
Not too bad, if I must say. Despite having only two functional weeks in September, nearly $50 million in resale contracts were signed on 79 total units.
The least expensive listing to find a buyer was at the Loft II Downtown, where a 770 square foot one bedroom was listed for $175,000. Of the 79 units that went to contract, 50 of them were listed for under $500,000. We will find out the final sales prices once they close.
In the luxury segment, there were a total of 6 properties listed over $1 million that found buyers. Among them was the crown jewel penthouse #1 at Asia on Brickell Key. With nearly 5,000 interior square feet through three levels including a dramatic rooftop terrace with a private pool, the sellers had asked $8.5 million, or $1,715/square foot.
Comparing September of 2017 to September of 2016, you will see that 2016 brought both a higher number of transactions as well as a higher volume of listings sold, but not enough to make it an overall better month considering that September 2017 was short due to people being distracted by the hurricane and Hurricane Matthew didn’t brush South Florida until October of last year. September of 2016 brought just over $60 million of listings sold, with 119 total transactions.
To celebrate the end of a successful yet stressful September, let’s check out some photos of that Asia Penthouse!
Market Stat Monday: How Is The Rental Market At Brickell Heights?
It has now been almost 3 months since this photo was taken, just as Brickell Heights was preparing to open. The closings have gone down at a harried pace, Equinox is open and buzzing with activity and moving trucks are filling the loading docks daily. The project was a resounding success for The Related Group, and it is too soon to tell how the resale market will fare, but we have had enough time and activity to check the pulse of the rental market.
Between the active/available rental options, the ones whose tenants have already moved in and the ones whose tenants are awaiting association approval, it appears that 99 of the tower’s 358 units are operating as rentals. That amounts to 28% of the building as of today, not bad! I’ve come to expect to see an investor ratio of 60%-75% in most of the Brickell condo towers, after seeing the condo questionnaires that banks use to determine financing availability.
In the last 3 months, 26 landlords have moved their tenants in and have accepted $2.73 per square foot on average. One bedrooms range from $2,000 per month up to $2,750 per month, and two bedrooms are renting for $3,000 per month up to $3,900 per month. Nine units are currently pending, but I expect to see the final pricing stay in line with the previous numbers.
With 64 active/available listings, it looks like we’re operating with right about 2 months of inventory (great news!). The pricing of the available options is also more or less in line with the rented units. One bedrooms are available for between $2,000 per month up to $3,000 per month, two bedrooms range from $2,700 to $3,700 per month and three bedrooms are between $5,500 to $5,950 per month (there are only two of these currently available).
Just as we have seen in past buildings, the landlords are not budging much on their pricing. The ones who already rented their units did so for an average of 97% of their asking price.
Originally slated to be a rental-only tower that turned back into a condo tower when the pre-construction market took off, the West tower is still shaping up to be mainly rentals. There are currently 90 available units for lease, ranging in price from $1,950-$3,000 for one bedrooms, $2,800-$4,500 for two bedrooms and $4,950-$5,250 for three bedrooms.
Aside from those 90 available listings, 16 have rented and 26 more are awaiting association approval. With that many pending leases, I imagine there is quite a bit of backlog in the management office. For the next couple of months, it is probably a good idea to lease here only if you have a flexible move-in date or 3+weeks to wait for approval. Otherwise, you could find yourself in a hotel while you wait for approval.
The 16 units that did rent garnered 96% of their asking price and range from $1,950-$2,200 per month for one bedrooms and $2,700-$3,250/month for two bedrooms. The tenants are paying $2.66/square foot on average.
Looking Ahead
It will be interesting to see what happens over the next few months at Brickell Heights with the new competition from Solitaire and Panorama Tower, both of which are slated to open soon. Do you think the prices will dip a bit during the wave of inventory of the first lease-up and then level off at a higher value due to continued demand and less inventory like SLS Brickell, or do you think Panorama Tower and Solitaire’s wave of inventory will hold the prices lower?
After digging into the numbers, I’m really starting to see some solid trends among these new buildings. The developer made off flush, closing on all but a handful of the units for an average of $587/square foot, or $183 million as reported by The Real Deal. Nearly 80% (77% to be exact) of the pre-construction buyers are now either trying to sell or lease their properties, and nobody has claimed their homestead exemption.
Looking at the resale market, the outlook is pretty grim (but don’t get worked up, the rental market is better, just scroll down if you’re looking for rosy news). There are currently 68 active listings for sale, and only 2 have sold on the resale market so far. The MLS shows 6 total sales, but 4 of them were developer sales. If you figure the months of inventory based upon all closed sales combined, there are 91 months of inventory. If you only consider the true resales, that number jumps to 272 months of inventory! Either way you figure it, that is far more inventory than we’ve seen so far.
Of the apartments that did sell, again we are seeing that the sellers are not budging far in their negotiations. The developer sold their 4 listed apartments at an average discount of 4% and garnered $595/square foot. Open-market resales received 94% of their listing price with an average of $499/square foot. Although both investors garnered far less for their units than the developer, that’s not to say they both lost money.
Apartment 2508
– Originally purchased in September 2016 for $742,900. If you figure a 1.5% developer fee, that nets a $754,000 buy-in.
– The property resold in April 2017 for$620,000. If you figure the seller paid the standard 6% commission, they netted $582,800 in the sale.
– The overall investment lost the investor $171,200 (unless there are hidden factors that we can’t pull from the MLS and tax roll).
Apartment 2101
– Originally purchased in August of 2016 for $527,900, netting $535,800 after assuming the 1.5% developer fee.
– The property sold in May of 2017 for $595,000. Assuming the 6% commission, the net sale was $559,300.
– This transaction left the investor a $23,500 gain, or a little more than 4%.
Final Thoughts
Am I saying that purchasing in The Bond on Brickell is a bad idea? Absolutely not. The building turned out very nicely, with high quality finishes and thoughtfully chosen amenities. Rilea Group was also smart to purchase the air rights over the small office building next door. I see it as SLS Brickell’s not-so-garish cousin. If that is your taste, then it is a great time to get a great deal and a lovely home for years to come, just don’t buy in thinking you can flip the property for a hefty profit, because you will be disappointed.
Now it is time for the good news. The rental market is very stable, with only 20 active listings currently. The building has been leasing up at an average of 18 units per month (142 for the year so far), leaving just over 1 month of inventory for tenants to choose from.
Despite the low inventory today, the average days on market is listed as 64 days. It is common to see new buildings offer a glut of inventory shortly after the investors close on their units. Everyone wants to find a tenant and fast. The lease prices drop for awhile until the majority of that inventory is absorbed and then the prices and days on market stabilize.
This trend is evident in the rental history of The Bond over the last year. Studios have leased for as little as $1,350/month during times of high inventory, but now command between $1,900-$2,350/month. One bedrooms have been as low as $1,800/month, but now are leasing between $2,300-$3,250. Two bedrooms were as low as $2,400/month but now are $3,300-$4,500. Three bedrooms were once $4,200/month, but the only one available today is $6,500.
This is not the time for opportunistic tenants to try and over-negotiate lease prices. There is very little on the market and the landlords are only negotiating to 94% of their asking price… not a huge drop.
So, while the resale market is pretty bleak, the landlords and owner/occupants in The Bond are poised for success!


 ]
]