Brickell Investor Opportunity: 2 Bedroom Under $500k

From time to time we like to talk about deals that we see that are particularly interesting for one reason or another and this is a very interesting investment deal Brickell condo investments typically see around a 3 return for existing purchases after expenses such as taxes and homeowners fees are subtracted and 2 bedroom properties under $500000 are becoming more and more difficult to find
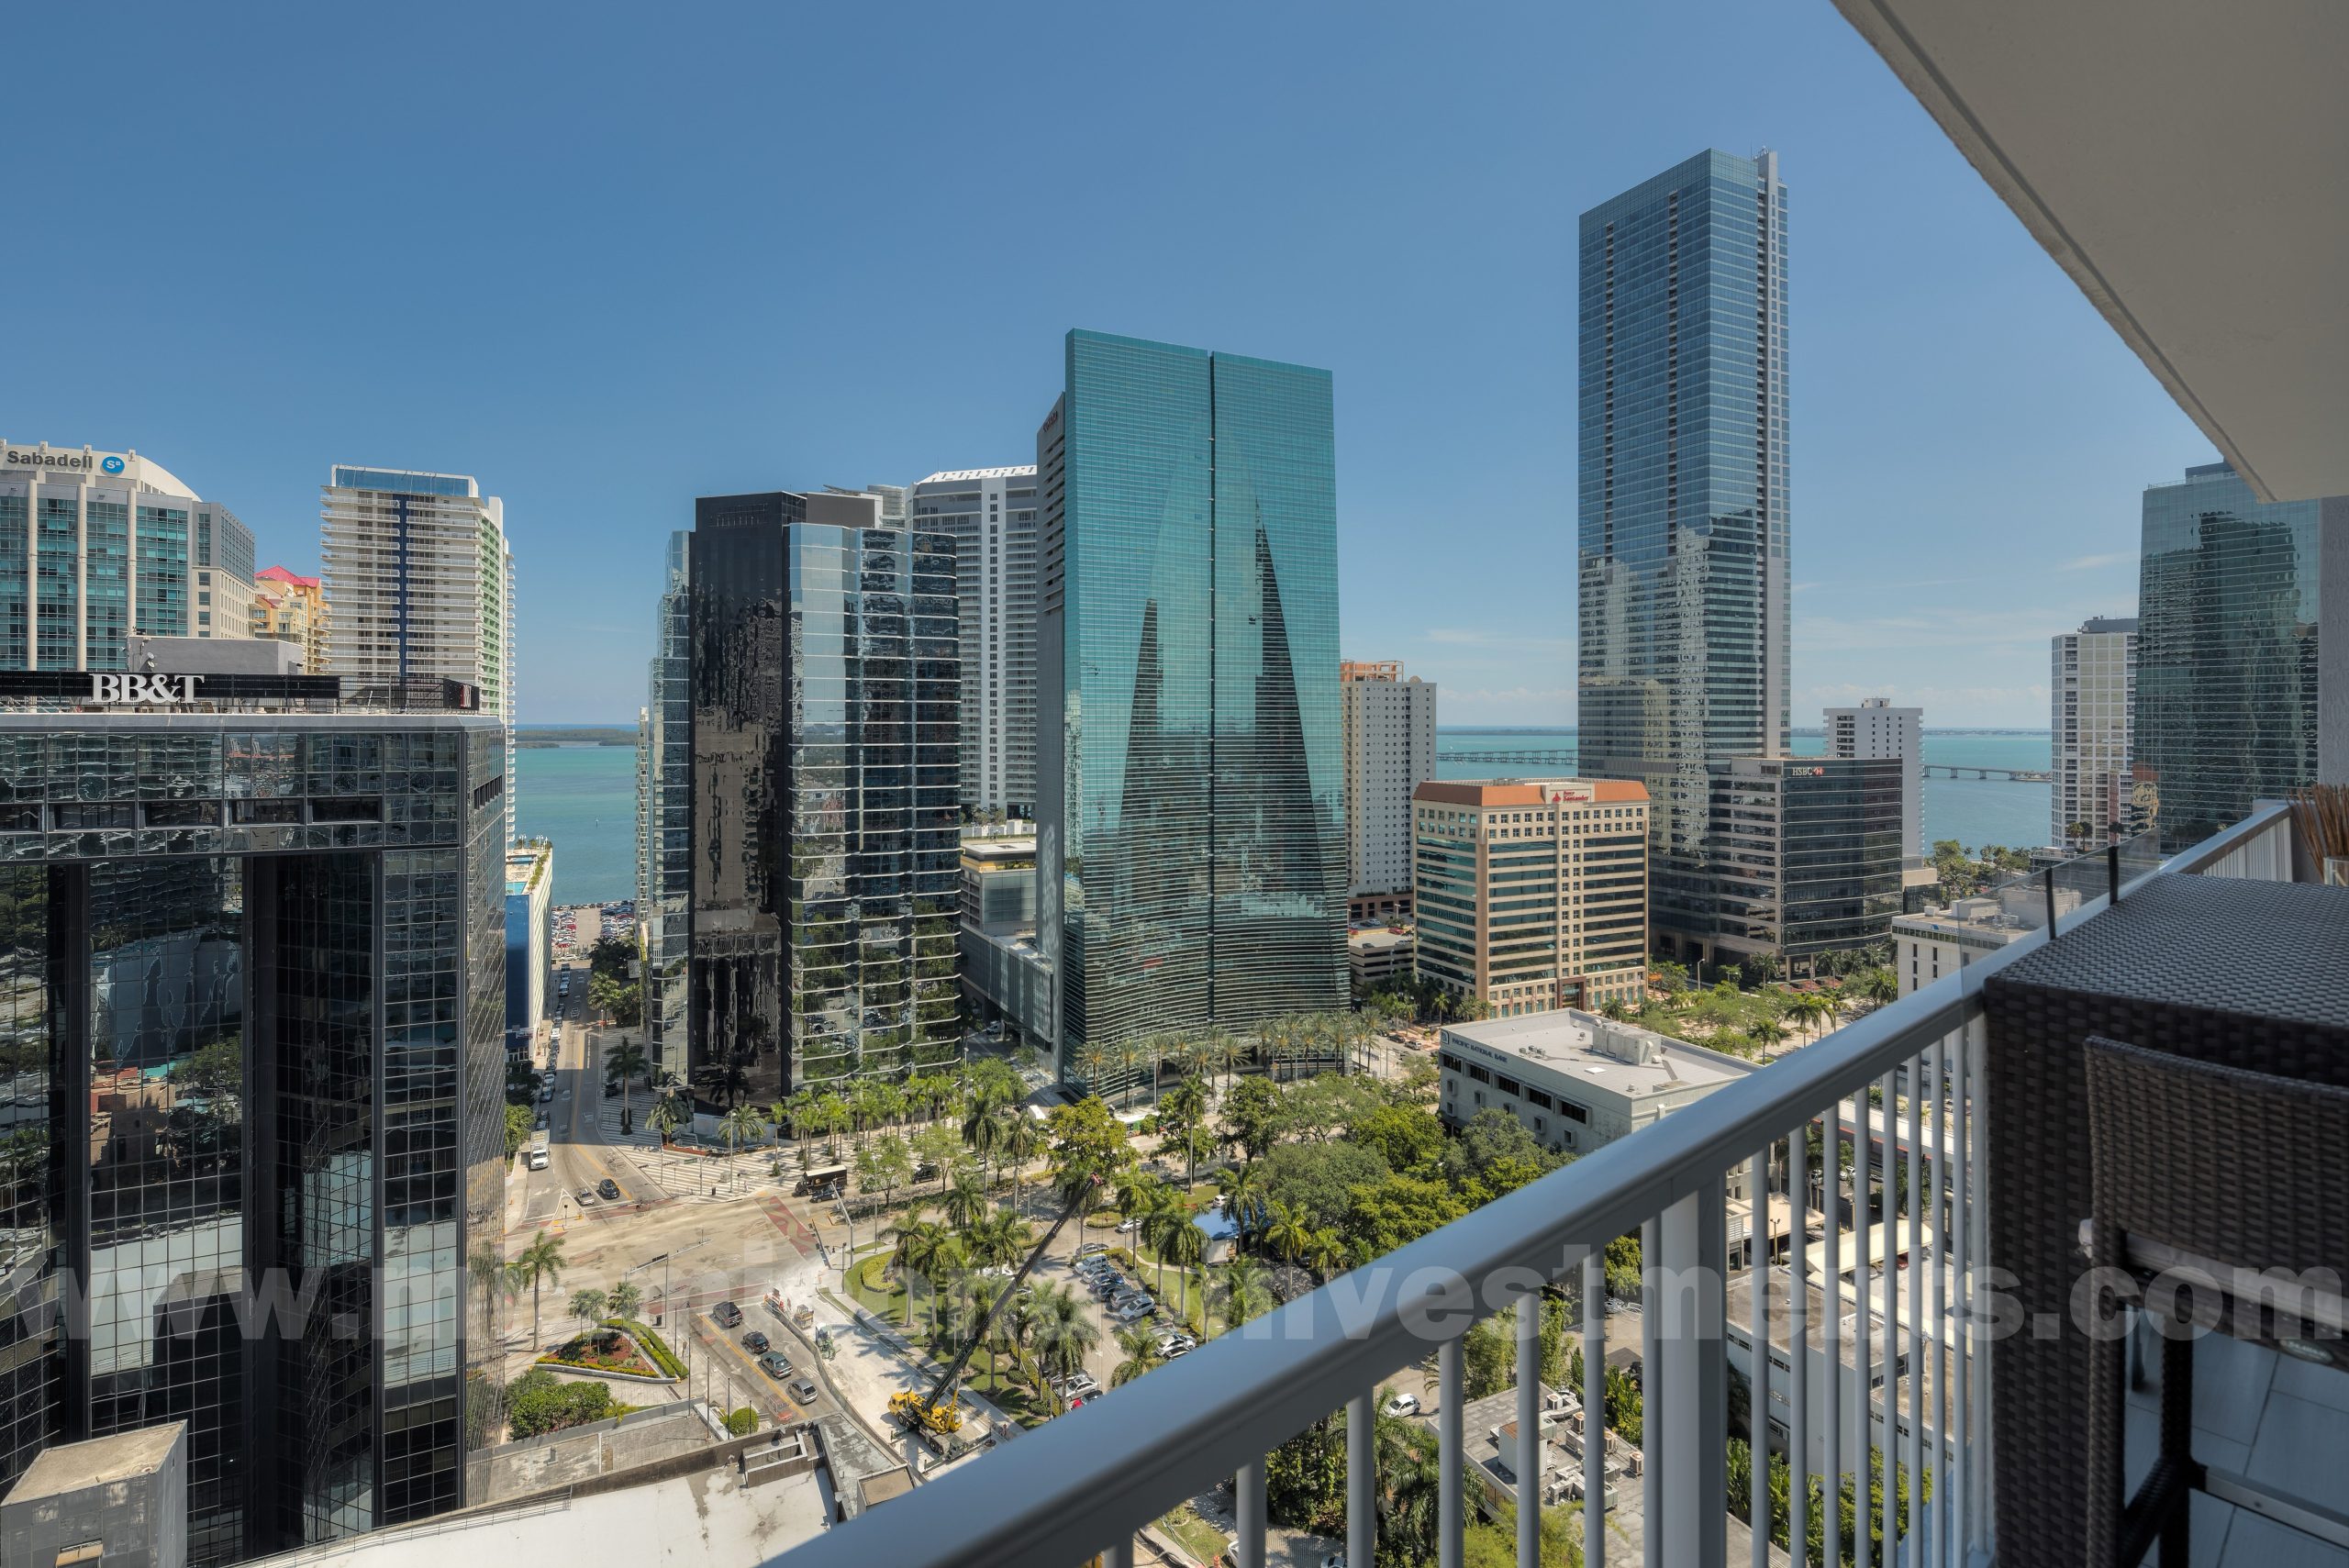
This listing at the Vue at Brickell is a standout in our book at only $449000 with two parking spaces full renovations and fully furnished The building is located at 1250 S Miami Avenue so is walking distance to practically everything in Brickell the official walk score by walkscorecom is listed as 97 Despite being able to walk almost everywhere this apartment comes with 2 parking spaces rather than the typical single space The building was built in 2005 and was recently renovated offering a new lobby refreshed gym and pool area The condo management is in good standing managing to keep the HOA fees at only $675month which is significantly lower than competing buildings in the neighborhood
Inside the apartment the kitchen and bathrooms have been updated and the apartment is being offered turnkey furnished linens artwork and electronics included The kitchen offers new stainless appliances including a wine cooler as well as quartz countertops and new cabinets Both bathrooms have new vanities countertops sinks and light fixtures The balcony has a wonderful view of the city lights as well as the Biscayne Bay
Considering this apartment were to be rented today an investor could reasonably expect $2800month in income If you reduce the real estate taxes and HOA fees it would leave a return of 45 as soon as the tenant takes place If you or someone you know is interested just reach out and we are happy to set up a tour


HUD Promises Easier FHA Financing for Condos

For years we have seen hopeful condo buyers, armed with pre-approval letters become frustrated with the financing process and give up or learn that their pre-approval letters are only valid in certain condo developments. The reality is that in order to purchase a condo, two approvals must happen.
First, the buyer must prove financially able to commit to the mortgage payment by submitting their credit and income details to the bank for review. Secondly, the condo development they wish to purchase in must also be approved by the financial institution.
FHA loans are very popular among buyers because of their less stringent qualification guidelines and because of the lower down payment requirements. In order for a building to become FHA approved, they must submit an application to the US Department of Housing and Urban Development (HUD), pay an application fee, and wait for 60-90 days for an answer. The application is long and cumbersome, the fee is high, and few buildings are approved. This has led to a diminishing number of buildings who are even willing to try for the approval.
For example, the current 95 page application has been submitted by 48 buildings in Miami Beach & Downtown Miami. Of those 48, only 2 buildings meet all of the criteria and have been awarded FHA approval.
If you are a buyer today with an FHA pre-approval, you would be able to purchase a condo in Brickell on the River North or Brickell on the River South. This remains to be the case no matter what your credit score is, how secure and high paying your job may be or how responsible you are. Those would be the two buildings you could choose from. You would be able to use the pre-approval letter to purchase a house, but those are the only two condo buildings that allow FHA mortgages currently.
At this year’s NAR conference in San Diego, an announcement was made by the Federal Housing Administration that changes are underway to the approval guidelines, making FHA mortgage more accessible to condo buyers going forward. Among these changes are restrictions on owner occupancy versus investor owners, commercial space percentage, FHA concentration and spot approvals. We commend NAR and HUD for their efforts in making home ownership more accessible and look forward to seeing the specifics of the changes.
In the meantime, if you are a condo buyer who prefers a lower down payment, there are loan programs in some buildings that allow for less than the standard 20% down payment and are happy to answer questions you may have about financing in condos.
Miami & Miami Beach Condo Supply Down Sharply
Thanks in large part to a strong interest from international buyers, the South Florida condo market has fared extremely well over the past year despite global economic worries. One would assume that the supply of condos has shrunk as a result, but to what extent? Is the condo inventory problem finally a thing of the past? Does the current supply of condos indicate a transition from a buyer’s market to that of a seller’s market? The condo inventory and sales figures below should shed light on the subject to help answer these questions.
The figures below were compiled on August 31, 2011. Three sets of spreadsheets and graphs can be found below. The first pertains to the inventory and sales figures for condos throughout Miami-Dade County. The second focuses on those located only in Miami while the third set concentrates on condos residing only in Miami Beach.
I grouped the number of available condos into seven distinct price ranges and provided total closed sales figures over the past six months for each. Columns three, four and five display figures for average closed sales per month, months of supply and years of supply, respectively. The last three columns show the percentage change in those figures when compared to those published slightly over 16 months earlier in April 2010.
As you will see, there is currently a little over 6 months worth of condos for sale throughout Miami-Dade County. Obviously, the supply figures vary within each price range and again when looking at the figures specific to Miami and Miami Beach. It is important to note that the figures below only include resales listed on the MLS. Developer inventory and closed sales are not included. My guess is that the statistics would be even more compelling had those figures been included. To put things into perspective, I recently heard that Icon Brickell had been averaging around 60 closed sales per month. With 1,796 total units, Icon Brickell had been the poster child of the oversupply problem in Miami. Icon Brickell currently has less than 100 available condos for sale. Word on the street is that sales for condos at Paramount Bay will launch later this month. Once it does, Paramount Bay will be the last of the recently constructed condo developments to hit the market and will add just 350 total units. Many of those condos have already been secured by original contract holders and interest from potential buyers for the remaining units is staggering. A shortage of condos in Miami is an almost certain problem that lurks on the horizon. Keep in mind, even if new condo developments were planned and approved tomorrow, it would be another 3-5 years for those condos to be completed and delivered.
Below, you will find the Miami-Dade County condo supply and sales figures for August 2011:


The following statistics encompass only those condos located throughout Miami (not other areas of Dade County such as Miami Beach, Aventura, Sunny Isles Beach, etc.):


The following statistics encompass only those condos located throughout Miami Beach:


developer inventory
Miami & Miami Beach Condo Trends – April 2010
They say numbers don’t lie. If that be the case, one message of truth shines through in the inventory figures below when compared to the ones I calculated exactly nine months earlier for Miami-Dade County condos: sales up, supply down. I compiled the figures below on April 22, 2010 from the MLS in the exact same manner as I had the night of July 23, 2009. Below, you will find three sets of spreadsheets and graphs: the first pertaining to the inventory of condos throughout Miami-Dade County; the second to those residing only in Miami while the third concentrates on those residing in Miami Beach.
Once again, I divided the supply figures into seven price ranges and included only sales that have closed within the past six months. The last three columns show the percentage change in those statistics when compared to those published nine months earlier for July 2009. It should be rather apparent, with a few exceptions, that the overall pattern is that condo inventory has decreased and closed sales have increased quite considerably within the past nine months. For example, overall condo inventory in Miami-Dade County has decreased 13.78 percent while closed sales have increased 19.23 percent during that time frame which led to a 27.69 percent decrease in the overall months of supply.
The figures in the images below may be a bit difficult to read so I also published the workbook for this month’s Miami & Miami Beach Condo Trends in its entirety. Be sure to check it out. The worksheet and graph tabs can be found along the bottom of the workbook.
Below, you will find the Miami-Dade County condo supply and sales figures for April 2010:


The following statistics encompass only those condos located throughout Miami (not other areas of Dade County such as Miami Beach, Aventura, Sunny Isles Beach, etc.):


The following statistics encompass only those condos located throughout Miami Beach:


Market pessimists will likely argue that the statistics above do not incorporate developer inventory. Commonly known as shadow inventory, developer inventory is typically not recorded in the MLS. However, these people need to bear in mind that closed developer sales also are not included in the figures above. Obviously, shadow inventory was a bigger problem nine months ago than it is today. A more valid argument should point to the home buyer tax credit being the catalyst that increased sales within the past nine months. Personally, however, I feel that the the home buyer tax credit has had a greater impact on the single family home market than the condo market. It has played a very insignificant role in our business and I have spoken to other real estate agents who specialize in condominiums who have encountered the same. With the home buyer tax credit expiring this Friday, we should be able to see within the next three months how instrumental of a role it has played in the increased sales numbers we’ve witnessed.
Miami & Miami Beach Condo Trends – July 2009
I collected the following figures last Thursday night on July 23, 2009. It has been about six months since I last published inventory numbers for condos in Miami-Dade County. The last Miami & Miami Beach Condo Trends post was published on January 19, 2009.
As many of you read earlier today, the Case-Shiller price index rose on a month-to-month basis for the first time in 3 years. 13 of the 20 cities in the index showed month-over-month price gains in May when compared with April 2009. However, Miami was not one of the 13 cities to show an improvement in prices. Home prices in Miami saw a decrease of .8 percent during that period.
There may not have been an increase in home prices in Miami but the figures below show a major improvement in the number of closed condo sales in the previous six months when compared to the closed condo sales in the six months prior to January 2009. For example, there were 3,551 closed condo sales in the six months leading up to January 2009 compared to the 5,007 closed condo sales that occurred within the past six months. That’s an increase of 41 percent. The number of closed condo sales in Miami improved approximately 39 percent while closed condo sales in Miami Beach increased about 20 percent. As a result, the condo supply numbers for each showed considerable improvements as well.
View the entire workbook for this month’s Miami & Miami Beach Condo Trends. The various spreadsheets and graphs are found at the bottom.
Below, you will find the Miami-Dade County condo inventory and supply figures for July 2009:


The following statistics encompass only those condos located throughout Miami (not other areas of Dade County such as Miami Beach, Aventura, Sunny Isles Beach, etc.):


The following statistics encompass only those condos located throughout Miami Beach:


This has been a very atypical year for real estate sales in South Florida. In most years, the vast majority of closed condo sales occur in the Winter months when snowbirds flock to Florida to shop for a vacation home to escape the dreaded cold. However, this past Winter season was unusually slow due to a number of reasons such as the paralyzing fear in the economy and a lack of financing. After the first 3 months of the year, I personally felt that 2009 was shaping up to be my worst year in real estate. However, at the beginning of April, business began to show life again. In fact, activity has drastically improved to the point where 2009 could end up being one of my best years. I personally feel that the Miami condo market is within 2-3 months of reaching the bottom. That’s in no way saying that prices will begin to increase soon after. The overall market needs to move sideways for at least the next 12-24 months before we see any significant increase in sales prices.
Miami & Miami Beach Condo Trends – January 2009
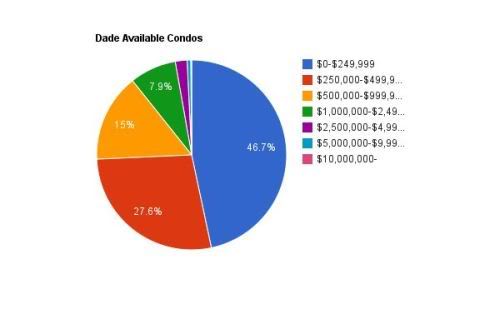
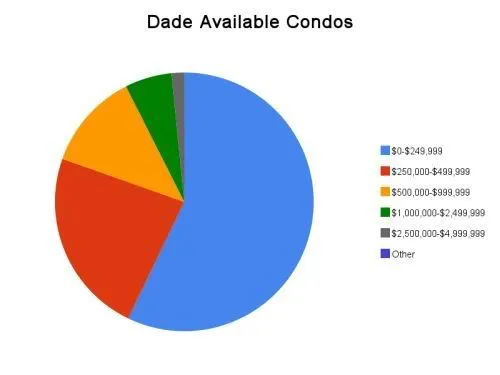
I decided to once again publish the condo inventory and months of supply figures for Miami, Miami Beach and Miami-Dade County as a whole. You’ll notice, however, a few changes to this update. One, you’ll now find viewable spreadsheets. This will make it easier to view the figures without needing to squint your eyes. Click on the View Full Spreadsheet link below each to view it in its entirety. Two, I’ve added pie charts to provide a quick picture as to which price range the condo inventory and closed sales reside. For some reason, however, Google Docs did not allow me to add percentage labels. Three, I calculated the months and years of supply figures using an average of six months worth of closed condo sales.
Below, you will find the Miami-Dade County condo inventory and supply figures for January 2008:
The following statistics encompass only those condos located throughout Miami (not other areas of Dade County such as Miami Beach, Aventura, Sunny Isles Beach, etc.):
The following statistics encompass only those condos located throughout Miami Beach:
I hadn’t previously used a 6 month average to calculate the months and years of supply figures so it’s pretty meaningless to compare this month’s update to previous ones. However, here is the last update published in October 2008 if you’d like to compare the raw numbers.
Miami & Miami Beach Condo Trends – October 2008
Below, you will find the Miami-Dade County condo inventory and months of supply figures for October 2008. The first box to the left reveals the total number of condos that are currently available for sale on the MLS throughout Miami-Dade County. The second box discloses the total number of closed sales that occurred in the month of September 2008. The third and fourth boxes show the months and years of condo supply in Miami-Dade County. As you can see, the figures are also subdivided into various price ranges to reveal which part of the condo market has been most affected. The % change box will show you how the inventory levels have changed since my last update in May 2008.

The overall supply of condos listed in the MLS in Miami-Dade County has dropped from 25,461 to 24,788 since May 2008. On the flip side, the number of closed sales in the previous month has gone up from 474 to 527 creating a 12.51 percent drop in the years of inventory in Miami-Dade County since the last update. It’s once again surprising that inventory levels have dropped despite the thousands of new condos that have been completed and delivered in 2008.
The following statistics encompass only those condos located throughout Miami (not other areas of Dade County such as Miami Beach, Aventura, Sunny Isles Beach, etc.):

The supply of condos in the MLS in Miami has dropped from 10,281 to 9,903 since May 2008. The number of closed sales in the previous month has gone up from 161 to 192 creating a 19.21 percent drop in years of inventory in Miami since the last update. As you can see, a large portion of these closed sales occurred in the $0-$249,999 price range. The inventory levels of the $500,000+ categories, however, have increased.
The following statistics encompass only those condos located throughout Miami Beach:

The supply of condos in the MLS in Miami Beach has dropped from 4,109 to 3,949 since May 2008. However, the number of closed sales in the previous month has also dropped from 113 to 98 creating a 10.82 percent increase in years of inventory for condos in Miami Beach since the last update. In fact, with the exception of the $500,000-$999,999 price range, the years of inventory has risen for each category.
Miami & Miami Beach Condo Trends – May 2008
Earlier this afternoon, someone left a link in the comments area of a previous post to a Florida Association of Realtors article that reveals an improvement in real estate inventory levels for the state of Florida in the first quarter of 2008. I wanted to see how the Miami and Miami Beach condo markets fared in comparison, so I decided to provide new supply figures for May 2008. My last Miami & Miami Beach Condo Trends report was published in February 2008.
Below, you will find the Miami-Dade County condo inventory and months of supply figures for May 2008. The first box to the left reveals the total number of condos that are currently available for sale on the MLS throughout Miami-Dade County. The second box discloses the total number of closed sales that occurred in the month of April 2008. The third and fourth boxes show the months and years of condo supply in Miami-Dade County. As you can see, the figures are also subdivided into various price ranges to reveal which part of the condo market has been most affected.
(Note: If you’re over the age of 40, you may want to have someone younger read the numbers below aloud to you. Either that, or bust out a magnifying glass.)

I was shocked to see that the months and years of supply figure had gone down significantly since my February update. The number of available condos has fallen slightly since February but the number of sold condos in the previous month has gone up about 41 percent. That’s a huge increase in sales activity. I was puzzled that the number of condos on the market actually fell. We’ve seen a lot of new condo buildings begin closings since the beginning of the year. I would have expected the number of available condos on the market to be much higher than in February.
The following statistics encompass only those condos located throughout Miami (not other areas of Dade County such as Miami Beach, Aventura, Sunny Isles Beach, etc.):

The number of available condos on the market went up slightly since February but again the number of closed sales within the previous month showed a proportionately much larger increase. Miami condos experienced around a 44 percent increase in closed sales when compared to the figures presented in February. Miami now has a 5.32 year supply of condos. The $250,000-$499,000 price range has the highest supply at 8.16 years while the $1,000,000-$2,499,9999 is sitting on only 2 years worth of supply.
The following statistics encompass only those condos located throughout Miami Beach:

There’s been a decrease in the number of available condos in Miami Beach since February and about a 57 percent increase in closed condo sales. Miami Beach is now sitting on 3.03 years worth of condos. The $500,000-$999,999 price range has the highest supply of condos at 3.57 years while the $1,000,000-$2,499,999 price range is the healthiest at 2.32 years worth of condos.
What does everyone make of these figures? There’s definitely been an increase in the number of closed condo sales since February. I don’t think anyone can dispute that. However, what is happening to all the new condos that have hit the market since February? I expected sales activity to have picked up because of declining values and better opportunities than were available in February but I also expected to see a much higher number of available condos on the market. Are most of these condos being rented or is it too early to see an impact from the newly constructed condos because developers, for the most part, don’t list there unclosed condos on the MLS?
Miami & Miami Beach Condo Trends – February 2008
Below, you will find the Miami-Dade County condo inventory and months of supply figures for February 2008. The first box to the left reveals the total number of condos that are currently available for sale on the MLS throughout Miami-Dade County. The second box discloses the total number of closed sales that occurred in the month of January 2008. The third and fourth boxes show the months and years of condo supply in Miami-Dade County. As you can see, the figures are also subdivided into various price ranges to reveal which part of the condo market has been affected the most.

Since the January 2008 update, the overall condo supply in Miami-Dade County has increased about 10.3 percent. Most the increase, however, was due to a 25.1 percent increase in the $0-$249,999 price range, where about 41 percent of the overall condo inventory resides. The $250,000-$499,999 and $500,000-$999,999 price ranges had slight increases of 4.5 percent and 2.8 percent, respectively. The $1,000,000-$2,499,999 price range had a big drop of 25.6 percent and the $2,500,000-$4,999,999 price range had an even bigger drop of 39.8 percent in its condo supply.
As many would expect, the lower part of the market is experiencing the most problems, mainly due to it now being much more difficult to obtain financing for those looking to buy in this segment of the market. Those in the market to buy a condo for over $1M, oftentimes, can do so without any financing whatsoever.
The following statistics encompass only those condos located throughout Miami (not other areas of Dade County such as Miami Beach, Aventura, Sunny Isles Beach, etc.):

Miami has continued its upward climb in condo supply this month with a 24.3 percent increase since last month. Again, we see that the lower and upper parts of the market have performed quite dissimilarly. The condo supply in the $0-$249,999 price range has increased 20.6 percent while the $250,000-$499,999 price range has gone up a shocking 62 percent. On the flip-side, the condo supply in the $500,000-$999,999 price range has gone down 26.7 percent and the $1,000,000-$2,499,999 has dropped almost 50 percent.
The following statistics encompass only those condos located throughout Miami Beach:

Overall, Miami Beach experienced a 19 percent drop in its condo supply levels since last month. I was a bit surprised but I probably shouldn’t be. Miami Beach did not come close to experiencing the level of development that we recently saw in Miami. Foreign and out-of-state buyers are also much more likely to buy a condo in Miami Beach than they are somewhere in Miami. I think we will continue to see a widening gap between the Miami and Miami Beach condo supply figures in the months ahead.


