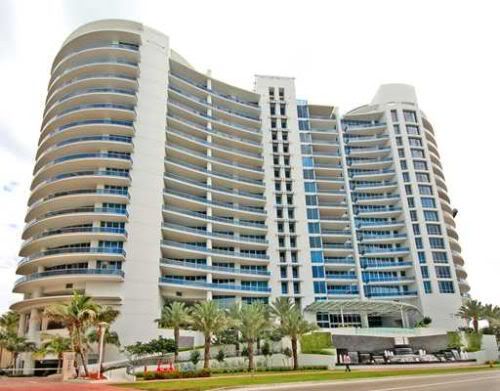
Amar’e Stoudemire Sells W South Beach Penthouse for $5.2M
NBA superstar Amar’e Stoudemire has officially sold his W South Beach penthouse. The transaction closed earlier today and reportedly sold for $5.2M. The sales price represents a 20 percent discount off the $6.5M asking price established this past April. Stoudemire purchased the property directly from the W South Beach developer in July 2009 for $5,575,000. The 2 bedroom/2.5 bath duplex penthouse has 2,428 square feet of interior and an amazing 2,816 square feet of exterior space, including a private rooftop plunge pool and summer kitchen.
Last week, the New York Post reported that Amar’e Stoudemire had recently listed his W South Beach duplex penthouse for $6.5M. As many of you know, Stoudemire plays basketball in the NBA for the New York Knicks. Below, you will find pictures of his plush South Beach condo. The 2 bedroom/2.5 bath unit has 2,428 square feet of interior and 2,816 square feet of exterior space with a private rooftop plunge pool and summer kitchen. Stoudemire purchased the penthouse condo in July 2009 for $5,575,000 directly from the W South Beach developer.
Beachfront Condo Foreclosure with Direct Ocean View at The Bath Club
For those not familiar with the South Florida condo market, The Bath Club is a luxury, beachfront condo development located at 5959 Collins Avenue in Miami Beach. The Bath Club, completed in 2005, offers spectacular amenities such as a tennis court, swimming pool, spa, fitness center, beach service, clubhouse, on-site restaurant, 24-hour concierge and valet parking.
Currently, the only foreclosure available at The Bath Club is unit 607. It’s a 2 bedroom/3.5 bath condo with 2,959 square feet of interior and a direct view of the Atlantic Ocean. The asking price is $1.15M, or $389 per square foot, which is the lowest price per square foot offered at The Bath Club. The next lowest priced 07 in the building, a unit just one floor higher, is asking $2.2M. Over the past six months, only one 07 unit has sold. Unit 1707 sold for $2M, or $676 per square foot. Contact us at 305-428-3860 or [email protected] if you would like to learn more about unit 607 at The Bath Club or schedule a showing.
iStar Financial Takes Ownership of South of Fifth
Earlier today, iStar Financial announced that it will now have full ownership of the luxury beachfront condominium project known as South of Fifth. iStar Financial had recently filed and won a foreclosure action against the developer of South of Fifth, BR Villa Luisa. Completed in 2008, South of Fifth is located at 125 Ocean Drive in the South of Fifth neighborhood of Miami Beach, Florida. 25 units remain unsold in the 28-unit luxury building along the picturesque beaches of South Beach.
Two Recent Luxury Beachfront Condo Sales
Two luxury beachfront condos closed within the past two days. The first, located at Continuum South Tower, closed yesterday for $6,750,000, or $1622 per square foot. The 3 bedroom/3.5 bath condo is located on the 18th floor and has 4,161 square feet of interior. Not my taste at any price but I’m sure there’s someone out there who appreciates this type of decor.
The second condo sale took place at Acqualina in Sunny Isles Beach. The sales price was $4.8M, or $837 per square foot, for a penthouse located on the 46th floor. The unit has 4 bedrooms, 5 full baths and 2 half bath with 5,735 square feet of interior and 1,990 square feet of exterior.
Miami Real Estate Review FaceBook Fan Page
Yesterday afternoon, we launched the Miami Real Estate Review FaceBook Fan Page. We have big plans for the fan page so be sure to add us. Starting next week, we will provide daily updates in regards to the Miami real estate market. Important market news, recently closed sales and the best real estate deals currently on the market will be highlighted. The information will be provided in an abridged, concise manner to allow daily updates to be made possible. Of particular note to some, the Miami Real Estate Review Fan Page will have a discussion forum. Participants will be able to create discussion topics and provide their input.
South of Fifth – Miami Beach’s Ultra-Luxury Neighborhood
The video above is meant for the non-local buyer who may not be familiar with the various neighborhoods throughout South Florida. South of Fifth, also known as SoFi, is a neighborhood that encompasses the five southern most blocks of South Beach (and therefore Miami Beach). Once regarded as one of the most dangerous neighborhoods in South Florida, South of Fifth is now considered to be one of the safest and most luxurious for condo living. The revitalization of the area within the past two decades has been remarkable, attributed mainly to visionary Thomas Kramer.
One of the main attractions for South of Fifth condos is South Pointe Park which reopened in March 2009 after undergoing a $22M renovation. The neighborhood also has world-renowned restaurants Joe’s Stone Crab and Prime 112 as well as local favorites Devito South Beach, Smith & Wollensky and China Grill. South of Fifth is reputed for being a clean, quiet, exclusive neighborhood away from the congestion of South Beach but within walking distance to all else that South Beach has to offer. The beach at the southernmost point of Miami Beach, in my opinion, is also one of the most beautiful beaches in South Florida.
Below, you will find a list of the South of Fifth condo buildings that were featured in the video. Click on each link to view the condos currently available for sale.
Video Demonstration of the Miami Condo Investments iPhone App
Below, you’ll find a video demonstration of the Miami Condo Investments iPhone app. It was released this past January and we’ll be releasing an update late next month. The app is free and can be downloaded at the iTunes app store.
Apogee South Beach Unit 2001 – Video Tour
Below, you will find a video tour of unit 2001 at Apogee. Apogee is located at 800 South Pointe Drive in the South of Fifth neighborhood of South Beach. Apogee is considered to be one of the finest condo buildings in all of South Florida. Unit 2001 is a 4 bedroom + media room/3.5 bath condo with 4,154 square feet of interior and 2,441 square feet of terrace. The asking price of this 20th floor corner unit is $7.75M, or $1866 per square foot. Unit 2004, a 4 bedroom of the same size located on the opposite corner, closed in July 2008 for $7.3M, or $1757 per square foot. It was sold decorator ready just as unit 2001 is being sold. Contact us at 305-428-3860 if you have any questions or would like to visit unit 2001 in person.