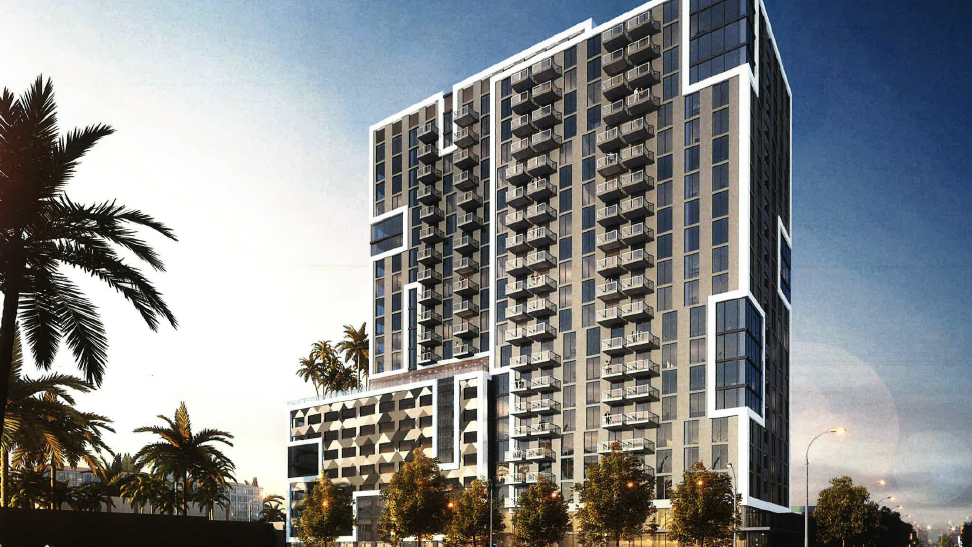
Avalon Merrick Park Tower Under Construction in Miami
Photo Credit: L & R Structural Corp., Inc.
Avalon Merrick Park is a new construction apartment tower located at 3811 Shipping Avenue in Miami. The 20-story tower will be located near the Douglas Road Metrorail Station.
When it was originally proposed by the developer, Mast Capital, it was named Shipping Avenue Apartments. After AvalonBay Communities purchased the properties for $12.9 million, AvalonBay entered into a joint venture on the project after Mast Capital took it through the approval process. Mast will remain a partner and is the co-developer for this project.
The shell contractor is L&R Structural and the architect will include Arquitectonica.
Avalon Merrick Park will feature 254 residential units with a studio to 3 bedroom floor plan options. The tower will also include 10,000 + square feet of amenities with the main floor housing 825 square feet of retail space. An 8-story attached garage will feature 319 parking spaces.
Building Amenities
State-of-the-art fitness center with professional-grade cardio and strength equipment
Rooftop, resort-style pool and sundeck with BBQ area and seating
Pet-friendly living with WAG Pet Spa
Coworking space including workspace pods and reservable conference rooms
WiFi access available in common areas
Package lockers for 24/7 package acceptance
Smoke-free living
Controlled access garage parking
Bike storage
Easily accessible to retail and dining, including the Shops at Merrick Park
One mile to Coral Gables and convenient to Downtown Miami, Brickell, and Coconut Grove
Residence Amenities
Studio, one, two, and three-bedroom floor plans
Modern kitchens with quartz countertops, tile backsplash, stainless steel appliances, LED lighting, and hard surface flooring
Washer/Dryer in all homes
Walk-in closets
Air conditioning
Avalon Merrick Park is centrally located near retail, shopping, and dining. Located 1 mile from Coral Gables and 5 miles from downtown Miami. Leasing begins in 2023 with construction completion in early 2024.
Tenant Sues Condo Association For Price Gouging On Application Fees
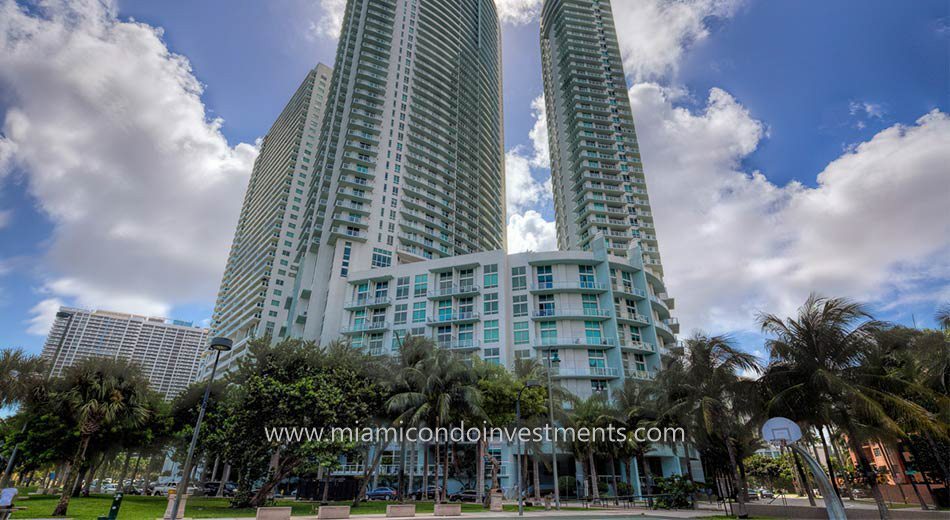
Quantum on the Bay
A tenant at Quantum on the Bay in the Omni district finally did something about the high application fees that are being charged to prospective tenants, according to the Miami Herald. He is suing them because their application fees are in excess of the $100 cap that the Florida statute issues.
This has been an ongoing problem for tenants in many of the Downtown area buildings for several years. Some condo associations use these elevated fees in order to avoid having to make a special assessment on the unit owners for repairs or upgrades. The association at Quantum once had a $400 application fee, but it was later reduced to $150 after so many potential tenants complained. In order to continue bringing the income that they once received from the application fees, they split it into the application fee plus the administrative fees. Some other buildings have ‘impact fees’ of $500, but Quantum is one of the highest priced buildings in the area for a tenant to apply for.
Even though it is not lawful for a building to charge these exorbitant fees to tenants, many still do. The tenants really have no choice but to accept the fees. Protesting only causes delay and added expenses. If they miss their move-in date, they would need to stay at a hotel until the issue is resolved and there is still no guarantee that it would be resolved in their favor without a lawsuit. The Government Affairs department of our Miami Association of Realtors has been lobbying in Tallahassee for some time already, trying to convince them to enforce the laws.
Now, most buildings also charge a security deposit for the common areas and for pets, but that is different. Security deposits are returned. We typically see a security deposit that is held through the duration of the lease in order to guarantee there will not be damage to the common areas, a smaller security deposit for the actual move to guarantee that the elevators and hallways are not damaged by the movers and/or a pet deposit to the building.
You can read more about the Florida Condominium Act here, so that you know your rights. While it seems that Quantum is being singled out, this is a large problem throughout the marketplace and something that we are striving to change. On a day to day basis, the best we can do is see that our clients get settled as peacefully and efficiently as possible. On a larger scale, we are very much a part of the efforts from the Miami Association of Realtors to bring change to this practice.
Terra’s David Martin Debuts his New Real Estate Column in Forbes
David Martin
A warrior and a poet? Meh. Maybe not, but David Martin, head of Terra Group and developer of Grove at Grand Bay, Park Grove, and GLASS, is now a developer and an author. He’s writing a twice-monthly column over at Forbes on ‘real estate development, design, and sustainability,’ beginning with a discussion on why more buyers in South Florida are end users these days as opposed to speculators. To summarize his point in just a few words: Miami’s a bit more grown up, and that makes a big difference.
Week in Review: How to Avoid the Federal Disclosure Law for Cash Purchases and Other News…
Rendering from Paramount Miami Worldcenter
Week of January 17-23, 2016.
The US Treasury announced this week that starting in March, title companies will be required to disclose the identities of buyers to government regulators for all cash purchases above $1 million in Miami’s residential real estate market. They are hoping to put a stop to illicit funds being laundered through the cash purchases, but effectively are also spooking legitimate buyers who simply do not wish to have their buying habits publicly disclosed.
Fear not, fancy condo shoppers. The ink is not even dry on the new order and The Real Deal has already compiled a list of 7 ways that the rule can be circumvented. [The Real Deal]
Last week, the developer of Miami Worldcenter announced that it is scrapping the plans for an enclosed mall just days after Macy’s announced multiple store closings due to slow sales. After this announcement Taubman and Forbes cancelled their contract with Worldcenter, causing a flurry of rumors and news stories stating that the project would be scrapped. It turns out that everyone jumped the gun. According to the developer and this Taubman release, the project is not scrapped. The contract just needs to be renegotiated to reflect the new building plans. [Zacks]
While everyone was up in arms about the potential drama at Miami Worldcenter, Brickell CityCentre released their updated list of all retailers, shops and restaurants that will be opening with the mall. The shops will begin individual build-out soon and is scheduled to open later in the year. [The Next Miami]
In possibly the least surprising news of the week, Car2Go finally announced that they are suspending service effective March 1. They say that the reason for the service-shuttering is low ridership and high state taxes, locals have not wasted time or minced words with their own theories. It seems they have been in trouble with their client base for some time due to poor handling of a PR incident involving a drunk driving accident, not offering service in many important areas of the community, poor customer service and unreliable service. We think it can be easily explained by simple economics… why pay more to drive yourself in a shared smart car with a complicated service when you can pay less and have an Uber car pick you up at your doorstep and drop you off wherever you want to go? The choice is simple. [Curbed]
Miami & Miami Beach Condo Supply Down Sharply
Thanks in large part to a strong interest from international buyers, the South Florida condo market has fared extremely well over the past year despite global economic worries. One would assume that the supply of condos has shrunk as a result, but to what extent? Is the condo inventory problem finally a thing of the past? Does the current supply of condos indicate a transition from a buyer’s market to that of a seller’s market? The condo inventory and sales figures below should shed light on the subject to help answer these questions.
The figures below were compiled on August 31, 2011. Three sets of spreadsheets and graphs can be found below. The first pertains to the inventory and sales figures for condos throughout Miami-Dade County. The second focuses on those located only in Miami while the third set concentrates on condos residing only in Miami Beach.
I grouped the number of available condos into seven distinct price ranges and provided total closed sales figures over the past six months for each. Columns three, four and five display figures for average closed sales per month, months of supply and years of supply, respectively. The last three columns show the percentage change in those figures when compared to those published slightly over 16 months earlier in April 2010.
As you will see, there is currently a little over 6 months worth of condos for sale throughout Miami-Dade County. Obviously, the supply figures vary within each price range and again when looking at the figures specific to Miami and Miami Beach. It is important to note that the figures below only include resales listed on the MLS. Developer inventory and closed sales are not included. My guess is that the statistics would be even more compelling had those figures been included. To put things into perspective, I recently heard that Icon Brickell had been averaging around 60 closed sales per month. With 1,796 total units, Icon Brickell had been the poster child of the oversupply problem in Miami. Icon Brickell currently has less than 100 available condos for sale. Word on the street is that sales for condos at Paramount Bay will launch later this month. Once it does, Paramount Bay will be the last of the recently constructed condo developments to hit the market and will add just 350 total units. Many of those condos have already been secured by original contract holders and interest from potential buyers for the remaining units is staggering. A shortage of condos in Miami is an almost certain problem that lurks on the horizon. Keep in mind, even if new condo developments were planned and approved tomorrow, it would be another 3-5 years for those condos to be completed and delivered.
Below, you will find the Miami-Dade County condo supply and sales figures for August 2011:
The following statistics encompass only those condos located throughout Miami (not other areas of Dade County such as Miami Beach, Aventura, Sunny Isles Beach, etc.):
The following statistics encompass only those condos located throughout Miami Beach:
developer inventory
Miami & Miami Beach Condo Trends – April 2010
They say numbers don’t lie. If that be the case, one message of truth shines through in the inventory figures below when compared to the ones I calculated exactly nine months earlier for Miami-Dade County condos: sales up, supply down. I compiled the figures below on April 22, 2010 from the MLS in the exact same manner as I had the night of July 23, 2009. Below, you will find three sets of spreadsheets and graphs: the first pertaining to the inventory of condos throughout Miami-Dade County; the second to those residing only in Miami while the third concentrates on those residing in Miami Beach.
Once again, I divided the supply figures into seven price ranges and included only sales that have closed within the past six months. The last three columns show the percentage change in those statistics when compared to those published nine months earlier for July 2009. It should be rather apparent, with a few exceptions, that the overall pattern is that condo inventory has decreased and closed sales have increased quite considerably within the past nine months. For example, overall condo inventory in Miami-Dade County has decreased 13.78 percent while closed sales have increased 19.23 percent during that time frame which led to a 27.69 percent decrease in the overall months of supply.
The figures in the images below may be a bit difficult to read so I also published the workbook for this month’s Miami & Miami Beach Condo Trends in its entirety. Be sure to check it out. The worksheet and graph tabs can be found along the bottom of the workbook.
Below, you will find the Miami-Dade County condo supply and sales figures for April 2010:
The following statistics encompass only those condos located throughout Miami (not other areas of Dade County such as Miami Beach, Aventura, Sunny Isles Beach, etc.):
The following statistics encompass only those condos located throughout Miami Beach:
Market pessimists will likely argue that the statistics above do not incorporate developer inventory. Commonly known as shadow inventory, developer inventory is typically not recorded in the MLS. However, these people need to bear in mind that closed developer sales also are not included in the figures above. Obviously, shadow inventory was a bigger problem nine months ago than it is today. A more valid argument should point to the home buyer tax credit being the catalyst that increased sales within the past nine months. Personally, however, I feel that the the home buyer tax credit has had a greater impact on the single family home market than the condo market. It has played a very insignificant role in our business and I have spoken to other real estate agents who specialize in condominiums who have encountered the same. With the home buyer tax credit expiring this Friday, we should be able to see within the next three months how instrumental of a role it has played in the increased sales numbers we’ve witnessed.
As many of you read earlier today, the Case-Shiller price index rose on a month-to-month basis for the first time in 3 years. 13 of the 20 cities in the index showed month-over-month price gains in May when compared with April 2009. However, Miami was not one of the 13 cities to show an improvement in prices. Home prices in Miami saw a decrease of .8 percent during that period.
There may not have been an increase in home prices in Miami but the figures below show a major improvement in the number of closed condo sales in the previous six months when compared to the closed condo sales in the six months prior to January 2009. For example, there were 3,551 closed condo sales in the six months leading up to January 2009 compared to the 5,007 closed condo sales that occurred within the past six months. That’s an increase of 41 percent. The number of closed condo sales in Miami improved approximately 39 percent while closed condo sales in Miami Beach increased about 20 percent. As a result, the condo supply numbers for each showed considerable improvements as well.
View the entire workbook for this month’s Miami & Miami Beach Condo Trends. The various spreadsheets and graphs are found at the bottom.
Below, you will find the Miami-Dade County condo inventory and supply figures for July 2009:
The following statistics encompass only those condos located throughout Miami (not other areas of Dade County such as Miami Beach, Aventura, Sunny Isles Beach, etc.):
This has been a very atypical year for real estate sales in South Florida. In most years, the vast majority of closed condo sales occur in the Winter months when snowbirds flock to Florida to shop for a vacation home to escape the dreaded cold. However, this past Winter season was unusually slow due to a number of reasons such as the paralyzing fear in the economy and a lack of financing. After the first 3 months of the year, I personally felt that 2009 was shaping up to be my worst year in real estate. However, at the beginning of April, business began to show life again. In fact, activity has drastically improved to the point where 2009 could end up being one of my best years. I personally feel that the Miami condo market is within 2-3 months of reaching the bottom. That’s in no way saying that prices will begin to increase soon after. The overall market needs to move sideways for at least the next 12-24 months before we see any significant increase in sales prices.
Miami & Miami Beach Condo Trends – January 2009
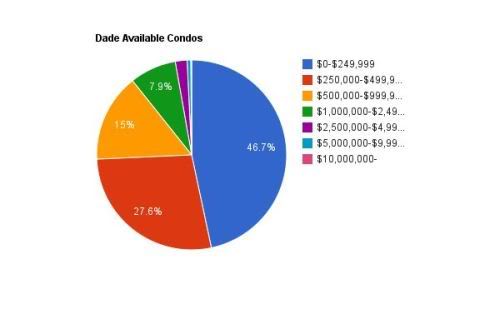
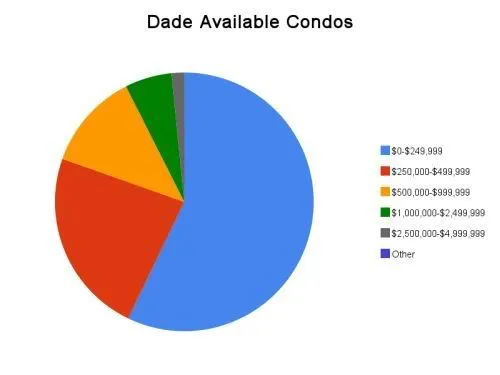
I decided to once again publish the condo inventory and months of supply figures for Miami, Miami Beach and Miami-Dade County as a whole. You’ll notice, however, a few changes to this update. One, you’ll now find viewable spreadsheets. This will make it easier to view the figures without needing to squint your eyes. Click on the View Full Spreadsheet link below each to view it in its entirety. Two, I’ve added pie charts to provide a quick picture as to which price range the condo inventory and closed sales reside. For some reason, however, Google Docs did not allow me to add percentage labels. Three, I calculated the months and years of supply figures using an average of six months worth of closed condo sales.
Below, you will find the Miami-Dade County condo inventory and supply figures for January 2008:
The following statistics encompass only those condos located throughout Miami (not other areas of Dade County such as Miami Beach, Aventura, Sunny Isles Beach, etc.):
The following statistics encompass only those condos located throughout Miami Beach:
I hadn’t previously used a 6 month average to calculate the months and years of supply figures so it’s pretty meaningless to compare this month’s update to previous ones. However, here is the last update published in October 2008 if you’d like to compare the raw numbers.
Miami & Miami Beach Condo Trends – October 2008
Below, you will find the Miami-Dade County condo inventory and months of supply figures for October 2008. The first box to the left reveals the total number of condos that are currently available for sale on the MLS throughout Miami-Dade County. The second box discloses the total number of closed sales that occurred in the month of September 2008. The third and fourth boxes show the months and years of condo supply in Miami-Dade County. As you can see, the figures are also subdivided into various price ranges to reveal which part of the condo market has been most affected. The % change box will show you how the inventory levels have changed since my last update in May 2008.
The overall supply of condos listed in the MLS in Miami-Dade County has dropped from 25,461 to 24,788 since May 2008. On the flip side, the number of closed sales in the previous month has gone up from 474 to 527 creating a 12.51 percent drop in the years of inventory in Miami-Dade County since the last update. It’s once again surprising that inventory levels have dropped despite the thousands of new condos that have been completed and delivered in 2008.
The following statistics encompass only those condos located throughout Miami (not other areas of Dade County such as Miami Beach, Aventura, Sunny Isles Beach, etc.):
The supply of condos in the MLS in Miami has dropped from 10,281 to 9,903 since May 2008. The number of closed sales in the previous month has gone up from 161 to 192 creating a 19.21 percent drop in years of inventory in Miami since the last update. As you can see, a large portion of these closed sales occurred in the $0-$249,999 price range. The inventory levels of the $500,000+ categories, however, have increased.
The following statistics encompass only those condos located throughout Miami Beach:
The supply of condos in the MLS in Miami Beach has dropped from 4,109 to 3,949 since May 2008. However, the number of closed sales in the previous month has also dropped from 113 to 98 creating a 10.82 percent increase in years of inventory for condos in Miami Beach since the last update. In fact, with the exception of the $500,000-$999,999 price range, the years of inventory has risen for each category.