

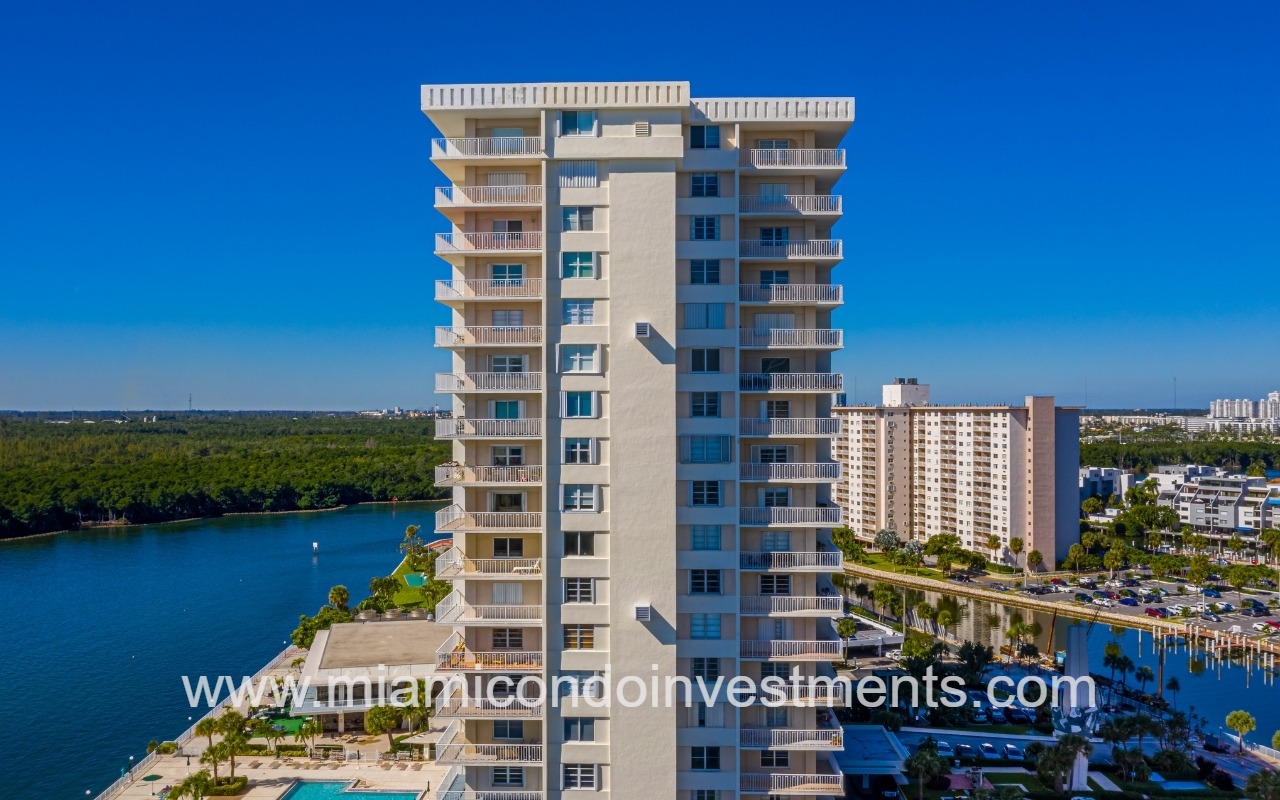







Arlen House Condo
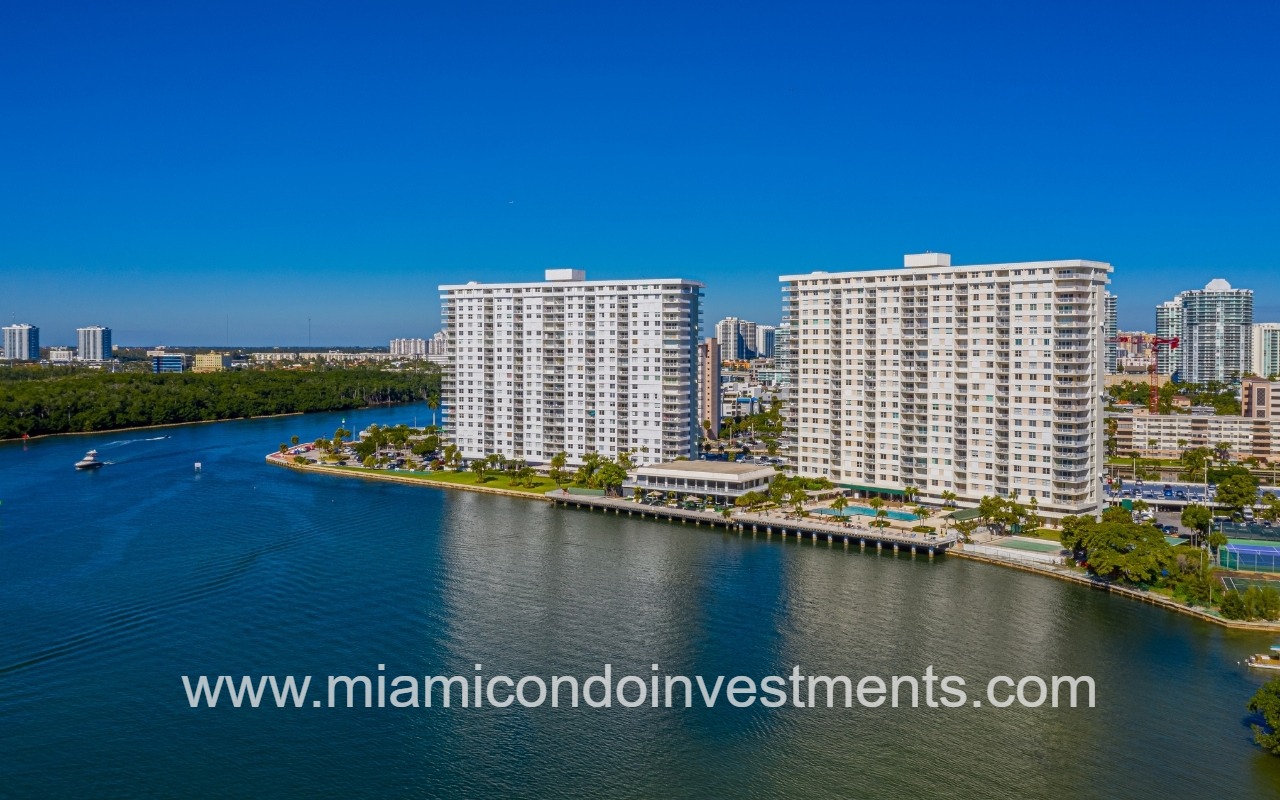
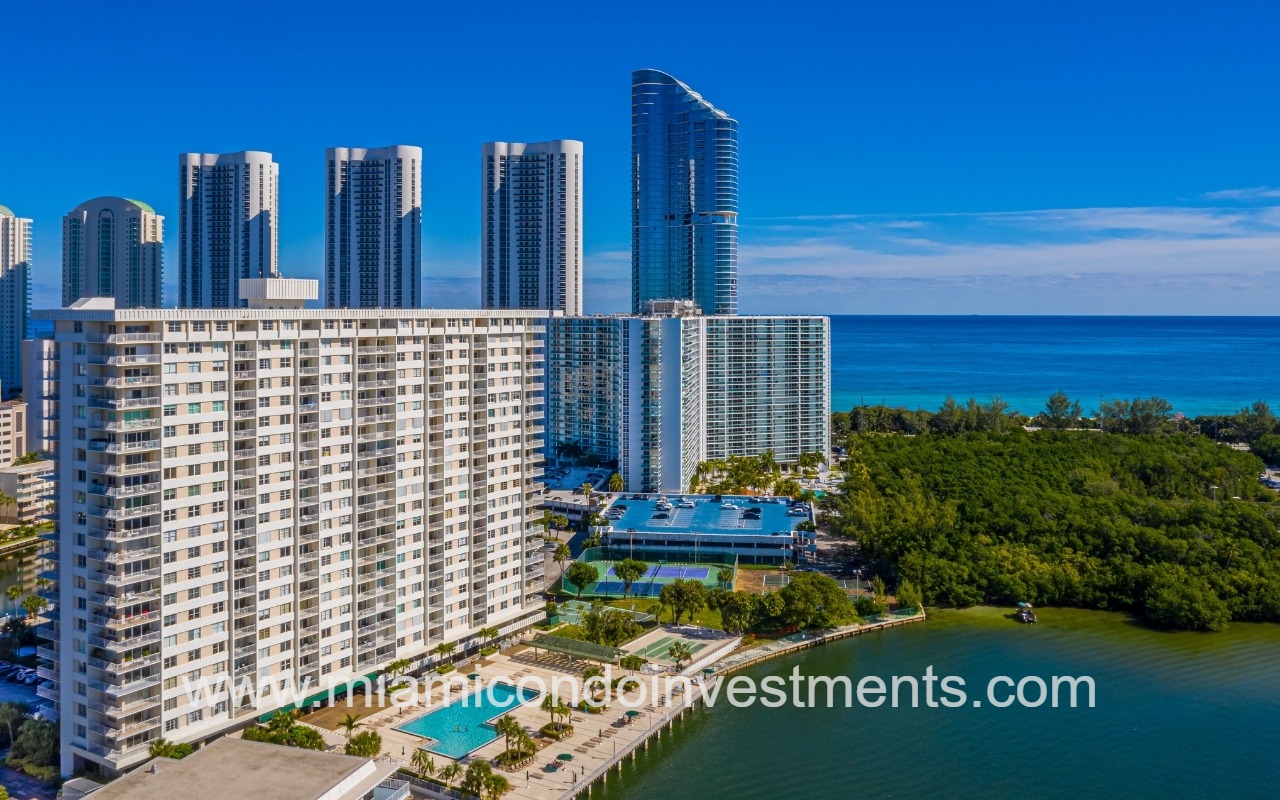
Arlen House Condo drone of waterfront building and surrounding area
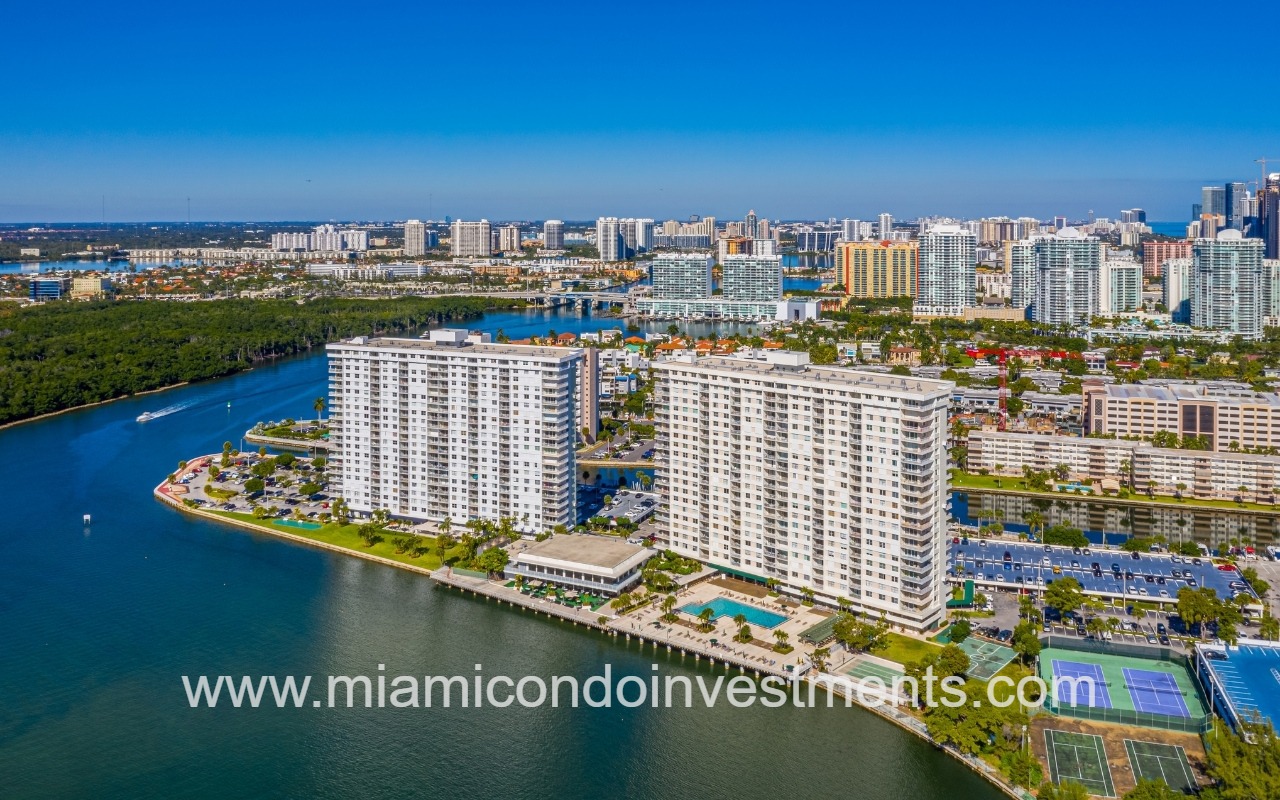
Arlen House Condo drone of building on waterfront side angle
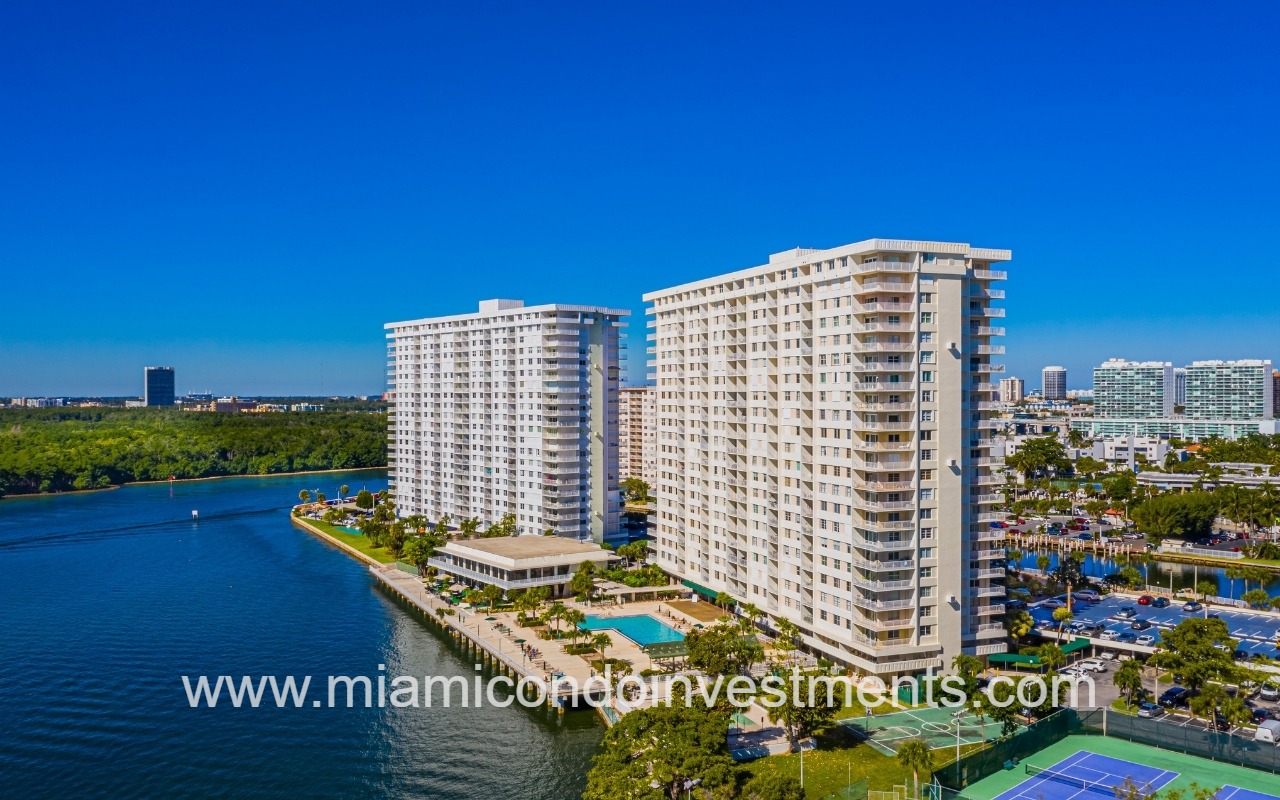
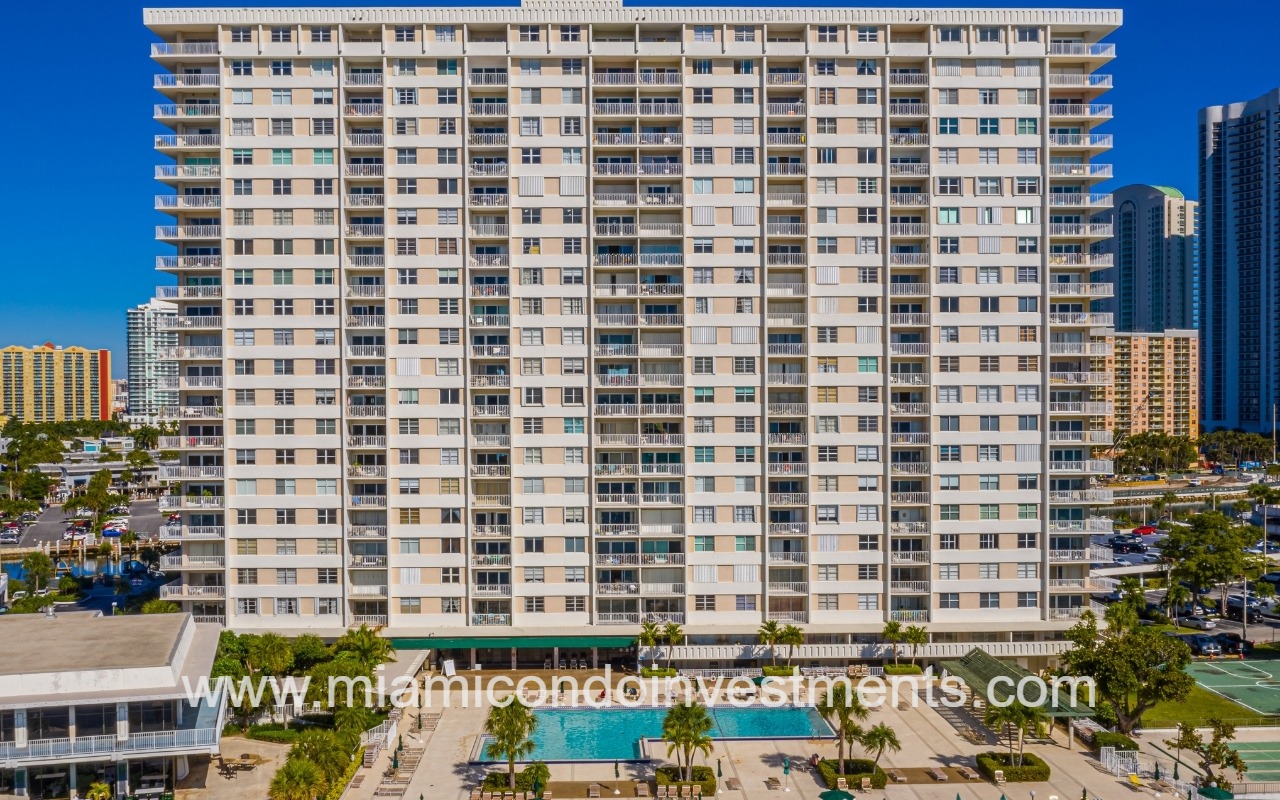
Arlen House Condo drone facing building and pool
Arlen House Condo drone of waterfront building and ocean view
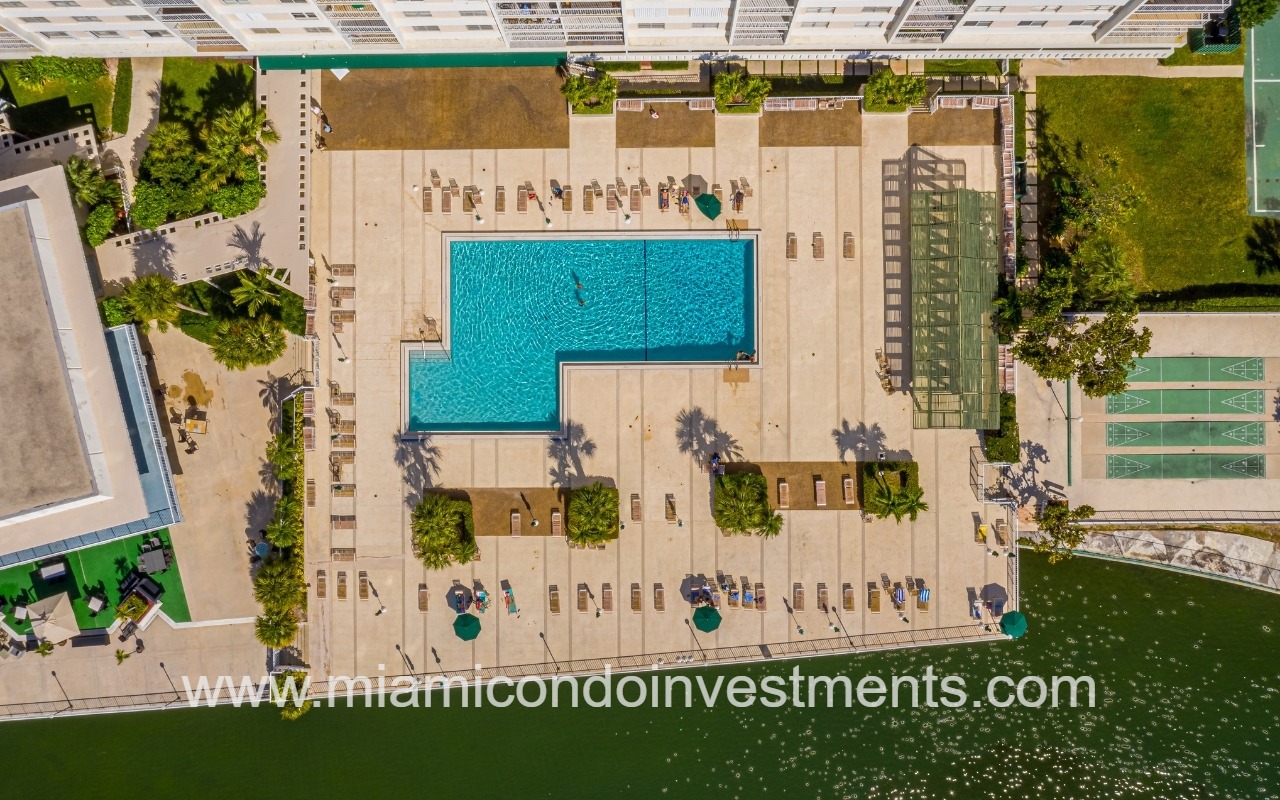
Arlen House Condo drone top downward view of pool and sundeck
Arlen House Condo drone facing building and pool closeup
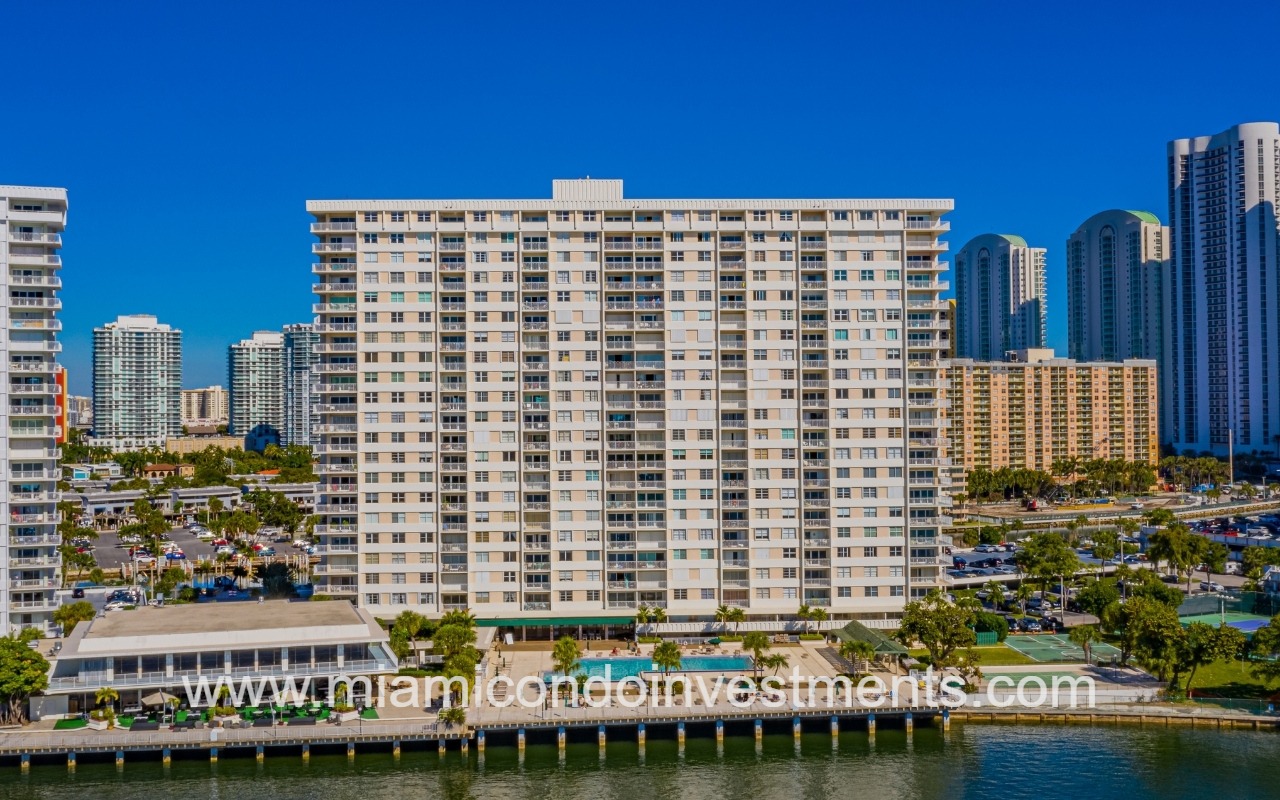
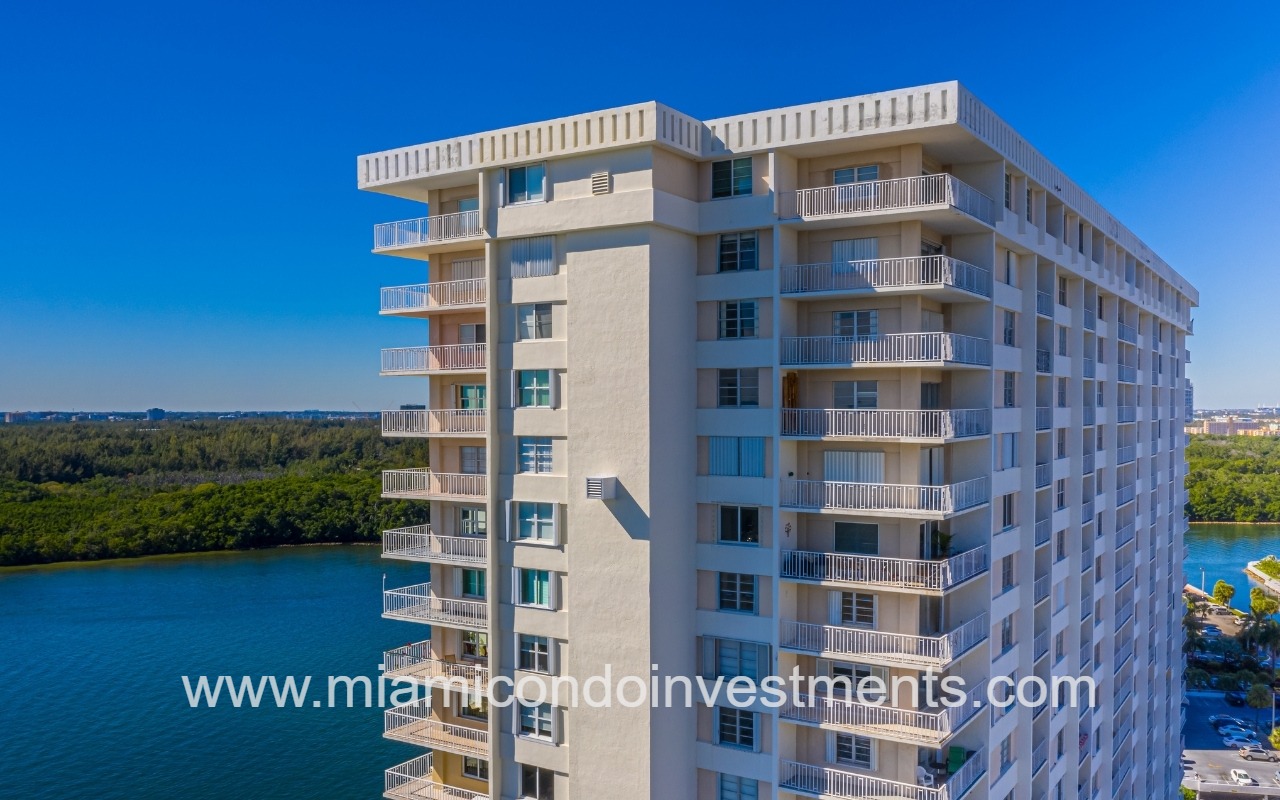
Arlen House Condo drone of top half of building
Arlen House Condo drone of side building profile

Arlen House Condo Market Stats

Sales

  • Average List Price / SQFT
    $344
  • Min List Price / SQFT
    $252
  • Max List Price / SQFT
    $475
  • Months of Inventory
    10.1
  • Units Sold Within the Past 3 Months
    8
  • Units Sold Within the Past 6 Months
    14
  • Units Sold Within the Past 12 Months
    25
  • Units Sold Within the Past 24 Months
    38
  • Available Units For Sale
    21
  • % of Total Units Available For Sale
    6.7%
  • Min Sales Price / SQFT (6 months)
    $252
  • Max Sales Price / SQFT (6 months)
    $418
  • Average Sales Price / SQFT (3 months)
    $295
  • Average Sales Price / SQFT (6 months)
    $320
  • Average Sales Price / SQFT (12 months)
    $326
  • Average Sales Price / SQFT (24 months)
    $339

Information deemed reliable but not guaranteed.

Rentals

  • Average List Price / SQFT
    $2.84
  • Available Units For Rent
    13
  • % of Total Units Available For Rent
    4.2%
  • Months of Inventory
    13.0
  • Units Rented Within the Past 3 Months
    2
  • Units Rented Within the Past 6 Months
    5
  • Units Rented Within the Past 12 Months
    12
  • Units Rented Within the Past 24 Months
    35

Information deemed reliable but not guaranteed.

Arlen House Condo Charts

  • Year

  • AVG $ /SQ FT

  • Transactions

  • Year

  • AVG $ /SQ FT

  • Transactions